Impax Environmental Markets PLC Net Asset Value(s)
November 08 2024 - 6:53AM
RNS Regulatory News

RNS Number : 5675L
Impax Environmental Markets PLC
08 November 2024
|
Impax Environmental Markets
plc (the 'Company')
|
|
|
LEI: 213800RAR6ZDJLZDND86
|
|
|
|
|
|
The Company announces that as at the
close of business on 7 November 2024 its unaudited net asset value
("NAV") per ordinary share ("Share") was as follows:
|
|
|
|
|
NAV per Share with Debt at Fair
Value
|
446.60p
|
|
NAV per Share with Debt at Book
Cost
|
447.41p
|
|
|
|
|
NAV are unaudited, and calculated in
accordance with the Company's accounting policies and the
guidelines of the Association of Investment Companies. Investments
in the Company's portfolio have been valued on a bid price basis.
The cum income NAV per Share includes current financial year
revenue items.
|
|
|
|
|
No adjustment for dilution to the
above NAV has been made in respect of any Shares held in treasury
as the Company's presently stated policy is that treasury shares
will not be sold at less than NAV.
|
|
|
|
|
|
|
|
Enquiries:
|
|
|
Company Secretary
|
|
|
Apex Listed Companies Services (UK)
Ltd
|
Tel: +44
(0) 20 3327 9720
|
This information is provided by RNS, the news service of the
London Stock Exchange. RNS is approved by the Financial Conduct
Authority to act as a Primary Information Provider in the United
Kingdom. Terms and conditions relating to the use and distribution
of this information may apply. For further information, please
contact
rns@lseg.com or visit
www.rns.com.
RNS may use your IP address to confirm compliance with the terms
and conditions, to analyse how you engage with the information
contained in this communication, and to share such analysis on an
anonymised basis with others as part of our commercial services.
For further information about how RNS and the London Stock Exchange
use the personal data you provide us, please see our
Privacy
Policy.
END
NAVBDBDBDUGDGSI
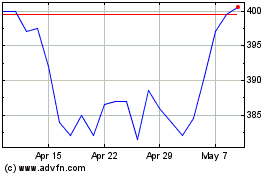
Impax Environmental Mark... (LSE:IEM)
Historical Stock Chart
From Dec 2024 to Jan 2025

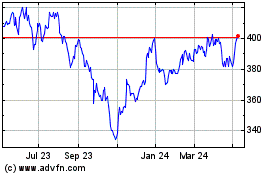
Impax Environmental Mark... (LSE:IEM)
Historical Stock Chart
From Jan 2024 to Jan 2025
