UNITED STATES
SECURITIES AND EXCHANGE COMMISSION
Washington, D.C. 20549
FORM 6-K
REPORT OF FOREIGN PRIVATE ISSUER
PURSUANT TO RULE 13a-16 OR 15d-16
UNDER THE SECURITIES EXCHANGE ACT OF 1934
For the month of October, 2023
Commission File Number: 001-41638
AMBIPAR EMERGENCY RESPONSE
(Exact name of registrant as specified in its
charter)
Avenida Angélica, nº 2346, 5th
Floor
São Paulo, São Paulo, Brazil,
01228-200
Tel: +55 (11) 3526-3526
(Address of principal executive office)
Indicate by check mark whether the registrant files or will file annual
reports under cover of Form 20-F or Form 40-F:
Form 20-F x
Form 40-F ¨
Indicate by check mark if the registrant is submitting the Form 6-K
in paper as permitted by Regulation S-T Rule 101(b)(1): Yes ¨ No x
Indicate by check mark if the registrant is submitting the Form 6-K
in paper as permitted by Regulation S-T Rule 101(b)(7): Yes ¨
No x
EXHIBIT INDEX
SIGNATURE
Pursuant to the requirements of the Securities
Exchange Act of 1934, the registrant has duly caused this report to be signed on its behalf by the undersigned, thereunto duly authorized.
Date: October 10, 2023
| |
AMBIPAR EMERGENCY RESPONSE |
| |
|
|
| |
By: |
/s/Thiago da Costa
Silva |
| |
Name: |
Thiago da Costa Silva |
| |
Title: |
Director |
Exhibit
99.1

INDEX
| LETTER
TO SHAREHOLDERS |
3 |
| AMBIPAR
RESPONSE |
5 |
| HIGHLIGHTS |
6 |
| GROSS
REVENUE |
6 |
| NET
REVENUE |
10 |
| COST
OF PRODUCTS/SERVICES (CASH) |
10 |
| GROSS
PROFIT |
12 |
| EBITDA |
12 |
| FINANCIAL
RESULTS |
13 |
| NET
INCOME |
13 |
| CAPITAL
STRUCTURE |
13 |
| ROIC |
16 |
| CAPEX |
17 |
| ANNEXES |
18 |
LETTER
TO SHAREHOLDERS
To
our shareholders
In
2023, Ambipar Response (hereinafter referred to as "Response" or "the Company") proudly completed its listing on
the NYSE American, achieving a gross capitalization of US$ 174 million. This listing not only amplifies our visibility but also fortifies
our financial position, grants us access to the world's most advanced capital markets, and places us at the forefront of corporate governance
standards.
As
this letter marks our inaugural results release, we have structured it into three main sections:
1. Historical
Overview and Strategy
2. Capital
Allocation
3. Final
Thoughts
Historical
Overview and Strategy
The
trajectory of listing Response on the NYSE American dates back to 1995 when Tercio Borlenghi Junior started a small in-house Emergency
Response business to protect their own logistics operations from environmental risk when transporting HAZMAT. Fast forward decades, this
original family-owned business effectively became a big company, subsidiary of Ambipar Group, listed as a public company.
From
those early years, and most prominently from 2010 to current days, Ambipar Response has undergone through incredible transformation.
Our Company witnessed a rapid acceleration in our global growth, a solidification of our value proposition, consolidation of its leadership
in several markets, and a notable increase in brand awareness.
We
expanded and streamlined our operations into four core business units: emergency response, marine response, industrial response, and
environmental response. We also established a presence in four key regions, adopting a matrix management approach. Our primary objective
is to offer a comprehensive suite of services from these business units in the regions we operate.
Our
clientele operates in sectors that are fraught with operational and environmental risks – encompassing manufacturing, chemicals,
pulp and paper, mining, and Hazmat logistics. Clients require specialized services providers capable of executing higher risk services
– such as tank cleaning, decontamination, decommissioning, environmental consulting, emergency response, confined space cleaning,
handling of contaminant materials - that ultimately safeguard their assets, personnel, and the environment.
Our
vision for Response is to be the premier global provider of such risk environmental services, delivering a standardized and complete
portfolio of services to our clients wherever they may be.
Our
business model emphasizes standardization and readiness at scale, built on four pillars:
| 1. | Highly
trained personnel |
| 2. | Standardized
equipment and procedures |
| 3. | Centralized
command centers |
These
pillars underpin our rapid growth while ensuring we maintain the highest quality of service in the field.
Scale
is instrumental in achieving optimal returns on investment. It enables us to share assets and personnel across vast geographies, ensuring
efficient asset utilization and maximizing the potential of our resources – akin to "squeezing more juice from the same oranges."
Capital
Allocation
Our
business presents great organic and inorganic investment opportunities.
We
are constantly presented with opportunities to deploy capital at attractive returns to invest in service centers, vehicles, vessels,
helicopters, equipment, and personnel. Throughout our journey, we’ve also come across acquisitions as a way to accelerate growth,
bring great people and services to our Company.
As
evidenced by our organic growth, operational margins, and ROIC, our acquisitions have become part of the Ambipar Response ecosystem and
consistently added economic value and positioned us to keep on growing profitably. The underlying reason relies, among others, on rebranding
acquisitions to Ambipar Response, upgrading assets, training personnel, bundling services and training sales teams enables Response to
achieve constantly growing results.
Final
Thoughts
Many
of the markets we operate in, notably North America, are fragmented and demand standardized, high-quality services to cater to their
vast dimensions and extensive industrial and supply chains. We have successfully established leading positions in Brazil and LatAm and
intend to replicate our successful playbook in other regions. This presents a timely opportunity.
Our
NYSE American listing has endowed us with an additional currency – the AMBI shares – enabling us to pursue strategic acquisitions
and attract individuals keen on contributing to the construction of a global leader in environmental risk services.
We
extend our heartfelt gratitude for your partnership as an investor and shareholder. Our commitment remains unwavering: to build a reputable,
profitable, and purpose-driven company, always prioritizing our mission to protect the environment, businesses, and communities.
As
we embark on this new chapter as a publicly-traded company, we are resolute in our commitment to attract shareholders who resonate with
our vision and are willing to support us in the long run.
Ambipar
Response has 4 businesses units:
| 1. | Emergency
response: specialist in crisis management and response to environmental emergencies,
with command coordinated by a control center, managing services simultaneously, scalable
and standardized. It has 5 HAZMAT training camps, training person according to National Technical
Standards Fire Protection Association (“NFPA”, in the USA), a reference in the
development of technical standards for emergency response. Also comprises Fire Response for
the prevention and combat of forest and industrial fires and Medical Response to emergency
medical care services. |
| 2. | Marine
response: port support solutions, such as transporting people, material and ranch, dredging
support, preventive fencing and emergency bases. It also offers solutions for maritime support,
such as transporting materials to platforms, combating oil spills, chase-boats for
seismic vessels, and vessels for FPSO support (Floating production storage and offloading). |
| 3. | Industrial
response: meets demands for cleaning, maintenance, decontamination and treatment, painting
of industrial and naval tanks, which typically involve a hazardous environment or material.
It also performs decommissioning of FPSOs, vessels, platforms and industrial plants. It can
perform these services for radioactive materials as well. |
| 4. | Environmental
response: rehabilitation of fauna and flora, licensing, auditing and environmental due
diligence, soil remediation, risk study, preparation and execution of environmental monitoring
programs. Team formed by biologists, oceanographers, geologists, geographers and engineers. |
For
more details, watch the institutional video.
HIGHLIGHTS
| BRL million | |
| 2Q23 | | |
| 2Q22 | | |
| Chg. | | |
| 1Q23* | | |
| Chg. | | |
| 6M23* | | |
| 6M22 | | |
| Chg. | |
| GROSS REVENUE | |
| 660.4 | | |
| 363.3 | | |
| 81.8 | % | |
| 627.1 | | |
| 5.3 | % | |
| 1,287.5 | | |
| 713.7 | | |
| 80.4 | % |
| DEDUCTIONS | |
| -48.3 | | |
| -30.7 | | |
| 57.3 | % | |
| -30.9 | | |
| 56.3 | % | |
| -79.2 | | |
| -59.2 | | |
| 33.8 | % |
| NET REVENUE | |
| 612.1 | | |
| 332.6 | | |
| 84.0 | % | |
| 596.3 | | |
| 2.7 | % | |
| 1,208.3 | | |
| 654.5 | | |
| 84.6 | % |
| GROSS PROFIT | |
| 157.9 | | |
| 89.1 | | |
| 77.4 | % | |
| 144.1 | | |
| 9.6 | % | |
| 302.1 | | |
| 182.0 | | |
| 66.0 | % |
| GROSS MARGIN | |
| 25.8 | % | |
| 26.8 | % | |
| -1.0 | p.p. | |
| 24.2 | % | |
| 1.6 | p.p. | |
| 25.0 | % | |
| 27.8 | % | |
| -2.8 | p.p. |
| EBITDA | |
| 150.3 | | |
| 82.6 | | |
| 82.0 | % | |
| 139.1 | | |
| 8.1 | % | |
| 289.4 | | |
| 167.9 | | |
| 72.3 | % |
| EBITDA MARGIN | |
| 24.6 | % | |
| 24.8 | % | |
| -0.3 | p.p. | |
| 23.3 | % | |
| 1.2 | p.p. | |
| 23.9 | % | |
| 25.7 | % | |
| -1.7 | p.p. |
* 1Q23 EBITDA and EBITDA margin adjusted to exclude
extraordinary expenses and non-cash from NYSE American listing.
GROSS REVENUE
| RESPONSE |
COMPOSITION
OF GROSS REVENUE R$
million | |
2Q21 | | |
3Q21 | | |
4Q21 | | |
1Q22 | | |
2Q22 | | |
3Q22 | | |
4Q22 | | |
1Q23 | | |
2Q23 | |
| GROSS REVENUE | |
| 215.2 | | |
| 262.4 | | |
| 281.5 | | |
| 350.4 | | |
| 363.3 | | |
| 431.8 | | |
| 667.8 | | |
| 627.1 | | |
| 660.4 | |
| Brazil | |
| 70.1 | | |
| 82.2 | | |
| 77.1 | | |
| 112.5 | | |
| 122.8 | | |
| 159.4 | | |
| 202.5 | | |
| 208.7 | | |
| 244.5 | |
| International | |
| 145.1 | | |
| 180.2 | | |
| 204.4 | | |
| 237.9 | | |
| 240.6 | | |
| 272.4 | | |
| 465.3 | | |
| 418.4 | | |
| 415.9 | |
| Latam (ex Brazil) | |
| 36.9 | | |
| 47.7 | | |
| 50.1 | | |
| 57.9 | | |
| 58.7 | | |
| 44.1 | | |
| 50.3 | | |
| 55.8 | | |
| 54.3 | |
| Europe | |
| 42.4 | | |
| 50.1 | | |
| 48.1 | | |
| 47.8 | | |
| 50.5 | | |
| 51.8 | | |
| 64.7 | | |
| 56.1 | | |
| 46.0 | |
| North America | |
| 65.8 | | |
| 82.4 | | |
| 106.2 | | |
| 132.2 | | |
| 131.3 | | |
| 176.5 | | |
| 350.3 | | |
| 306.5 | | |
| 315.5 | |
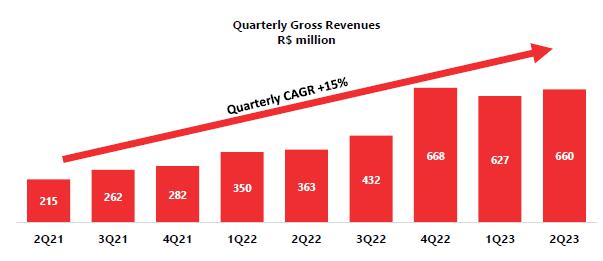
Gross revenue reached R$660 million in 2Q23,
81.8% higher than 2Q22 and up by 5.3% compared to 1Q23.
| Response | |
2Q21 | | |
3Q21 | | |
4Q21 | | |
1Q22 | | |
2Q22 | | |
3Q22 | | |
4Q22 | | |
1Q23 | | |
2Q23 | |
| Organic Growth YoY | |
| 19 | % | |
| 33 | % | |
| 15 | % | |
| 40 | % | |
| 20 | % | |
| 14 | % | |
| 35 | % | |
| 27 | % | |
| 28 | % |
| % companies’ revenue +12
months / total revenue | |
| 51 | % | |
| 50 | % | |
| 57 | % | |
| 59 | % | |
| 66 | % | |
| 67 | % | |
| 54 | % | |
| 72 | % | |
| 70 | % |
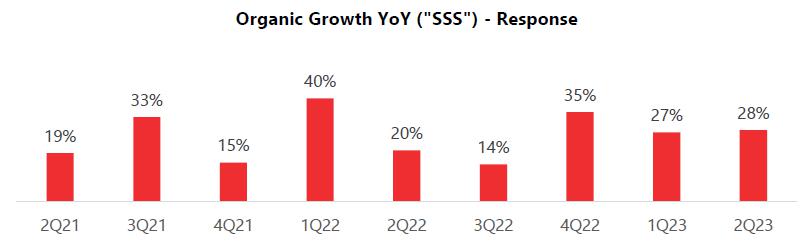
The organic
growth rate, calculated on a "same store sales" ("SSS") basis, that is, the YoY gross revenue variation of companies
and operations that have been for 12 months or more in the Ambipar group compared to the same quarter last year. We have historically
seen high rates of organic growth.
BRAZIL
COMPOSITION OF
GROSS REVENUE
R$ million | |
| 2Q23 | | |
| 2Q22 | | |
| Chg.
2Q23
x2Q22 | | |
| 1Q23 | | |
| Chg.
2Q23
X1Q23 | | |
| 6M23 | | |
| 6M22 | | |
| Chg.
6M23 x
6M22 | |
| RESPONSE | |
| | | |
| | | |
| | | |
| | | |
| | | |
| | | |
| | | |
| | |
| GROSS REVENUES | |
| 660.4 | | |
| 363.3 | | |
| 81.8 | % | |
| 627.1 | | |
| 5.3 | % | |
| 1,287.5 | | |
| 713.7 | | |
| 80.4 | % |
| Brazil | |
| 244.5 | | |
| 122.8 | | |
| 99.1 | % | |
| 208.7 | | |
| 17.1 | % | |
| 453.2 | | |
| 235.3 | | |
| 92.6 | % |
| Subscriptions Brazil | |
| 39.6 | | |
| 33.7 | | |
| 17.3 | % | |
| 38.2 | | |
| 3.6 | % | |
| 77.8 | | |
| 67.5 | | |
| 15.3 | % |
| Services Brazil | |
| 204.9 | | |
| 89.0 | | |
| 130.1 | % | |
| 170.5 | | |
| 20.2 | % | |
| 375.5 | | |
| 167.8 | | |
| 123.7 | % |
| Attended Services | |
| |
2Q22 | | |
3Q22 | | |
4Q22 | | |
1Q23 | | |
2Q23 | | |
Chg.
2Q23
x2Q22 | |
| Brazil | |
Gross
Revenue (BRL Million) | |
89.0 | | |
123.5 | | |
165.5 | | |
170.5 | | |
204.9 | | |
130.1 | % |
| | |
Number
of Services Provided | |
1,853 | | |
2,435 | | |
2,594 | | |
2,727 | | |
3,075 | | |
65.9 | % |
| | |
Average
Ticket (BRL Thousand) | |
48.1 | | |
50.7 | | |
63.8 | | |
62.5 | | |
66.6 | | |
38.7 | % |
| |
· |
Gross Revenue in Brazil grew
in all comparisons, mainly driven by the provision of scheduled industrial services and emergencies in the road and rail sectors. |
| |
· |
The average ticket rose YoY
and QoQ reflecting higher complexity of attended services. |
| |
· |
This result is the result
of integration and cross-selling between the business areas. |
LATAM
COMPOSITION OF
GROSS REVENUE
R$ million | |
| 2Q23 | | |
| 2Q22 | | |
| Chg.
2Q23
x2Q22 | | |
| 1Q23 | | |
| Chg.
2Q23
X1Q23 | | |
| 6M23 | | |
| 6M22 | | |
| Chg.
6M23 x
6M22 | |
| RESPONSE | |
| | | |
| | | |
| | | |
| | | |
| | | |
| | | |
| | | |
| | |
| GROSS REVENUES | |
| 660.4 | | |
| 363.3 | | |
| 81.8 | % | |
| 627.1 | | |
| 5.3 | % | |
| 1,287.5 | | |
| 713.7 | | |
| 80.4 | % |
| International | |
| 415.9 | | |
| 240.6 | | |
| 72.9 | % | |
| 418.4 | | |
| -0.6 | % | |
| 834.3 | | |
| 478.4 | | |
| 74.4 | % |
| Latam (ex-Brazil) | |
| 54.3 | | |
| 58.7 | | |
| -7.5 | % | |
| 55.8 | | |
| -2.6 | % | |
| 110.1 | | |
| 116.6 | | |
| -5.5 | % |
| Subscriptions Latam | |
| 34.6 | | |
| 34.4 | | |
| 0.5 | % | |
| 36.1 | | |
| -4.1 | % | |
| 70.7 | | |
| 65.6 | | |
| 7.7 | % |
| Services Latam | |
| 19.7 | | |
| 24.3 | | |
| -18.7 | % | |
| 19.7 | | |
| 0.1 | % | |
| 39.5 | | |
| 51.0 | | |
| -22.6 | % |
| Attended Services | |
| |
2Q22 | | |
3Q22 | | |
4Q22 | | |
1Q23 | | |
2Q23 | | |
Chg.
2Q23
x2Q22 | |
| Latam
(Ex Brazil) | |
Gross
Revenue (BRL Million) | |
24.3 | | |
9.6 | | |
14.8 | | |
19.7 | | |
19.7 | | |
-18.7 | % |
| | |
Number
of Services Served | |
82 | | |
80 | | |
104 | | |
95 | | |
90 | | |
9.8 | % |
| | |
Average
Ticket (BRL Thousand) | |
296.4 | | |
119.6 | | |
142.3 | | |
207.6 | | |
219.4 | | |
-26.0 | % |
| |
· |
Latam gross revenue had a
negative exchange rate impact between 1Q23 vs. 2Q23, due to the 3.4% appreciation of the Real against the Chilean Peso. On a Local
currency view, Revenues showed slight growth. |
| · | In
Latin America, we had a YoY retraction due to exchange variation, and an oil spill response
in the region during 1H22. |
EUROPE
COMPOSITION OF
GROSS REVENUE
R$ million | |
| 2Q23 | | |
| 2Q22 | | |
| Chg.
2Q23
x2Q22 | | |
| 1Q23 | | |
| Chg.
2Q23
X1Q23 | | |
| 6M23 | | |
| 6M22 | | |
| Chg.
6M23 x
6M22 | |
| RESPONSE | |
| | | |
| | | |
| | | |
| | | |
| | | |
| | | |
| | | |
| | |
| GROSS REVENUES | |
| 660.4 | | |
| 363.3 | | |
| 81.8 | % | |
| 627.1 | | |
| 5.3 | % | |
| 1,287.5 | | |
| 713.7 | | |
| 80.4 | % |
| International | |
| 415.9 | | |
| 240.6 | | |
| 72.9 | % | |
| 418.4 | | |
| -0.6 | % | |
| 834.3 | | |
| 478.4 | | |
| 74.4 | % |
| Europe | |
| 46.0 | | |
| 50.5 | | |
| -8.9 | % | |
| 56.1 | | |
| -17.9 | % | |
| 102.1 | | |
| 98.3 | | |
| 3.9 | % |
| Subscriptions Europe | |
| 4.6 | | |
| 3.8 | | |
| 20.5 | % | |
| 4.8 | | |
| -4.9 | % | |
| 9.4 | | |
| 7.4 | | |
| 27.1 | % |
| Services Europe | |
| 41.5 | | |
| 46.7 | | |
| -11.3 | % | |
| 51.3 | | |
| -19.1 | % | |
| 92.7 | | |
| 90.9 | | |
| 2.0 | % |
| Attended Services | |
| |
2Q22 | | |
3Q22 | | |
4Q22 | | |
1Q23 | | |
2Q23 | | |
Chg.
2Q23
x2Q22 | |
| Europe | |
Gross
Revenue (BRL Million) | |
46.7 | | |
48.1 | | |
60.0 | | |
51.3 | | |
41.5 | | |
-11.3 | % |
| | |
Number
of Services Served | |
5,874 | | |
5,922 | | |
5,974 | | |
5,947 | | |
5,798 | | |
-1.3 | % |
| | |
Average
Ticket (BRL Thousand) | |
8.0 | | |
8.1 | | |
10.0 | | |
8.6 | | |
7.2 | | |
-10.1 | % |
| · | In
Europe, we had a quarterly drop in revenue, due to a lower industrial demand. |
| |
· |
In addition, the Real appreciated
against the basket of currencies in the European countries where we operate. |
NORTH AMERICA
COMPOSITION OF
GROSS REVENUE
R$ million | |
|
2Q23 | |
|
| 2Q22 | | |
| Chg.
2Q23
x2Q22 | | |
| 1Q23 | | |
| Chg.
2Q23
X1Q23 | | |
| 6M23 | | |
|
6M22 | |
|
|
Chg.
6M23 x
6M22 |
|
| RESPONSE | |
|
| |
|
| | | |
| | | |
| | | |
| | | |
| | |
|
|
|
|
|
|
|
|
| GROSS REVENUES | |
|
660.4 | |
|
| 363.3 | | |
| 81.8 | % | |
| 627.1 | | |
| 5.3 | % | |
| 1,287.5 | | |
|
713.7 | |
|
|
80.4 |
% |
| International | |
|
415.9 | |
|
| 240.6 | | |
| 72.9 | % | |
| 418.4 | | |
| -0.6 | % | |
| 834.3 | | |
|
478.4 | |
|
|
74.4 |
% |
| North America | |
|
315.5 | |
|
| 131.3 | | |
| 140.2 | % | |
| 306.5 | | |
| 2.9 | % | |
| 622.0 | | |
|
263.5 | |
|
|
136.0 |
% |
| Attended Services | |
| |
2Q22 | | |
3Q22 | | |
4Q22 | | |
1Q23 | | |
2Q23 | | |
Chg.
2Q23
x2Q22 |
|
| North
America | |
Gross
Revenue (BRL Million) | |
131.3 | | |
176.5 | | |
350.3 | | |
306.5 | | |
315.5 | | |
140.2 |
% |
| | |
Number
of Services Served | |
2,597 | | |
2,991 | | |
3,117 | | |
3,228 | | |
3,660 | | |
40.9 |
% |
| | |
Average
Ticket (BRL Thousand) | |
50.6 | | |
59.0 | | |
112.4 | | |
95.0 | | |
86.2 | | |
70.5 |
% |
| |
· |
North America operations continue
their growth trajectory. In the comparison with 2Q22, the growth was 140.2%. |
| |
· |
Continuing the process of
integrating operations in North America, Witt O’Brien’s now brings together all the L1 and L2 US operations. So, we consolidate
WOB into the North America revenue line. We continue to cross-sell L3 from leads generated by L1. |
| |
· |
Canada stood out with a strong
performance on emergency response and industrial services, following good demand and positioning to serve the Oil and Gas market
on its western provinces. |
NET REVENUE
| R$ million | |
2Q23 | | |
2Q22 | | |
Chg. | |
| |
1Q23 | | |
Chg. | |
|
|
6M23 | | |
6M22 | | |
Chg. | |
| Gross Revenues | |
| 660.4 | | |
| 363.3 | | |
| 81.8 | % |
| |
627.1 | | |
| 5.3 | % |
|
| 1,287.5 | | |
| 713.7 | | |
| 80.4 | % |
| Deductions | |
| -48.3 | | |
| -30.7 | | |
| 57.3 | % |
| |
-30.9 | | |
| 56.3 | % |
|
| -79.2 | | |
| -59.2 | | |
| 33.8 | % |
| Net Revenues | |
| 612.1 | | |
| 332.6 | | |
| 84.0 | % |
| |
596.3 | | |
| 2.7 | % |
|
| 1,208.3 | | |
| 654.5 | | |
| 84.6 | % |
| % Deductions
/ Gross Revenues | |
| -7.3 | % | |
| -8.5 | % | |
| 1.1 | p.p. |
| |
-4.9 | % | |
| -2.4 | p.p. |
|
| -6.1 | % | |
| -8.3 | % | |
| 2.1 | p.p. |
| |
· |
The variation in net revenue
accompanied the evolution of gross revenue by geography, and the revenue deductions for each region. There was no significant change
in the tax structure of each market, with higher deductions in the Brazilian market than in the international market. |
COST OF PRODUCTS/SERVICES (CASH)
| RESPONSE |
| COST OF SERVICES R$ million | |
2Q23 | | |
2Q22 | | |
Chg. | | |
|
1Q23 | | |
Chg. | | |
|
6M23 | | |
6M22 | | |
Chg. | |
| Personnel | |
| 253.4 | | |
| 120.2 | | |
| 110.9 | % | |
|
| 237.6 | | |
| 6.6 | % | |
|
| 491.0 | | |
| 238.2 | | |
| 106.2 | % |
| Third parties | |
| 92.2 | | |
| 49.5 | | |
| 86.1 | % | |
|
| 88.8 | | |
| 3.8 | % | |
|
| 181.0 | | |
| 96.4 | | |
| 87.8 | % |
| Maintenance | |
| 24.7 | | |
| 8.1 | | |
| 207.1 | % | |
|
| 19.8 | | |
| 24.6 | % | |
|
| 44.6 | | |
| 14.7 | | |
| 203.2 | % |
| Travel | |
| 19.2 | | |
| 4.6 | | |
| 313.3 | % | |
|
| 17.2 | | |
| 11.7 | % | |
|
| 36.4 | | |
| 9.2 | | |
| 293.6 | % |
| Freight | |
| 0.8 | | |
| 1.2 | | |
| -32.1 | % | |
|
| 1.5 | | |
| -45.6 | % | |
|
| 2.2 | | |
| 2.3 | | |
| -2.6 | % |
| Rentals | |
| 11.7 | | |
| 9.5 | | |
| 23.2 | % | |
|
| 10.7 | | |
| 9.4 | % | |
|
| 22.4 | | |
| 19.1 | | |
| 17.2 | % |
| Fuel | |
| 12.8 | | |
| 18.7 | | |
| -31.7 | % | |
|
| 12.6 | | |
| 1.6 | % | |
|
| 25.3 | | |
| 30.9 | | |
| -17.9 | % |
| Materials | |
| 5.2 | | |
| 3.5 | | |
| 46.3 | % | |
|
| 7.9 | | |
| -35.1 | % | |
|
| 13.1 | | |
| 6.8 | | |
| 93.2 | % |
| Telecommunications | |
| 2.9 | | |
| 0.6 | | |
| 406.5 | % | |
|
| 3.7 | | |
| -22.7 | % | |
|
| 6.6 | | |
| 1.2 | | |
| 439.0 | % |
| Marketing | |
| 5.3 | | |
| 0.7 | | |
| 656.4 | % | |
|
| 3.1 | | |
| 71.5 | % | |
|
| 8.4 | | |
| 1.2 | | |
| 583.0 | % |
| Taxes | |
| 4.2 | | |
| 6.2 | | |
| -32.3 | % | |
|
| 10.8 | | |
| -61.1 | % | |
|
| 15.1 | | |
| 15.6 | | |
| -3.3 | % |
| Others | |
| 21.9 | | |
| 20.8 | | |
| 5.3 | % | |
|
| 38.4 | | |
| -43.0 | % | |
|
| 60.2 | | |
| 37.0 | | |
| 62.6 | % |
| TOTAL | |
| 454.1 | | |
| 243.6 | | |
| 86.5 | % | |
|
| 452.1 | | |
| 0.4 | % | |
|
| 906.3 | | |
| 472.6 | | |
| 91.8 | % |
RESPONSE
| COST OF SERVICES R$ million | |
| 2Q21 | | |
| 3Q21 | | |
| 4Q21 | | |
| 1Q22 | | |
| 2Q22 | | |
| 3Q22 | | |
| 4Q22 | | |
| 1Q23 | | |
| 2Q23 | |
| Net Revenue | |
| 190.3 | | |
| 233.4 | | |
| 255.6 | | |
| 321.9 | | |
| 332.6 | | |
| 398.1 | | |
| 632.3 | | |
| 596.3 | | |
| 612.1 | |
| Personnel | |
| 73.0 | | |
| 91.3 | | |
| 96.4 | | |
| 118.0 | | |
| 120.2 | | |
| 137.7 | | |
| 271.5 | | |
| 237.6 | | |
| 253.4 | |
| Third parties | |
| 19.8 | | |
| 28.8 | | |
| 27.7 | | |
| 46.8 | | |
| 49.5 | | |
| 45.1 | | |
| 69.0 | | |
| 88.8 | | |
| 92.2 | |
| Maintenance | |
| 8.6 | | |
| 4.5 | | |
| 6.2 | | |
| 6.6 | | |
| 8.1 | | |
| 15.5 | | |
| 27.8 | | |
| 19.8 | | |
| 24.7 | |
| Travel | |
| 2.4 | | |
| 3.8 | | |
| 4.3 | | |
| 4.6 | | |
| 4.6 | | |
| 6.7 | | |
| 17.2 | | |
| 17.2 | | |
| 19.2 | |
| Freight | |
| 0.6 | | |
| 0.8 | | |
| 0.9 | | |
| 1.1 | | |
| 1.2 | | |
| 1.3 | | |
| 13.4 | | |
| 1.5 | | |
| 0.8 | |
| Rentals | |
| 7.3 | | |
| 7.2 | | |
| 7.1 | | |
| 9.6 | | |
| 9.5 | | |
| 3.3 | | |
| 8.6 | | |
| 10.7 | | |
| 11.7 | |
| Fuel | |
| 5.4 | | |
| 6.6 | | |
| 9.0 | | |
| 12.2 | | |
| 18.7 | | |
| 19.8 | | |
| 7.5 | | |
| 12.6 | | |
| 12.8 | |
| Materials | |
| 2.3 | | |
| 3.2 | | |
| 3.5 | | |
| 3.3 | | |
| 3.5 | | |
| 10.4 | | |
| 5.2 | | |
| 7.9 | | |
| 5.2 | |
| Telecommunications | |
| 0.4 | | |
| 0.5 | | |
| 0.7 | | |
| 0.7 | | |
| 0.6 | | |
| 1.0 | | |
| 4.2 | | |
| 3.7 | | |
| 2.9 | |
| Marketing | |
| 0.9 | | |
| 0.3 | | |
| 1.5 | | |
| 0.5 | | |
| 0.7 | | |
| 5.5 | | |
| 4.1 | | |
| 3.1 | | |
| 5.3 | |
| Taxes | |
| 2.1 | | |
| 3.6 | | |
| 3.7 | | |
| 9.3 | | |
| 6.2 | | |
| 5.9 | | |
| -1.3 | | |
| 10.8 | | |
| 4.2 | |
| Others | |
| 9.2 | | |
| 9.0 | | |
| 14.4 | | |
| 16.3 | | |
| 20.8 | | |
| 30.5 | | |
| 27.0 | | |
| 38.4 | | |
| 21.9 | |
| Total | |
| 132.1 | | |
| 159.4 | | |
| 175.3 | | |
| 229.0 | | |
| 243.6 | | |
| 282.8 | | |
| 454.2 | | |
| 452.1 | | |
| 454.1 | |
| | |
| | | |
| | | |
| | | |
| | | |
| | | |
| | | |
| | | |
| | | |
| | |
Percentage
of Net Revenue
RESPONSE | |
| COST OF SERVICES R$ million | |
| 2Q21 | | |
| 3Q21 | | |
| 4Q21 | | |
| 1Q22 | | |
| 2Q22 | | |
| 3Q22 | | |
| 4Q22 | | |
| 1Q23 | | |
| 2Q23 | |
| Net Revenue | |
| 190.3 | | |
| 233.4 | | |
| 255.6 | | |
| 321.9 | | |
| 332.6 | | |
| 398.1 | | |
| 632.3 | | |
| 596.3 | | |
| 612.1 | |
| Personnel | |
| 38.3 | % | |
| 39.1 | % | |
| 37.7 | % | |
| 36.7 | % | |
| 36.1 | % | |
| 34.6 | % | |
| 42.9 | % | |
| 39.9 | % | |
| 41.4 | % |
| Third parties | |
| 10.4 | % | |
| 12.4 | % | |
| 10.9 | % | |
| 14.5 | % | |
| 14.9 | % | |
| 11.3 | % | |
| 10.9 | % | |
| 14.9 | % | |
| 15.1 | % |
| Maintenance | |
| 4.5 | % | |
| 1.9 | % | |
| 2.4 | % | |
| 2.1 | % | |
| 2.4 | % | |
| 3.9 | % | |
| 4.4 | % | |
| 3.3 | % | |
| 4.0 | % |
| Travel | |
| 1.3 | % | |
| 1.6 | % | |
| 1.7 | % | |
| 1.4 | % | |
| 1.4 | % | |
| 1.7 | % | |
| 2.7 | % | |
| 2.9 | % | |
| 3.1 | % |
| Freight | |
| 0.3 | % | |
| 0.3 | % | |
| 0.3 | % | |
| 0.4 | % | |
| 0.3 | % | |
| 0.3 | % | |
| 2.1 | % | |
| 0.2 | % | |
| 0.1 | % |
| Rentals | |
| 3.9 | % | |
| 3.1 | % | |
| 2.8 | % | |
| 3.0 | % | |
| 2.9 | % | |
| 0.8 | % | |
| 1.4 | % | |
| 1.8 | % | |
| 1.9 | % |
| Fuel | |
| 2.8 | % | |
| 2.8 | % | |
| 3.5 | % | |
| 3.8 | % | |
| 5.6 | % | |
| 5.0 | % | |
| 1.2 | % | |
| 2.1 | % | |
| 2.1 | % |
| Materials | |
| 1.2 | % | |
| 1.3 | % | |
| 1.4 | % | |
| 1.0 | % | |
| 1.1 | % | |
| 2.6 | % | |
| 0.8 | % | |
| 1.3 | % | |
| 0.8 | % |
| Telecommunications | |
| 0.2 | % | |
| 0.2 | % | |
| 0.3 | % | |
| 0.2 | % | |
| 0.2 | % | |
| 0.3 | % | |
| 0.7 | % | |
| 0.6 | % | |
| 0.5 | % |
| Marketing | |
| 0.5 | % | |
| 0.1 | % | |
| 0.6 | % | |
| 0.2 | % | |
| 0.2 | % | |
| 1.4 | % | |
| 0.6 | % | |
| 0.5 | % | |
| 0.9 | % |
| Taxes | |
| 1.1 | % | |
| 1.5 | % | |
| 1.4 | % | |
| 2.9 | % | |
| 1.9 | % | |
| 1.5 | % | |
| -0.2 | % | |
| 1.8 | % | |
| 0.7 | % |
| Others | |
| 4.8 | % | |
| 3.9 | % | |
| 5.6 | % | |
| 5.1 | % | |
| 6.2 | % | |
| 7.7 | % | |
| 4.3 | % | |
| 6.4 | % | |
| 3.6 | % |
| Total | |
| 69.4 | % | |
| 68.3 | % | |
| 68.6 | % | |
| 71.1 | % | |
| 73.2 | % | |
| 71.0 | % | |
| 71.8 | % | |
| 75.8 | % | |
| 74.2 | % |
| Gross Margin | |
| 30.6 | % | |
| 31.7 | % | |
| 31.4 | % | |
| 28.9 | % | |
| 26.8 | % | |
| 29.0 | % | |
| 28.2 | % | |
| 24.2 | % | |
| 25.8 | % |
Costs
remained stable as a percentage of revenue when comparing 2Q23 vs. 1Q23, reflecting the company's business mix. There were no highlights
in the composition of costs in this quarter. The largest cost components – Personnel, Third Parties, Maintenance, Fuel and Travel
– represented more than 85% of total costs.
GROSS
PROFIT
Quarterly
Gross Profit(R$ million) and Margin (%)

Gross
profit grew over 2Q22. Gross margin for 2Q23 reached 25.8%, a result of 1.0 pp. lower than 2Q22 and up by 1.6 pp. compared to 1Q23. The
improvement in gross margin in relation to 1Q23, is due to better performance in Brazil and Canada.
EBITDA
Quarterly EBITDA (R$
million) and Margin (%)
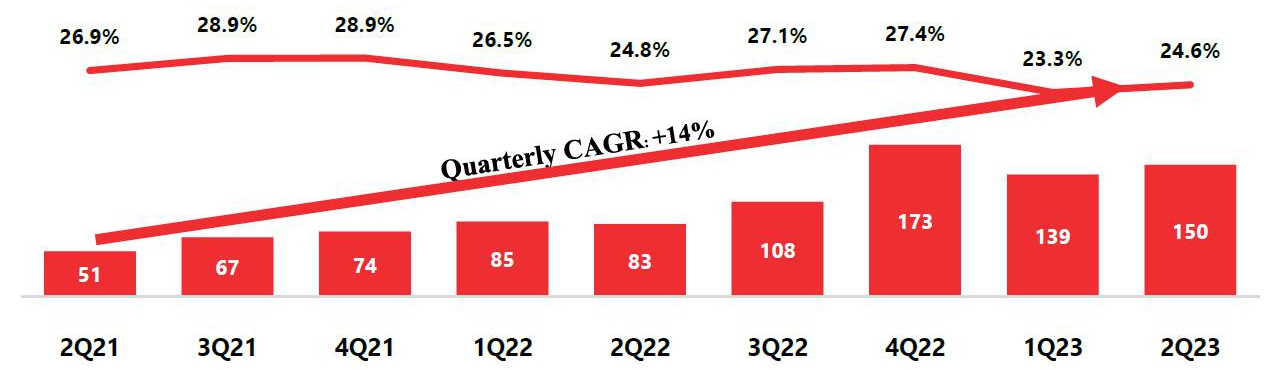
*
1Q23 EBITDA and EBITDA margin adjusted to exclude extraordinary expenses and non-cash from NYSE American listing
EBITDA
registered an 82.0% growth in the 2Q23 versus 2Q22. The EBITDA margin in 1Q23 and 2Q23 reflects a mix with more consulting services,
structurally with lower margin.
FINANCIAL
RESULTS
| R$ million | |
| 2Q23 | | |
| 2Q22 | | |
| Var. | | |
| 1Q23 | | |
| Var. | | |
| 6M23 | | |
| 6M22 | | |
| Var. | |
| Financial Results | |
| -50.9 | | |
| -16.6 | | |
| 207.0 | % | |
| -29.7 | | |
| 71.5 | % | |
| -80.6 | | |
| -23.3 | | |
| 245.7 | % |
| Financial Expenses | |
| -48.9 | | |
| -18.9 | | |
| 158.2 | % | |
| -48.2 | | |
| 1.3 | % | |
| -97.1 | | |
| -28.9 | | |
| 235.5 | % |
| Financial Income | |
| -2.0 | | |
| 2.3 | | |
| N.M. | | |
| 18.5 | | |
| N.M | | |
| 16.5 | | |
| 5.6 | | |
| 193.2 | % |
In
2Q23, Ambipar Response presented a negative net financial result of R$51 million, resulting from the increase in interest rates and the
increase in debt. The debt increase was mainly for capex and M&A.
NET
INCOME
| R$ million | |
| 2Q23 | | |
| 2Q22 | | |
| Var. | | |
| 1Q23 | | |
| Var. | | |
| 6M23 | | |
| 6M22 | | |
| Var. | |
| Net Income | |
| 47.1 | | |
| 34.9 | | |
| 35.0 | % | |
| -67.6 | | |
| N.M. | | |
| -20.5 | | |
| 82.4 | | |
| N.M. | |
| Net Margin | |
| 7.7 | % | |
| 10.5 | % | |
| -2.8 | p.p. | |
| -11.3 | % | |
| 19.0 | p.p. | |
| -1.7 | % | |
| 12.6 | % | |
| -14.3 | p.p. |
Ambipar
Response registered net income of R$47.1 million in 2Q23, with a net margin of 7.7%.
Compared
to the same quarter of the previous year, net income grew by 35%, with a reduction of 2.8 p.p. in net margin. Profit growth derives from
the growth in operations, while the drop in margin is explained by the negative financial result and the contribution of business segments
and regions to the consolidated result.
The
portion of net income allocated to non-controlling shareholders grew in 2Q23, as we made several acquisitions of companies throughout
the year of 2022 where founding partners remain in the business as minority shareholders. This way of carrying out acquisitions ensures
that we maintain expertise and continuity in the acquired companies, and it is a form of long-term alignment.
CAPITAL
STRUCTURE
On
June 30, 2023, financial gross debt reached the amount of R$ 1,256.4 million, a reduction of R$ 61.7 million in relation to the balance
determined on December 31, 2022, mainly due to the issue of debentures and funding of loans and financing. Considering Related Parties,
the total amount of gross debt was R$ 1,863.3 million a reduction of R$ 224.7 million.
| R$ Million | |
| 2Q23 | | |
| 4Q22 | |
| Short Term | |
| 201.2 | | |
| 151.8 | |
| Loans and financing | |
| 62.1 | | |
| 67.7 | |
| Debentures | |
| 139.1 | | |
| 84.2 | |
| | |
| | | |
| | |
| Long Term | |
| 1,055.2 | | |
| 1,166.3 | |
| Loans and financing | |
| 592.9 | | |
| 649.8 | |
| Debentures | |
| 462.3 | | |
| 516.5 | |
| | |
| | | |
| | |
| Short Term | |
| 16 | % | |
| 12 | % |
| Long Term | |
| 84 | % | |
| 88 | % |
| | |
| | | |
| | |
| Financial Gross
Debt | |
| 1,256.4 | | |
| 1,318.1 | |
| Related
Parties | |
| 606.8 | | |
| 769.8 | |
| Total Gross Debt | |
| 1,863.3 | | |
| 2,087.9 | |
| Financial
Gross Debt R$ Million | |
Financial
charges - % p.a. | |
Maturity | |
2Q23 | |
4Q22 |
|
| Working capital | |
0.84%+CDI and 6.36% | |
March 2027 | |
529.3 | |
597.7 |
|
| Investment financing | |
14.40% | |
June 2027 | |
98.7 | |
108.7 |
|
| Financial leases
liabilities | |
14.26% | |
September 2027 | |
27.0 | |
11.0 |
|
| Debentures | |
CDI + 2.65% and 3.5% | |
February 2028 | |
601.4 | |
600.7 |
|
| Total | |
| |
| |
1,256.4 | |
1,318.1 |
|
Financial
Leverage based on Covenants criteria reduced from 1.51x to 0.94x in the comparison between December 2022 and June 2023, due to the cash
generation related to the Company's IPO occurred in March. Also in June 2023, considering Related Parties loans, the leverage was reduced
from 2.59x to 1.90x.
| R$ Million | |
| 2Q23 | | |
| 4Q22 | |
| Financial Gross Debt | |
| 1,256.4 | | |
| 1,318.1 | |
| (-) Cash and equivalents | |
| 691.8 | | |
| 271.6 | |
| (=) Financial Net Debt based on
Covenants criteria | |
| 564.6 | | |
| 1,046.5 | |
| Pro forma annualized EBITDA¹ | |
| 601.4 | | |
| 691.9 | |
| Financial Leverage (x) | |
| 0.94 | | |
| 1.51 | |
| (=) Net Debt Including Related Parties² | |
| 1,145.5 | | |
| 1,790.1 | |
| Pro forma annualized EBITDA¹ | |
| 601.4 | | |
| 691.9 | |
| Financial Leverage (x) | |
| 1.90 | | |
| 2.59 | |
| 1- | Calculated
as the EBTIDA for 2Q23 multiplied by four. 2- Considers the amount of Related Parties Loans. |
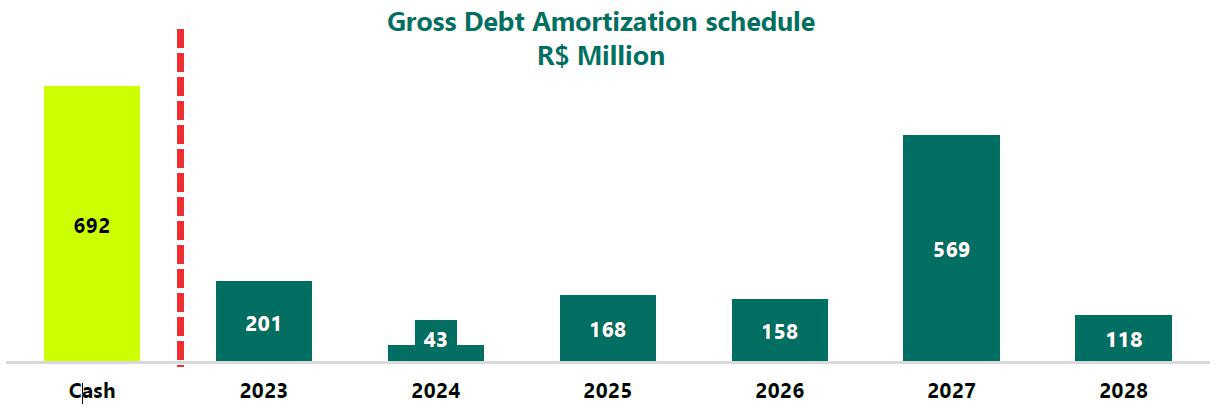
The
debt maturity schedule has its most relevant portion in the year 2027.
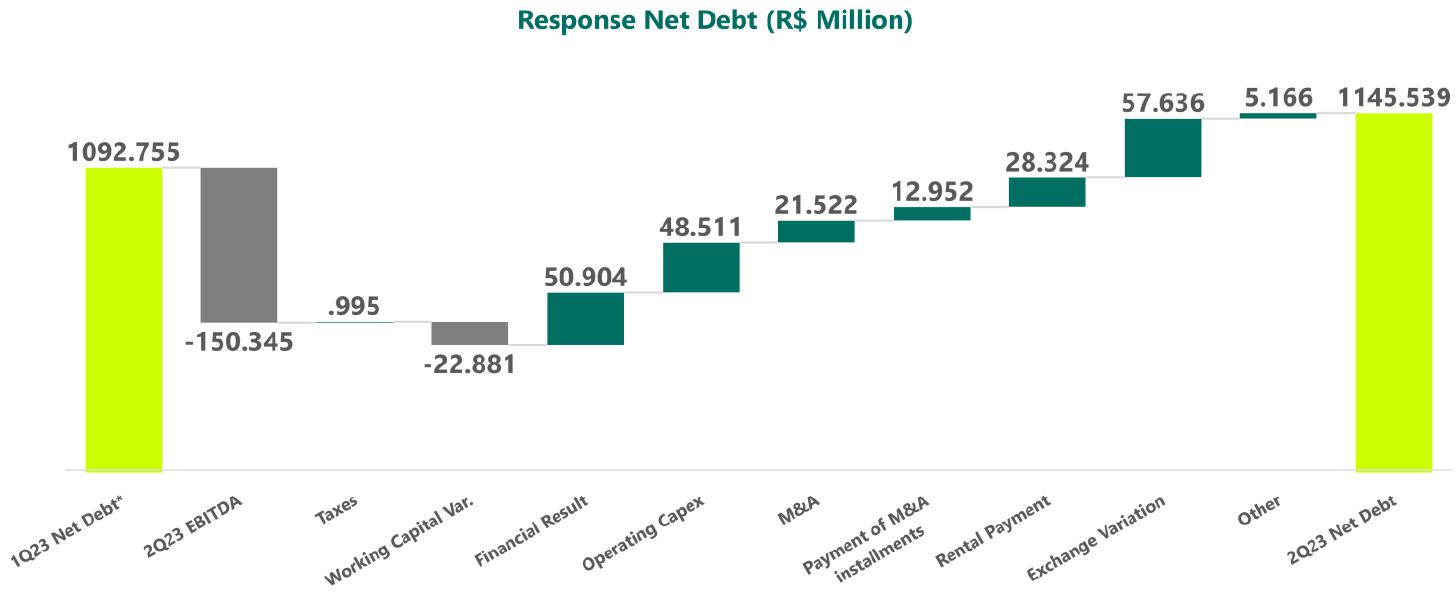
*1Q23
net debt non audited by PCAOB standards. Considers Related Parties’ Loans.
ROIC
| BRL million | |
2Q23
LTM | | |
4Q22
LTM | | |
Chg.
2Q23 LTM x 4Q22
LTM | |
| (+) EBIT | |
| 427.5 | | |
| 336.8 | | |
| 26.9 | % |
| (-) Tax¹ | |
| -128.2 | | |
| -101.0 | | |
| 26.9 | % |
| NOPAT | |
| 299.2 | | |
| 235.7 | | |
| 26.9 | % |
| (+) Average Shareholders' Equity | |
| 730.8 | | |
| 385.1 | | |
| 89.8 | % |
| (+) Average Net Debt | |
| 1,127.5 | | |
| 907.8 | | |
| 24.2 | % |
| Average Invested Capital | |
| 1,858.3 | | |
| 1,292.9 | | |
| 43.7 | % |
| (-) Average Intangible | |
| 1,273.4 | | |
| 907.5 | | |
| 40.3 | % |
| Average Invested
Capital ex Intangible | |
| 584.9 | | |
| 385.4 | | |
| 51.8 | % |
| Operational ROIC²
(%) | |
| 51.2 | % | |
| 61.2 | % | |
| -10.0 | p.p. |
| ROIC (%) | |
| 16.1 | % | |
| 18.2 | % | |
| -2.1 | p.p. |
| 1- Considers
a 30% tax rate; 2- Disregard intangibles |
Return
on Invested Capital minus intangible assets (“operating ROIC”) allows for an approximate estimate of the return on investments
made in operations.
Return
on Invested Capital (“ROIC”), which incorporates intangible assets into the invested capital base, mainly composed of goodwill
paid for acquisitions.
M&A
investment, at first, presents a lower ROIC, due to goodwill paid on acquisition. Once acquisitions become part of our operations, the
expected return on the marginal investment made tends to follow the Operating ROIC, since the invested capital is allocated to the acquiree's
operations and does not include goodwill.
In
the medium term, therefore, we expect convergence between the company's ROIC and the operational ROIC.
CAPEX
In
2Q23, addition of Fixed Assets was R$41.9 million. In Response, we invested in Latin America in the new training camp in Chile and in
the acquisition of equipment to be used in outsourcing contracts.
As
for 6M23, Brazil still demanded capex for helicopters, which are typically demanded to fight fires in the rainforest and transport people
to remote areas, and we continued investing in vehicles for industrial services and emergency response in North America.
Additions to Fixed Assets
R$ million | |
| 2Q23 | | |
| 2Q22 | | |
| Chg.
2Q23 x
2Q22 | | |
| 1Q23 | | |
| Chg.
2Q23 x
1Q23 | | |
| 6M23 | | |
| 6M22 | | |
| Chg.
6M23 x
6M22 | |
| (+) Response | |
| 41.9 | | |
| 26.1 | | |
| 61.0 | % | |
| 69.0 | | |
| -39.2 | % | |
| 110.9 | | |
| 90.9 | | |
| 22.1 | % |
| (+) Brazil | |
| 11.6 | | |
| 8.9 | | |
| 29.4 | % | |
| 43.8 | | |
| -73.6 | % | |
| 55.4 | | |
| 58.8 | | |
| -5.7 | % |
| (+) LATAM (ex-Brazil) | |
| 19.8 | | |
| 1.9 | | |
| 933.4 | % | |
| 1.1 | | |
| 1662.9 | % | |
| 20.9 | | |
| 2.0 | | |
| 967.3 | % |
| (+) Europe | |
| 1.8 | | |
| 0.5 | | |
| 261.6 | % | |
| 1.8 | | |
| -0.5 | % | |
| 3.7 | | |
| 3.7 | | |
| 0.3 | % |
| (+) North America | |
| 8.7 | | |
| 14.7 | | |
| -40.4 | % | |
| 22.2 | | |
| -60.6 | % | |
| 30.9 | | |
| 26.4 | | |
| 16.9 | % |
Additions
to Fixed Assets
R$ million | |
| 2Q21 | | |
| 3Q21 | | |
| 4Q21 | | |
| 1Q22 | | |
| 2Q22 | | |
| 3Q22 | | |
| 4Q22 | | |
| 1Q23 | | |
| 2Q23 | |
| (+) Response | |
| 20.8 | | |
| 46.2 | | |
| 12.9 | | |
| 64.8 | | |
| 26.1 | | |
| 69.9 | | |
| 72.5 | | |
| 69.0 | | |
| 41.9 | |
| (+) Brazil | |
| 16.4 | | |
| 32.5 | | |
| 7.1 | | |
| 49.9 | | |
| 8.9 | | |
| 52.3 | | |
| 37.9 | | |
| 43.8 | | |
| 11.6 | |
| (+) LATAM (ex-Brazil) | |
| 0.7 | | |
| 2.0 | | |
| 2.1 | | |
| 0.0 | | |
| 1.9 | | |
| 0.7 | | |
| 4.0 | | |
| 1.1 | | |
| 19.8 | |
| (+) Europe | |
| 0.1 | | |
| 2.6 | | |
| 2.8 | | |
| 3.2 | | |
| 0.5 | | |
| 2.4 | | |
| 2.1 | | |
| 1.8 | | |
| 1.8 | |
| (+) North America | |
| 3.7 | | |
| 9.2 | | |
| 0.9 | | |
| 11.8 | | |
| 14.7 | | |
| 14.4 | | |
| 28.5 | | |
| 22.2 | | |
| 8.7 | |
| | |
1Q23 | | |
| 2Q23 | |
| Expansion
and Maintenance Capex | |
| Capex (R$
Million) | | |
| %
Group Revenue | | |
| Capex (R$
Million) | | |
| %
Group Revenue | |
| RESPONSE - Service Expansion | |
| 38.0 | | |
| 3.3 | % | |
| 24.3 | | |
| 2.0 | % |
| Response Brazil | |
| 25.6 | | |
| 2.2 | % | |
| 6.3 | | |
| 0.5 | % |
| Response Latam (Ex. Brazil) | |
| 0.6 | | |
| 0.1 | % | |
| 18.0 | | |
| 1.5 | % |
| Response Europe | |
| 0.3 | | |
| 0.0 | % | |
| 0.0 | | |
| 0.0 | % |
| Response North America | |
| 11.5 | | |
| 1.0 | % | |
| 0.0 | | |
| 0.0 | % |
| RESPONSE - Service Maintenance | |
| 31.1 | | |
| 2.7 | % | |
| 17.7 | | |
| 1.5 | % |
| Response Brazil | |
| 18.3 | | |
| 1.6 | % | |
| 5.3 | | |
| 0.4 | % |
| Response Latam (Ex. Brazil) | |
| 0.5 | | |
| 0.0 | % | |
| 1.8 | | |
| 0.2 | % |
| Response Europe | |
| 1.6 | | |
| 0.1 | % | |
| 1.8 | | |
| 0.2 | % |
| Response North America | |
| 10.7 | | |
| 0.9 | % | |
| 8.7 | | |
| 0.7 | % |
ANNEXES
| · | Reconciliation
of Non-GAAP Measures |
BALANCE
SHEET
ASSETS
BRL thousand | |
06/30/2023 | | |
12/31/2022 | |
| Cash and cash equivalents | |
| 691,829 | | |
| 271,607 | |
| Trade and other receivables | |
| 718,742 | | |
| 711,892 | |
Current income tax and social
contribution recoverable | |
| 6,935 | | |
| 6,388 | |
| Other taxes recoverable | |
| 37,474 | | |
| 29,740 | |
| Prepaid expenses | |
| 35,221 | | |
| 37,806 | |
| Advances to suppliers | |
| 58,336 | | |
| 29,864 | |
| Inventories | |
| 26,160 | | |
| 18,128 | |
| Dividends Receivable | |
| - | | |
| - | |
| Other accounts equivalents | |
| 50,518 | | |
| 36,498 | |
| Total current assets | |
| 1,625,215 | | |
| 1,141,923 | |
| Related parties loans | |
| 25,886 | | |
| 26,180 | |
| Non-current income tax and social contribuition recoverable | |
| 2,854 | | |
| 2,854 | |
| Non-current other taxes recoverable | |
| 395 | | |
| 392 | |
| Deferred taxes | |
| 25,567 | | |
| 25,420 | |
| Judicial deposits | |
| 6,056 | | |
| 826 | |
| Other accounts receivable | |
| 26,727 | | |
| 37,599 | |
| Investments | |
| - | | |
| 7,620 | |
| Property, plant and equipment | |
| 611,396 | | |
| 516,081 | |
| Right of use | |
| 48,479 | | |
| 68,275 | |
| Goodwill | |
| 1,188,856 | | |
| 1,192,302 | |
| Intangible assets | |
| 369,278 | | |
| 420,197 | |
| Total Non-current assets | |
| 2,305,494 | | |
| 2,297,746 | |
| Total assets | |
| 3,930,709 | | |
| 3,439,669 | |
BALANCE
SHEET (continued)
LIABILITIES AND SHAREHOLDERS EQUITY
BRL thousand | |
06/30/2023 | | |
12/31/2022 | |
| Loans and financing | |
| 62,122 | | |
| 67,656 | |
| Debentures | |
| 139,082 | | |
| 84,187 | |
| Trade and other payables | |
| 129,218 | | |
| 155,523 | |
| Labor obligations | |
| 84,500 | | |
| 114,941 | |
| Dividends Payable | |
| 43,189 | | |
| 76,909 | |
| Current income tax and social contribution payable | |
| 17,395 | | |
| 12,998 | |
| Other tax payable | |
| 23,206 | | |
| 33,719 | |
| Obligations from acquisition of investment | |
| 160,473 | | |
| 141,698 | |
| Lease liabilities | |
| 16,157 | | |
| 14,411 | |
| Other bills to pay | |
| 76,848 | | |
| 36,345 | |
| Total current liabilities | |
| 752,190 | | |
| 738,387 | |
| | |
| | | |
| | |
| Loans and financing | |
| 592,906 | | |
| 649,762 | |
| Debentures | |
| 462,321 | | |
| 516,533 | |
| Other taxes payable | |
| 7,669 | | |
| 7,986 | |
| Related parties loans | |
| 606,823 | | |
| 769,792 | |
| Provision for loss on investments | |
| - | | |
| - | |
| Deferred income tax and social contribution | |
| 211,513 | | |
| 190,833 | |
| Obligations from acquisition of investment | |
| 37,130 | | |
| 81,728 | |
| Provision for contingencies | |
| 382 | | |
| 607 | |
| Lease liabilities | |
| 29,492 | | |
| 32,648 | |
| Warrant and Earn-out | |
| 41,336 | | |
| - | |
| Other bills to pay | |
| 9,223 | | |
| 4,305 | |
| Total Non-current liabilities | |
| 1,998,795 | | |
| 2,254,194 | |
| | |
| | | |
| | |
| Capital | |
| 1,434,717 | | |
| 261,920 | |
| Earn-out variation | |
| (2,349 | ) | |
| - | |
| Share issue expenses | |
| - | | |
| - | |
| Profit reserves | |
| - | | |
| 302,817 | |
| Capital transactions | |
| (91,432 | ) | |
| (110,218 | ) |
| Accumulated translation adjustment | |
| (225,745 | ) | |
| (89,165 | ) |
| Adjust previous exercises | |
| - | | |
| - | |
| Retained earnings | |
| (64,325 | ) | |
| - | |
| Equity attributable to owners of the group | |
| 1,050,866 | | |
| 365,354 | |
| Non-controlling interest | |
| 128,858 | | |
| 81,734 | |
| Total Equity | |
| 1,179,724 | | |
| 447,088 | |
| | |
| | | |
| | |
| Total shareholders' equity and liabilities | |
| 3,930,709 | | |
| 3,439,669 | |
INCOME
STATEMENT
| R$
million | |
| 2Q23 | | |
| 2Q22 | | |
| Chg | | |
| 1Q23* | | |
| Chg. | | |
| 6M23* | | |
| 6M22 | | |
| Chg. | |
| Gross revenues | |
| 660.4 | | |
| 363.3 | | |
| 81.8 | % | |
| 627.1 | | |
| 5.3 | % | |
| 1,287.5 | | |
| 713.7 | | |
| 80.4 | % |
| Deductions | |
| -48.3 | | |
| -30.7 | | |
| 57.1 | % | |
| -30.9 | | |
| 56.3 | % | |
| -79.2 | | |
| -59.2 | | |
| 33.8 | % |
| Net Revenues | |
| 612.1 | | |
| 332.6 | | |
| 84.0 | % | |
| 596.3 | | |
| 2.7 | % | |
| 1,208.3 | | |
| 654.5 | | |
| 84.6 | % |
| Cost
of Services provided | |
| -454.1 | | |
| -243.6 | | |
| 86.5 | % | |
| -452.1 | | |
| 0.4 | % | |
| -906.3 | | |
| -472.6 | | |
| 91.8 | % |
| SG&A | |
| -7.6 | | |
| -6.5 | | |
| 17.5 | % | |
| -5.1 | | |
| 49.4 | % | |
| -12.7 | | |
| -14.0 | | |
| -9.7 | % |
| EBITDA | |
| 150.3 | | |
| 82.6 | | |
| 82.0 | % | |
| 139.1 | | |
| 8.1 | % | |
| 289.4 | | |
| 167.9 | | |
| 72.4 | % |
| EBITDA
Margin (%) | |
| 24.6 | % | |
| 24.8 | % | |
| -0.3 | p.p. | |
| 23.3 | % | |
| 1.2 | p.p. | |
| 23.9 | % | |
| 25.7 | % | |
| -1.7 | p.p. |
| Financial Results | |
| -50.9 | | |
| -16.6 | | |
| 207.0 | % | |
| -29.7 | | |
| 71.5 | % | |
| -80.6 | | |
| -23.3 | | |
| 245.7 | % |
| Financial Expenses | |
| -48.9 | | |
| -18.9 | | |
| 158.2 | % | |
| -48.2 | | |
| 1.3 | % | |
| -97.1 | | |
| -28.9 | | |
| 235.5 | % |
| Financial Income | |
| -2.0 | | |
| 2.3 | | |
| N.M | | |
| 18.5 | | |
| N.M | | |
| 16.5 | | |
| 5.6 | | |
| 193.2 | % |
| Taxes | |
| -15.1 | | |
| -6.6 | | |
| 126.5 | % | |
| -20.2 | | |
| -25.5 | % | |
| -35.3 | | |
| -19.9 | | |
| 77.2 | % |
| Current Taxes | |
| -16.0 | | |
| -7.6 | | |
| 109.3 | % | |
| -13.6 | | |
| 17.6 | % | |
| -29.6 | | |
| -14.7 | | |
| 101.4 | % |
| Deferred Taxes | |
| 0.9 | | |
| 1.0 | | |
| -6.1 | % | |
| -6.6 | | |
| N.M | | |
| -5.7 | | |
| -5.2 | | |
| 9.1 | % |
| Net Income | |
| 47.1 | | |
| 34.9 | | |
| 35.0 | % | |
| -67.6 | | |
| N.M | | |
| -20.5 | | |
| 82.4 | | |
| N.M. | |
*1Q23
EBITDA and margin excludes extraordinary expenses and non-cash from NYSE American listing.
CASH
FLOW
| BRL thousand | |
| 2Q23 | | |
| 2Q22 | | |
| 6M23 | | |
| 6M22 | |
| Net income for the period | |
| (68,028 | ) | |
| 34,876 | | |
| (20,522 | ) | |
| 82,382 | |
| Adjustments to reconcile income to cash from (applied
to) operations: | |
| | | |
| | | |
| | | |
| | |
| Depreciation and amortization | |
| 37,305 | | |
| 24,456 | | |
| 73,090 | | |
| 42,264 | |
| Expected credit losses | |
| 141 | | |
| 23 | | |
| (15 | ) | |
| (28 | ) |
| Residual value of written-off property, plant and equipment
and intangible assets | |
| (1,767 | ) | |
| 3,818 | | |
| 9,456 | | |
| 23,433 | |
| Provision for contingencies | |
| (361 | ) | |
| (427 | ) | |
| (225 | ) | |
| (144 | ) |
| Income tax and social contribution - Deferred | |
| (929 | ) | |
| (989 | ) | |
| 5,703 | | |
| 5,227 | |
| Interest on loans and financing, debentures, leases and exchange
rate variation | |
| 52,615 | | |
| (25,894 | ) | |
| 78,049 | | |
| (20,361 | ) |
| Changes in assets and liabilities: | |
| | | |
| | | |
| | | |
| | |
| Accounts receivable | |
| 73,473 | | |
| (49,946 | ) | |
| 13,227 | | |
| (71,614 | ) |
| Recoverable taxes | |
| (2,420 | ) | |
| 2,916 | | |
| (7,544 | ) | |
| 45 | |
| Prepaid expenses | |
| (6,154 | ) | |
| (13,001 | ) | |
| 2,751 | | |
| (14,711 | ) |
| Advances to suppliers | |
| (16,933 | ) | |
| (22,035 | ) | |
| (28,406 | ) | |
| 25,248 | |
| Inventories | |
| (5,787 | ) | |
| (1,711 | ) | |
| (7,982 | ) | |
| (2,043 | ) |
| Other accounts receivable | |
| (18,096 | ) | |
| (21,067 | ) | |
| (7,018 | ) | |
| 12,723 | |
| Suppliers | |
| (31,464 | ) | |
| 79 | | |
| (52,106 | ) | |
| 3,409 | |
| Salaries and social security charges | |
| (5,619 | ) | |
| 7,289 | | |
| (32,317 | ) | |
| 9,500 | |
| Taxes payable | |
| (1,867 | ) | |
| 990 | | |
| 1,989 | | |
| (3,518 | ) |
| Other accounts payable | |
| (16,135 | ) | |
| 58,115 | | |
| 43,412 | | |
| 3,478 | |
| Total | |
| (31,002 | ) | |
| (38,371 | ) | |
| (73,994 | ) | |
| (37,483 | ) |
| Cash generated from operating activities | |
| 103,081 | | |
| (2,508 | ) | |
| 71,542 | | |
| 95,290 | |
| | |
| | | |
| | | |
| | | |
| | |
| Interest paid on loans and financing | |
| (5,681 | ) | |
| (3,113 | ) | |
| (24,803 | ) | |
| (5,724 | ) |
| Interest paid on debentures | |
| - | | |
| - | | |
| (46,891 | ) | |
| - | |
| Interest paid on leases | |
| (660 | ) | |
| (950 | ) | |
| (1,411 | ) | |
| (1,185 | ) |
| Income tax and social contribution | |
| (4,926 | ) | |
| - | | |
| (12,154 | ) | |
| (595 | ) |
| Total | |
| (11,267 | ) | |
| (4,063 | ) | |
| (85,259 | ) | |
| (7,504 | ) |
| | |
| | | |
| | | |
| | | |
| | |
| Cash from (invested in) operations | |
| 91,814 | | |
| (6,571 | ) | |
| (13,717 | ) | |
| 87,786 | |
| | |
| | | |
| | | |
| | | |
| | |
| Cash flow from investing activities | |
| | | |
| | | |
| | | |
| | |
| Cash spent on companies' acquisitions; net of cash received | |
| (21,523 | ) | |
| 2,588 | | |
| (25,169 | ) | |
| (140,365 | ) |
| Payment of obligations from acquisition of investments | |
| (20,452 | ) | |
| 102,837 | | |
| (64,923 | ) | |
| (40,116 | ) |
| Acquisition of property, plant and equipment and intangible
assets | |
| (38,416 | ) | |
| 64,238 | | |
| (108,955 | ) | |
| (78,715 | ) |
| | |
| | | |
| | | |
| | | |
| | |
| Net cash used in investing activities | |
| (80,391 | ) | |
| (41,284 | ) | |
| (199,047 | ) | |
| (259,196 | ) |
| | |
| | | |
| | | |
| | | |
| | |
| Cash flow from financing activities | |
| | | |
| | | |
| | | |
| | |
| Attributed to shareholders | |
| | | |
| | | |
| | | |
| | |
| Profit distribution - prior periods | |
| (16,744 | ) | |
| - | | |
| (47,900 | ) | |
| - | |
| Increase in minority interest | |
| 100,214 | | |
| - | | |
| 699,532 | | |
| - | |
| Capital Increase | |
| (104,040 | ) | |
| - | | |
| - | | |
| - | |
| | |
| | | |
| | | |
| | | |
| | |
| Attributed to financing | |
| | | |
| | | |
| | | |
| | |
| Related parties | |
| 144,077 | | |
| 112,131 | | |
| 104,509 | | |
| (101,675 | ) |
| Lease payments - Principal | |
| (24,413 | ) | |
| 825 | | |
| (28,392 | ) | |
| (7,332 | ) |
| Proceeds from loans and financing | |
| 20,100 | | |
| 4,995 | | |
| 37,765 | | |
| 7,255 | |
| Proceeds from debentures | |
| - | | |
| - | | |
| - | | |
| 335,500 | |
| Funding of debentures | |
| 542 | | |
| - | | |
| 1,028 | | |
| - | |
| Payments of loans and financing - Principal | |
| (17,553 | ) | |
| (22,590 | ) | |
| (63,980 | ) | |
| (33,396 | ) |
| Payment of Share Issuance Costs | |
| - | | |
| (5,299 | ) | |
| - | | |
| (5,299 | ) |
| Net cash generated from financing
activities | |
| 102,183 | | |
| 90,062 | | |
| 702,562 | | |
| 195,053 | |
| | |
| | | |
| | | |
| | | |
| | |
| Increase (decrease) in cash and
cash equivalents | |
| 113,606 | | |
| 42,207 | | |
| 489,798 | | |
| 23,643 | |
| Exchange rate change in cash and cash equivalents | |
| (157,180 | ) | |
| (20,742 | ) | |
| (69,576 | ) | |
| 14,669 | |
| Cash and cash equivalents at the beginning
of the period | |
| 735,403 | | |
| 135,765 | | |
| 271,607 | | |
| 118,918 | |
| Cash and cash equivalents at the
end of the period | |
| 691,829 | | |
| 157,230 | | |
| 691,829 | | |
| 157,230 | |
Reconciliation
of Non-GAAP Measures
Reconciliation
of our Loans and Financings and Debentures to Total Gross Debt, Financial Net Debt based on Covenants, Net Debt Including Related Parties
and Financial Leverage, Financial Leverage including Related Parties
| R$ Million | |
| 2Q23 | | |
| 4Q22 | |
| (+) Short Term Loans and financing | |
| 62.1 | | |
| 67.7 | |
| (+) Short Term Debentures | |
| 139.1 | | |
| 84.2 | |
| (+) Long Term Loans and financing | |
| 592.9 | | |
| 649.8 | |
| (+) Long Term Debentures | |
| 462.3 | | |
| 516.5 | |
| Financial Gross Debt | |
| 1,256.4 | | |
| 1,318.1 | |
| (-) Cash and equivalents | |
| 691.8 | | |
| 271.6 | |
| (=) Financial Net Debt based on Covenants | |
| 564.6 | | |
| 1,046.5 | |
| (/)
Pro forma annualized EBITDA(1) | |
| 601.4 | | |
| 691.9 | |
| Financial Leverage (x) | |
| 0.94 | | |
| 1.51 | |
| | |
| | | |
| | |
| Financial Gross Debt | |
| 1,256.4 | | |
| 1,318.1 | |
| (+) Related Parties Loans | |
| 606.8 | | |
| 769.8 | |
| Total Gross Debt | |
| 1,863.3 | | |
| 2,087.9 | |
| (-) Cash and equivalents | |
| 691.8 | | |
| 271.6 | |
| (-) Related Parties Assets | |
| 25.9 | | |
| 26.2 | |
| (=) Net Debt Including Related Parties | |
| 1,145.5 | | |
| 1,790.1 | |
| (/)
Pro forma annualized EBITDA(1) | |
| 601.4 | | |
| 691.9 | |
| Financial Leverage Including Related Parties (x) | |
| 1.90 | | |
| 2.59 | |
| 1- | Calculated
as the EBTIDA for 2Q23 multiplied by four. |
Reconciliation of our profit for the period
to EBITDA and EBITDA Margin
| R$ Million | |
| 2Q23 | | |
| 2Q22 | | |
| 6M23 | | |
| 6M22 | |
| Profit for period | |
| 47.1 | | |
| 34.9 | | |
| (20.5 | ) | |
| 82.4 | |
| (+) Income tax and social contribution | |
| (15.1 | ) | |
| (6.6 | ) | |
| (35.3 | ) | |
| (19.9 | ) |
| (+) Financial Results | |
| (50.9 | ) | |
| (16.6 | ) | |
| (80.6 | ) | |
| (23.3 | ) |
| (+) Depreciation and amortization expenses | |
| (37.3 | ) | |
| (24.5 | ) | |
| (73.1 | ) | |
| (42.3 | ) |
| (+) NYSE American Listing expenses | |
| - | | |
| - | | |
| (121.0 | ) | |
| - | |
| EBITDA (a) | |
| 150.3 | | |
| 82.6 | | |
| 289.4 | | |
| 167.9 | |
| Net revenue (b) | |
| 612.1 | | |
| 332.6 | | |
| 1,208.3 | | |
| 654.5 | |
| EBITDA Margin (a)/(b) | |
| 24.6 | % | |
| 24.8 | % | |
| 23.9 | % | |
| 25.7 | % |
Reconciliation
of our gross revenues to Gross Profit and Gross Margin
| R$ Million | |
| 2Q23 | | |
| 2Q22 | | |
| 6M23 | | |
| 6M22 | |
| Net revenue (a) | |
| 612.1 | | |
| 332.6 | | |
| 1,208.3 | | |
| 654.5 | |
| Cost of Services provided | |
| | | |
| | | |
| | | |
| | |
| Personnel | |
| (253.4 | ) | |
| (120.2 | ) | |
| (491.0 | ) | |
| (238.2 | ) |
| Third parties | |
| (92.2 | ) | |
| (49.5 | ) | |
| (181.0 | ) | |
| (96.4 | ) |
| Fuel | |
| (12.8 | ) | |
| (18.7 | ) | |
| (25.3 | ) | |
| (30.9 | ) |
| Freights | |
| (0.8 | ) | |
| (1.2 | ) | |
| (2.2 | ) | |
| (2.3 | ) |
| Maintenance | |
| (24.7 | ) | |
| (8.1 | ) | |
| (44.6 | ) | |
| (14.7 | ) |
| Taxes | |
| (4.2 | ) | |
| (6.2 | ) | |
| (15.1 | ) | |
| (15.6 | ) |
| Marketing | |
| (5.3 | ) | |
| (0.7 | ) | |
| (8.4 | ) | |
| (1.2 | ) |
| Materials | |
| (5.2 | ) | |
| (3.5 | ) | |
| (27.5 | ) | |
| (33.2 | ) |
| Telecommunications | |
| (2.9 | ) | |
| (0.6 | ) | |
| (6.6 | ) | |
| (1.2 | ) |
| Travel | |
| (19.2 | ) | |
| (4.6 | ) | |
| (37.2 | ) | |
| (9.2 | ) |
| Depreciation | |
| (37.3 | ) | |
| (21.2 | ) | |
| (73.1 | ) | |
| (42.3 | ) |
| Rents | |
| (11.7 | ) | |
| (9.5 | ) | |
| (22.4 | ) | |
| (19.1 | ) |
| Others | |
| (21.9 | ) | |
| (27.3 | ) | |
| (178.6 | ) | |
| (24.6 | ) |
| Total Cost of Services provided | |
| (491.5 | ) | |
| (271.2 | ) | |
| (1,113.0 | ) | |
| (528.9 | ) |
| (-) SG&A | |
| (7.6 | ) | |
| (6.5 | ) | |
| (12.7 | ) | |
| (14.0 | ) |
| (-) Depreciation | |
| (37.3 | ) | |
| (21.2 | ) | |
| (73.1 | ) | |
| (42.3 | ) |
| (-) NYSE American Listing expenses | |
| - | | |
| - | | |
| (121.0 | ) | |
| - | |
| Cost of Services provided (cash) (b) | |
| (454.1 | ) | |
| (243.6 | ) | |
| (906.3 | ) | |
| (472.6 | ) |
| Gross Profit (a)+(b) | |
| 157.9 | | |
| 89.1 | | |
| 302.1 | | |
| 182.0 | |
| Gross Margin | |
| 25.8 | % | |
| 26.8 | % | |
| 25.0 | % | |
| 27.8 | % |
Reconciliation
of our operating profit to ROIC
| R$
Million | |
| 2Q23
LTM | | |
| 4Q22
LTM | | |
| 2Q23
(A) | | |
| 1Q23
(B) | | |
| 4Q22
(C) | | |
| 3Q22
(D) | | |
| 2Q22
(E) | | |
| 1Q22
(F) | | |
| 4Q21
(G) | |
| Operating
profit2 | |
| 427.5 | | |
| 336.8 | | |
| 113.0 | | |
| 103.3 | | |
| 138.1 | | |
| 73.0 | | |
| 61.4 | | |
| 64.2 | | |
| 73.9 | |
| Income
tax adjustment1,2 | |
| (128.2 | ) | |
| (101.0 | ) | |
| (33.9 | ) | |
| (31.0 | ) | |
| (41.4 | ) | |
| (21.9 | ) | |
| (18.4 | ) | |
| (19.2 | ) | |
| (22.2 | ) |
| Net
operating profit after tax (a)2 | |
| 299.2 | | |
| 235.7 | | |
| 79.1 | | |
| 72.3 | | |
| 96.7 | | |
| 51.1 | | |
| 43.0 | | |
| 44.9 | | |
| 51.7 | |
| Total
Shareholders’ equity3 | |
| 730.8 | | |
| 385.1 | | |
| 1,179.7 | | |
| 1,204.4 | | |
| 447.1 | | |
| 435.8 | | |
| 387.1 | | |
| 317.6 | | |
| 337.9 | |
| (+)
Financial Gross Debt3 | |
| 1,149.7 | | |
| 907.8 | | |
| 1,256.4 | | |
| 1,092.8 | | |
| 1,790.1 | | |
| 929.0 | | |
| 679.9 | | |
| 656.2 | | |
| 483.8 | |
| (-)
Cash and cash equivalents3 | |
| 504.8 | | |
| 270.3 | | |
| 691.8 | | |
| 735.4 | | |
| 271.6 | | |
| 668.1 | | |
| 157.2 | | |
| 135.8 | | |
| 118.9 | |
| (+)
Related parties loans (current and non-current)3 | |
| 588.9 | | |
| 509.2 | | |
| 606.8 | | |
| 607.2 | | |
| 769.8 | | |
| 595.5 | | |
| 365.1 | | |
| 333.3 | | |
| 482.2 | |
| (-)
Related parties assets3 | |
| 32.1 | | |
| 35.5 | | |
| 25.9 | | |
| 26.0 | | |
| 26.2 | | |
| 41.6 | | |
| 41.0 | | |
| 34.1 | | |
| 34.7 | |
| Invested
capital (b) | |
| 1,858.3 | | |
| 1,292.9 | | |
| 1,558.1 | | |
| 1,573.8 | | |
| 1,612.5 | | |
| 892.3 | | |
| 730.2 | | |
| 707.1 | | |
| 595.4 | |
| ROIC
(a)/(b) | |
| 16.1 | % | |
| 18.2 | % | |
| | | |
| | | |
| | | |
| | | |
| | | |
| | | |
| | |
| | |
| | | |
| | | |
| | | |
| | | |
| | | |
| | | |
| | | |
| | | |
| | |
| (-)
Goodwill3 | |
| 1,028.9 | | |
| 811.2 | | |
| 1,188.9 | | |
| 1,178.8 | | |
| 1,192.3 | | |
| 861.6 | | |
| 720.3 | | |
| 696.6 | | |
| 584.9 | |
| (-)
Intangibles assets3 | |
| 245.0 | | |
| 96.4 | | |
| 369.3 | | |
| 395.0 | | |
| 420.2 | | |
| 30.7 | | |
| 9.9 | | |
| 10.4 | | |
| 10.5 | |
| Invested
capital ex Goodwill and intangible assets (c) | |
| 584.9 | | |
| 385.4 | | |
| 767.1 | | |
| 723.3 | | |
| 624.7 | | |
| 472.5 | | |
| 336.7 | | |
| 266.7 | | |
| 226.4 | |
| ROIC
(a)/(c) | |
| 51.2 | % | |
| 61.2 | % | |
| | | |
| | | |
| | | |
| | | |
| | | |
| | | |
| | |
1
Income tax adjustment is defined as operating profit for the period multiplied by our normalized effective tax rate for the period,
the numerator of which is income tax and social contribution and the denominator of which is profit before tax.
2.
Considers the sum of the last 4 quarters.
3.
Considers the average of the last 5 quarters.
Ambipar Emergency Response (AMEX:AMBI)
Historical Stock Chart
From Apr 2024 to May 2024

Ambipar Emergency Response (AMEX:AMBI)
Historical Stock Chart
From May 2023 to May 2024
