Oil ETFs Slump on Weak Data - ETF News And Commentary
May 01 2013 - 9:50AM
Zacks
Oil prices have been a bit rocky to open up 2013, as conflicting
data points have tugged the important commodity in both directions.
Strong stock prices and a robust consumer have helped to push oil
higher in some sessions, while a firm dollar and uncertain data
readings from around the globe have been the main catalysts for
lower prices.
While oil has been favoring the bull market for much of the
second half of April, May isn’t off to as good of a start. Sluggish
data from both of the two biggest consumers of oil—the U.S. and
China—have pushed oil prices sharply lower (about 3%) to open the
month (see The Key to Investing in a Futures Backed ETF).
Weak Data in China
First, Chinese data on the manufacturing front came in rather
weak, suggesting to some that the nation is indeed slowing down.
The PMI for the country came in at just 50.6, a miss compared to
the 50.7 expectation, and lower than the 50.9 from a month ago.
This is important as 50.0 marks the difference between expansion
and contraction in the index, suggesting that it is very close to
falling into contraction territory. And with expectations of a
slowdown increasing, many are growing worried about future oil
demand in the country as well.
Closer to Home
Meanwhile in the U.S., data wasn’t much better as the domestic
PMI barely beat expectations to finish at 52.1. Furthermore, new
order growth slowed suggesting that future months could be weak as
well.
Investors also zeroed in on the ADP Employment Report, which
finished far below the consensus. In fact, the actual was just
119,000, far short of the 155,000 consensus.
To top off the weakness, crude oil inventories also soared
week-over-week, with the figure surging by over 6.7 million barrels
in Wednesday’s reading. This puts the stocks of crude oil at their
highest level ever, a trend that could continue if demand remains
sluggish (see Venezuela: The Next Black Swan for Oil ETFs?).
Impact on Oil and Oil ETFs
All of these factors combined to drag down oil prices in
Wednesday’s session, as both of the key demand markets have
question marks hanging over their growth outlooks. Unsurprisingly,
this carried over into the oil ETF world as well, with a number of
top products falling by over 2.5% on the session, including the
following funds:
- United States Oil Fund (USO)- down 2.5%
- PowerShares DB Oil Fund (DBO) – down 2.6%
- iPath Crude Oil Total Return ETN (OIL)- down
2.7%
Beyond the actual commodity, ETFs tracking the equity side of
the oil industry were also in for a rough session. The broad energy
sector did ok—as represented by XLE which lost
about 1.3%-- but there was a great deal of weaker trading in the
more niche corners of the space.
This was particularly true in the exploration and services
corners of the market, as these tend to be more volatile than their
integrated peers. Top choices in this segment like
XOP for drilling and XES for
services led the way on the downside, losing roughly 1.75% each
(read Crude Oil ETF Investing 101).

Bottom Line
It was a pretty rough day all around in the energy market, as
the data releases led to a slump in oil prices. This pushed oil
ETFs lower by about 2.5% on the day, while equity oil funds also
had a rough session.
Unfortunately, the outlook isn’t exactly great in the space
though, and especially so after the recent round of data releases.
Commodities could continue to underperform based on this sluggish
view, so investors may want to look elsewhere for exposure—like in
the MLP space—until some more positive trends can develop, and give
oil ETF investors a better outlook going forward.
Want the latest recommendations from Zacks Investment Research?
Today, you can download 7 Best Stocks for the Next 30
Days. Click to get this free report >>
PWRSH-DB OIL FD (DBO): ETF Research Reports
IPATH-GS CRUDE (OIL): ETF Research Reports
US-OIL FUND LP (USO): ETF Research Reports
SPDR-SP O&G EQP (XES): ETF Research Reports
SPDR-EGY SELS (XLE): ETF Research Reports
SPDR-SP O&G EXP (XOP): ETF Research Reports
To read this article on Zacks.com click here.
Zacks Investment Research
Want the latest recommendations from Zacks Investment Research?
Today, you can download 7 Best Stocks for the Next 30 Days. Click
to get this free report
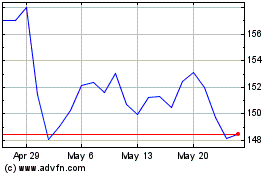
SPDR S&P Oil and Gas Exp... (AMEX:XOP)
Historical Stock Chart
From Dec 2024 to Jan 2025

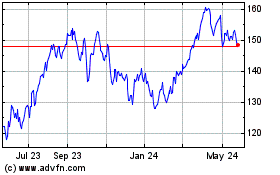
SPDR S&P Oil and Gas Exp... (AMEX:XOP)
Historical Stock Chart
From Jan 2024 to Jan 2025
