Dogecoin Forms A ‘Nasty Triple Top’: Analyst Reveals What’s Next
November 20 2024 - 10:30AM
NEWSBTC
The Dogecoin price is currently exhibiting a highly bearish chart
pattern on the 4-hour time frame, signaling potential caution for
investors. After forming a bullish falling wedge pattern between
November 12 and 19, the anticipated breakout was short-lived and
failed to meet bullish expectations. On November 19, Dogecoin broke
out of the formation, sparking initial optimism among traders.
However, crypto analyst Kevin (@Kev_Capital_TA) had predicted the
breakout would be weak, and subsequent price movements validated
his forecast. Where Is Dogecoin Price Heading Next? The memecoin
faced a sharp rejection at a significant resistance level,
specifically the macro 0.786 Fibonacci retracement level. Kevin
emphasized that until this level is “broken cleanly and violently,
there’s nothing to get overly crazy about.” He also pointed out
that Bitcoin (BTC) is at major resistance, suggesting that
Dogecoin’s next significant move will likely coincide with Bitcoin
clearing the $100,000 mark. “Until then, everything’s just gonna
mosey around,” he noted. Related Reading: Dogecoin Breaking Out Of
Falling Wedge Pattern – Analyst Reveals Target Urging traders to
temper their enthusiasm, Kevin stated, “Please control your
excitement as there is nothing in the short term to be excited
about. BTC is still at major resistance and so is Dogecoin. Nothing
has broken yet.” He highlighted the importance of Bitcoin’s
movements, adding, “It’s more important to provide technical
analysis on BTC than on Dogecoin at the moment. DOGE is just
trading sideways, waiting for Bitcoin to make a decision on higher
or lower. Where Bitcoin goes, Doge will go in the short term.”
Analyzing the 4-hour chart, Kevin identified a “nasty triple top”
at the macro 0.786 Fibonacci level for Dogecoin—a bearish signal
that could indicate upcoming downward pressure. He warned that if a
correction to $0.30 occurs, as he had previously suggested, “a lot
of blind perma bulls are gonna need to do some explaining.” A
triple top is a bearish reversal pattern in technical analysis that
signifies a potential shift from an uptrend to a downtrend. It
occurs when the price reaches the same resistance level three
times, each time retreating after failing to break through.
Dogecoin’s repeated inability to surpass the 0.786 Fib at $0.41
suggests weakening bullish momentum in the short term.
Related Reading: Analyst Predicts Rapid Dogecoin Surge To $1: The
Timing May Surprise You Kevin emphasized that Dogecoin hasn’t truly
broken out yet: “Until it breaks the macro 0.786 Fib cleanly at
$0.41, it’s just trading sideways.” Looking ahead, he outlined a
bullish scenario contingent on overcoming this key resistance
level. “If Dogecoin breaks that macro 0.786 Fib with force, then
$0.80 to $0.85 is on the table. Lots of work to do though. Need BTC
to push higher,” he explained. For several days, Kevin has been
forecasting a deeper correction for Dogecoin. The triple top
formation and rejection at the 0.786 Fibonacci level support his
primary hypothesis. He outlined his initial price target: “A level
we will want to hold for Dogecoin is the $0.30 to $0.26 range,
which is the golden pocket retrace levels. That’s a 30-40%
correction from the local top, which in a bull market is a perfect
size correction.” Focusing on the longer-term perspective, Kevin
highlighted the significance of the upcoming monthly candle close.
“The next big goal for Dogecoin is to close a monthly candle in 11
days above $0.335. That would make the highest monthly candle close
of all time for DOGE, and I will be keeping my eye closely on
this,” he stated. At press time, DOGE traded at $0.39. Featured
image created with DALL.E, chart from TradingView.com
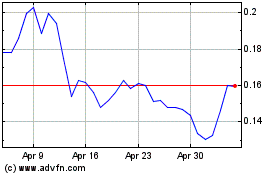
Dogecoin (COIN:DOGEUSD)
Historical Stock Chart
From Nov 2024 to Dec 2024

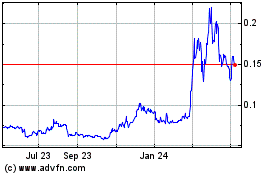
Dogecoin (COIN:DOGEUSD)
Historical Stock Chart
From Dec 2023 to Dec 2024
