Analyst Upbeat On XRP Rally Despite SEC Meeting Cancellation – Details
July 19 2024 - 11:00AM
NEWSBTC
Nobody in the XRP community expected the SEC to cancel a meeting
behind closed doors on July 18 without giving any reason. Some
people think this move has something to do with the approval
process for spot Ethereum ETFs. Related Reading: Injective (INJ)
Breaches Key Resistance, Setting Stage For 1,350% Boom — Analyst
Crypto Community Clueless On Meeting Cancellation There has been an
obvious shakeup in the cryptocurrency market because of the sudden
about-face. XRP, Ripple’s native coin, fell 8% to $0.58, its
24-hour low. Trade volume was down as well, yet it rose 20%,
showing investors’ interest amid uncertainties. There is a lot of
talk in the market that the SEC’s decision might have something to
do with the process of approving spot Ethereum ETFs. Some of these
funds have already been given preliminary approvals and were
supposed to start trading next week. The US regulator may have
canceled the meetings as a smart move in light of these events. XRP
market cap currently at $30.9 billion. Chart: TradingView.com
Market Experts Keep A Close Eye On The Altcoin Technical experts
are paying close attention to how the price of XRP changes in this
unstable market. Javon, a renowned analyst, identified a chart
pattern that resembles XRP’s recent bull run. The symmetrical
triangular pattern expanding since 2018 matches the 2014–2017
trend. The first pattern led to a rapid rise that sent XRP from
about $0.005 to a staggering high of $3.347, a rise of almost
43,000%. $XRP (Ripple) is RIGHT NEAR a point of BREAKOUT 🤯! A
breakout has the potential to spark a more than 300X, 2017 Style
bull move into the $100s… https://t.co/fFRvHYITYn
pic.twitter.com/sDJWAJcZ8A — JAVON⚡️MARKS (@JavonTM1) July 17, 2024
If the past is any indication, another rise could be coming soon.
According to Javon’s prediction, the price of XRP could climb to a
level above $237. Even though this prediction is very high, it fits
with how things have been in the past and shows that things could
go up from where they are now. XRP: Resistance And Support The
technical indicators at hand provide XRP buyers with a
mixed bag of data. In terms of support, the altcoin is
still higher above the 50% Fibonacci retracing line and the
100-hour Simple Moving Average. Strong support is spotted at
$0.5820 and $0.5850. These figures are quite significant as they
highlight major areas where the price may settle and maybe even
rise. On the other hand, the coin meets strong opposition at
different levels. Right now, there is resistance around $0.620.
There are also bigger blocks at $0.6350, $0.6420, and possibly even
$0.6550 and $0.680. Related Reading: Dogecoin Big Rally Ahead:
Analyst Sees ‘Most Beautiful’ Chart Pattern If there is a clear
break above these support levels, more gains could happen. But if
XRP fails to break through these levels, there may be a drop to the
downside. The price is likely to find support near $0.600, and it
will likely go down even more if it falls below $0.5850. Featured
image from Quick Tips, chart from TradingView
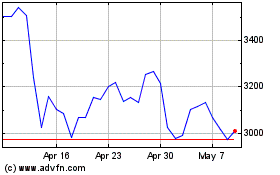
Ethereum (COIN:ETHUSD)
Historical Stock Chart
From Jun 2024 to Jul 2024

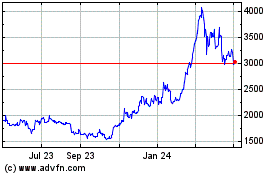
Ethereum (COIN:ETHUSD)
Historical Stock Chart
From Jul 2023 to Jul 2024
