Wereldhave Belgium : Trading update Q3 2017
October 19 2017 - 1:00AM

Wereldhave Belgium : Trading
update Q3 2017
-
Increase rental income to €
37.6 mln (2016: € 37.4 mln)
-
Increase occupancy rate in
shopping centres (96.1%)
-
Confirmation prospects: Net
result from core activities per share € 5.65 - 5.75 (2016: €
5.78)
Follow this link to view the
press release in PDF:
Trading update Q3 2017
This
announcement is distributed by Nasdaq Corporate Solutions on behalf
of Nasdaq Corporate Solutions clients.
The issuer of this announcement warrants that they are solely
responsible for the content, accuracy and originality of the
information contained therein.
Source: Wereldhave Belgium via Globenewswire
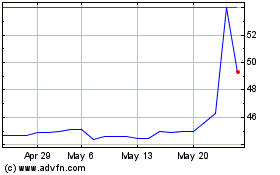
Wereldhave Belgium (EU:WEHB)
Historical Stock Chart
From Jun 2024 to Jul 2024

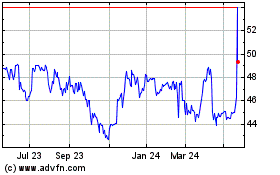
Wereldhave Belgium (EU:WEHB)
Historical Stock Chart
From Jul 2023 to Jul 2024
