Wereldhave Belgium : Results 2019
February 05 2020 - 12:26PM

Wereldhave Belgium : Results 2019
STRONG OPERATIONAL RESULTS AND FURTHER
CONSOLIDATION OF THE RETAIL PORTFOLIO
·Net result from core activities per share €
5.92 (2018: € 5.74)·Net asset
value per share € 88.27 (2018: € 89.97)·EPRA
occupancy rate 95.2% (2018: 96.2%)·Debt ratio of
29.33% (2018: 29.68%)·Increase in the number of
visitors in the shopping centers by 4.95% compared to the same
period last year (comparable market figure of
-0.88%)·Optional dividend proposal € 5.20 gross -
€ 3.64 net (2018: € 5.20 gross - € 3.64
net)·Forecasted net result from core activities
between € 5.55 and € 5.65 for 2020
A telephone line will be open this Tuesday 11/02/2020 at 11:00
am to comment on these results and answer any questions.
The access codes are listed below:
Access number: +32(0)27460055 or 080055746
Participant PIN : 23279819#
- Press release - Results 2019
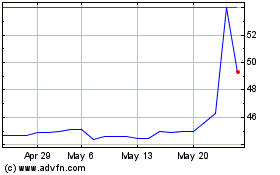
Wereldhave Belgium (EU:WEHB)
Historical Stock Chart
From Jun 2024 to Jul 2024

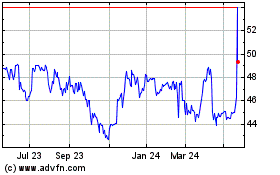
Wereldhave Belgium (EU:WEHB)
Historical Stock Chart
From Jul 2023 to Jul 2024
