SECURITIES
AND EXCHANGE COMMISSION
Washington,
D.C. 20549
Form
6-K
REPORT
OF FOREIGN PRIVATE ISSUER
PURSUANT
TO RULE 13a-16 OR 15d-16
UNDER
THE SECURITIES EXCHANGE ACT OF 1934
For
the month of May 2024
Commission
File Number: 001-39255
International
General Insurance Holdings Ltd.
(Translation
of Registrant’s name into English)
74 Abdel
Hamid Sharaf Street, P.O. Box 941428, Amman 11194, Jordan
(Address
of principal executive offices)
Indicate
by check mark whether the registrant files or will file annual reports under cover of Form 20-F or Form 40-F.
Form
20-F ☒ Form 40-F ☐
EXHIBIT
SIGNATURE
Pursuant
to the requirements of the Securities Exchange Act of 1934, the registrant has duly caused this report to be signed on its behalf by
the undersigned, thereunto duly authorized.
| |
INTERNATIONAL GENERAL INSURANCE HOLDINGS
LTD. |
| |
|
|
|
| Date: May 7, 2024 |
By: |
/s/
Pervez Rizvi |
| |
|
Name: |
Pervez Rizvi |
| |
|
Title: |
Chief Financial Officer |
Exhibit 99.1
IGI Investor Presentation First Quarter 2024 May 2024
International General Insurance Holdings Ltd. 2 Forward Looking Statements This presentation contains “forward - looking statements” within the meaning of the “safe harbour” provisions of the Private Securities Litigation Reform Act of 1995 . The expectations, estimates, and projections of the business of IGI may differ from its actual results and, consequently, you should not rely on forward - looking statements as predictions of future events . Words such as “expect,” “estimate,” “project,” “budget,” “forecast,” “anticipate,” “intend,” “plan,” “may,” “will,” “could,” “should,” “believes,” “predicts,” “potential,” “continue,” “commitment,” and similar expressions are intended to identify such forward - looking statements . Forward - looking statements contained in this press release may include, but are not limited to, our expectations regarding the performance of our business, our financial results, our liquidity and capital resources, the outcome of our strategic initiatives, our expectations regarding pricing and other market conditions, and our growth prospects . These forward - looking statements involve significant risks and uncertainties that could cause the actual results to differ materially from the expected results . Most of these factors are outside of the control of IGI and are difficult to predict . Factors that may cause such differences include, but are not limited to : ( 1 ) changes in demand for IGI’s services together with the possibility that IGI may be adversely affected by other economic, business, and/or competitive factors globally and in the regions in which it operates ; ( 2 ) competition, the ability of IGI to grow and manage growth profitably and IGI’s ability to retain its key employees ; ( 3 ) changes in applicable laws or regulations ; ( 4 ) the outcome of any legal proceedings that may be instituted against the Company ; ( 5 ) the effects of the hostilities between Russia and Ukraine and the sanctions imposed on Russia by the United States, European Union, United Kingdom and others ; ( 6 ) the effects of the war between Israel and Hamas ; ( 7 ) the inability to maintain the listing of the Company’s common shares on Nasdaq ; and ( 8 ) other risks and uncertainties indicated in IGI’s filings with the SEC . The foregoing list of factors is not exclusive . In addition, forward - looking statements are inherently based on various estimates and assumptions that are subject to the judgment of those preparing them and are also subject to significant economic, competitive, industry and other uncertainties and contingencies, all of which are difficult or impossible to predict and many of which are beyond the control of IGI . There can be no assurance that IGI’s financial condition or results of operations will be consistent with those set forth in such forward - looking statements . You should not place undue reliance upon any forward - looking statements, which speak only as of the date made . IGI does not undertake or accept any obligation or undertaking to release publicly any updates or revisions to any forward - looking statements to reflect any change in its expectations or any change in events, conditions, or circumstances on which any such statement is based except to the extent that is required by law .
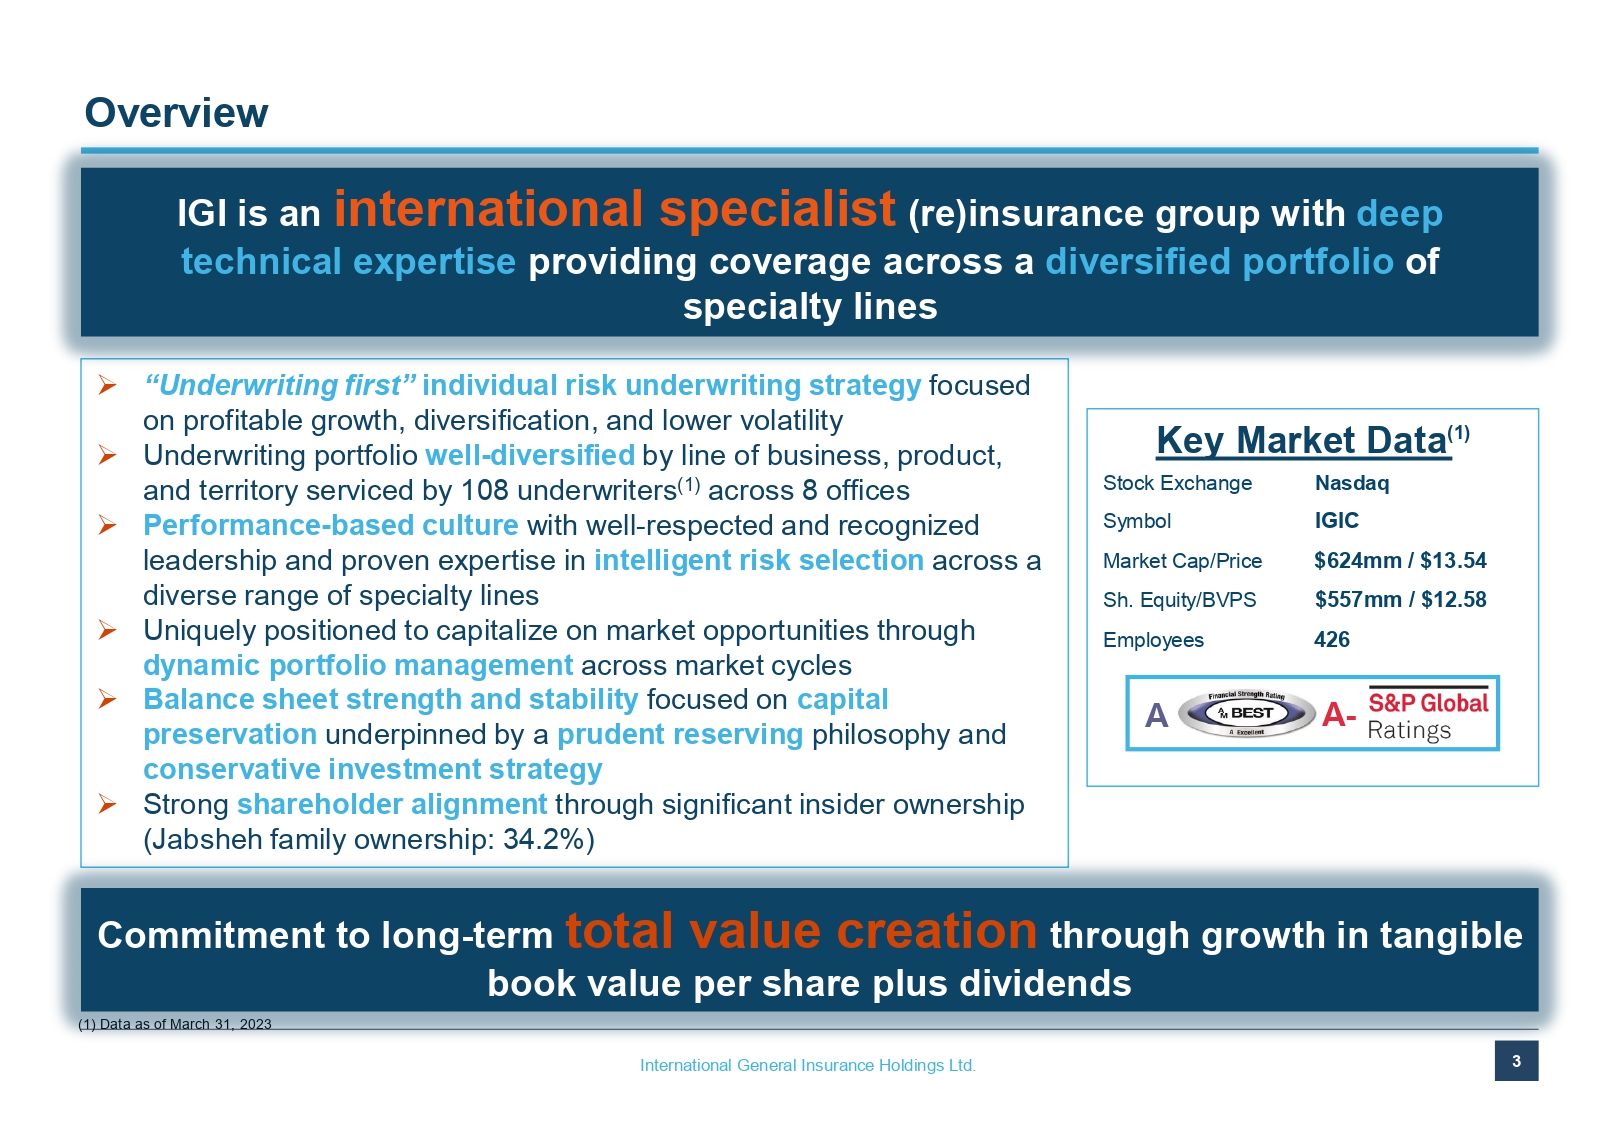
International General Insurance Holdings Ltd. 3 Key Market Data ( 1) Stock Exchange Nasdaq Symbol I GIC Market Cap/Price $624mm / $13.54 Sh. Equity/BVPS $557mm / $12.58 Employees 426 » “Underwriting first” individual risk underwriting strategy focused on profitable growth, diversification, and lower volatility » Underwriting portfolio well - diversified by line of business, product, and territory serviced by 108 underwriters (1) across 8 offices » Performance - based culture with well - respected and recognized leadership and proven expertise in intelligent risk selection across a diverse range of specialty lines » Uniquely positioned to capitalize on market opportunities through dynamic portfolio management across market cycles » Balance sheet strength and stability focused on capital preservation underpinned by a prudent reserving philosophy and conservative investment strategy » Strong shareholder alignment through significant insider ownership (Jabsheh family ownership: 34.2%) Overview IGI is an international specialist (re)insurance group with deep technical expertise providing coverage across a diversified portfolio of specialty lines A - A (1) Data as of March 31, 2023 Commitment to long - term total value creation through growth in tangible book value per share plus dividends
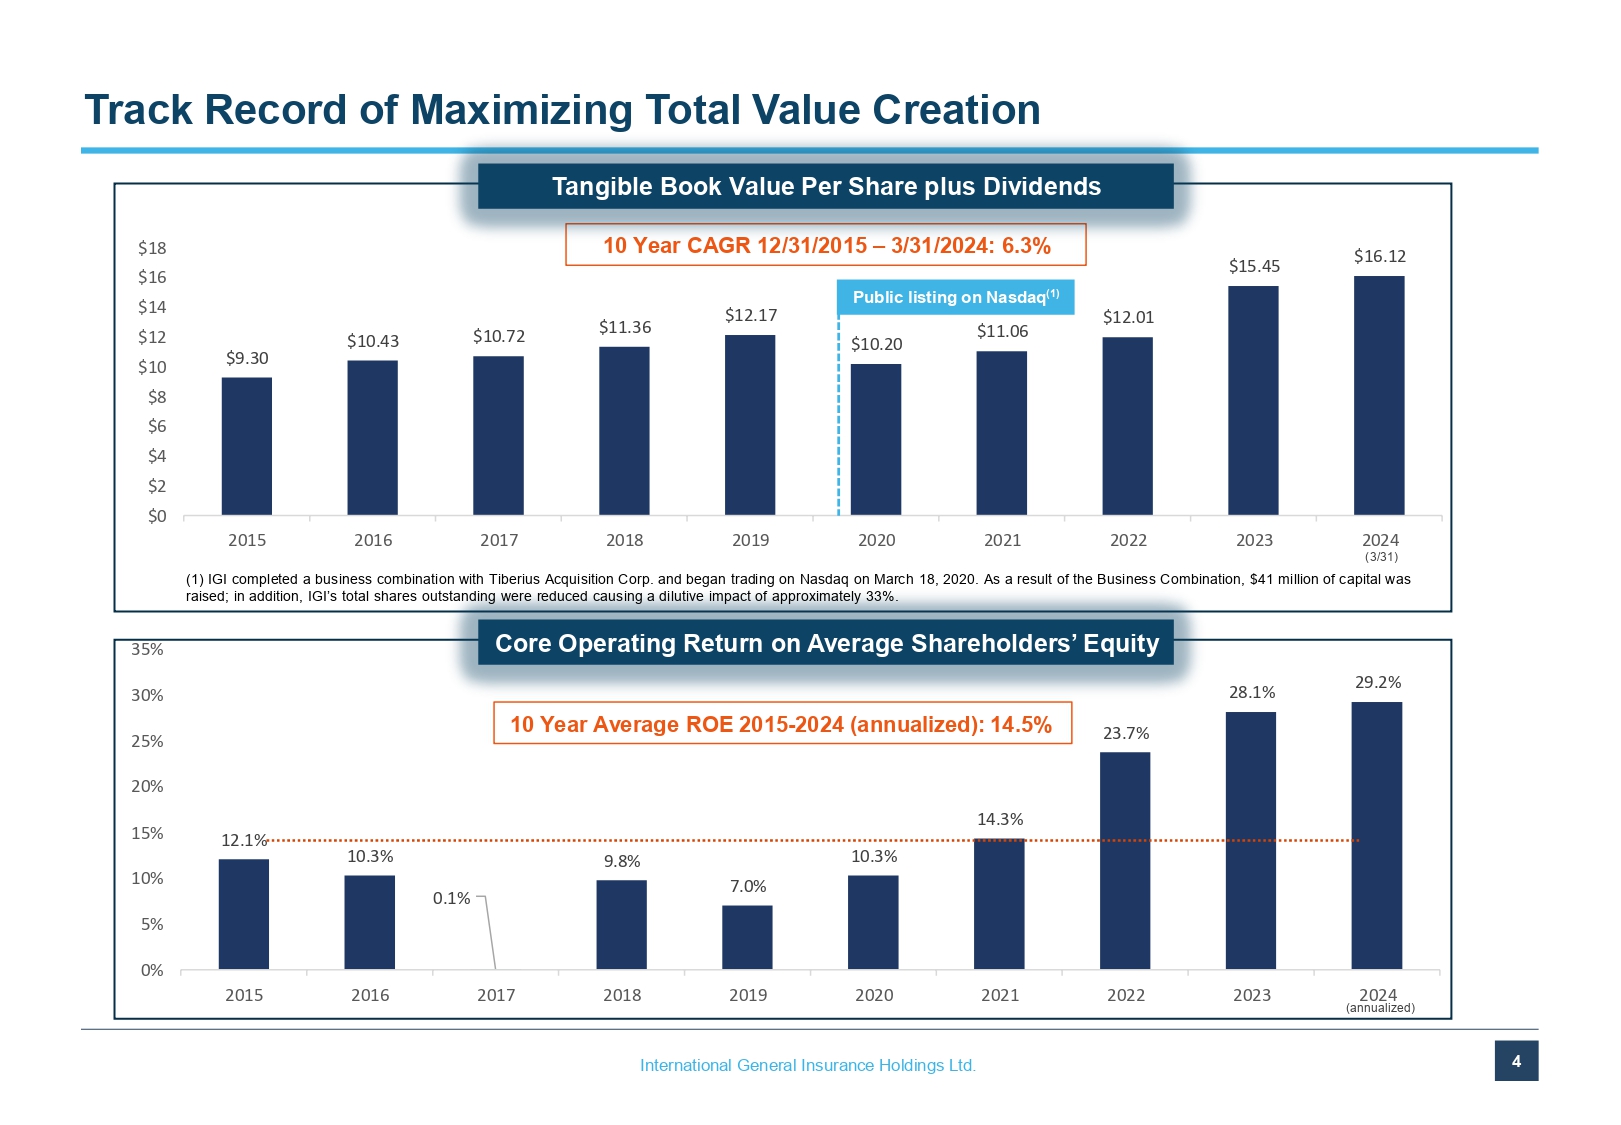
International General Insurance Holdings Ltd. 4 12.1% 10.3% 0.1% 9.8% 7.0% 10.3% 14.3% 23.7% 28.1% 29.2% 0% 5% 10% 15% 20% 25% 30% 35% 2015 2016 2017 2018 2019 2020 2021 2022 2023 2024 $9.30 $10.43 $10.72 $11.36 $12.17 $10.20 $11.06 $12.01 $15.45 $16.12 $0 $2 $4 $6 $8 $10 $12 $14 $16 $18 2015 2016 2017 2018 2019 2020 2021 2022 2023 2024 Track Record of Maximizing Total Value Creation 10 Year Average ROE 2015 - 2024 (annualized): 14.5% 10 Year CAGR 12/31/2015 – 3/31/2024: 6.3% Core Operating Return on Average Shareholders’ Equity Public listing on Nasdaq (1) (1) IGI completed a business combination with Tiberius Acquisition Corp. and began trading on Nasdaq on March 18, 2020. As a res ult of the Business Combination, $41 million of capital was raised; in addition, IGI’s total shares outstanding were reduced causing a dilutive impact of approximately 33%. Tangible Book Value Per Share plus Dividends (3/31) (annualized)
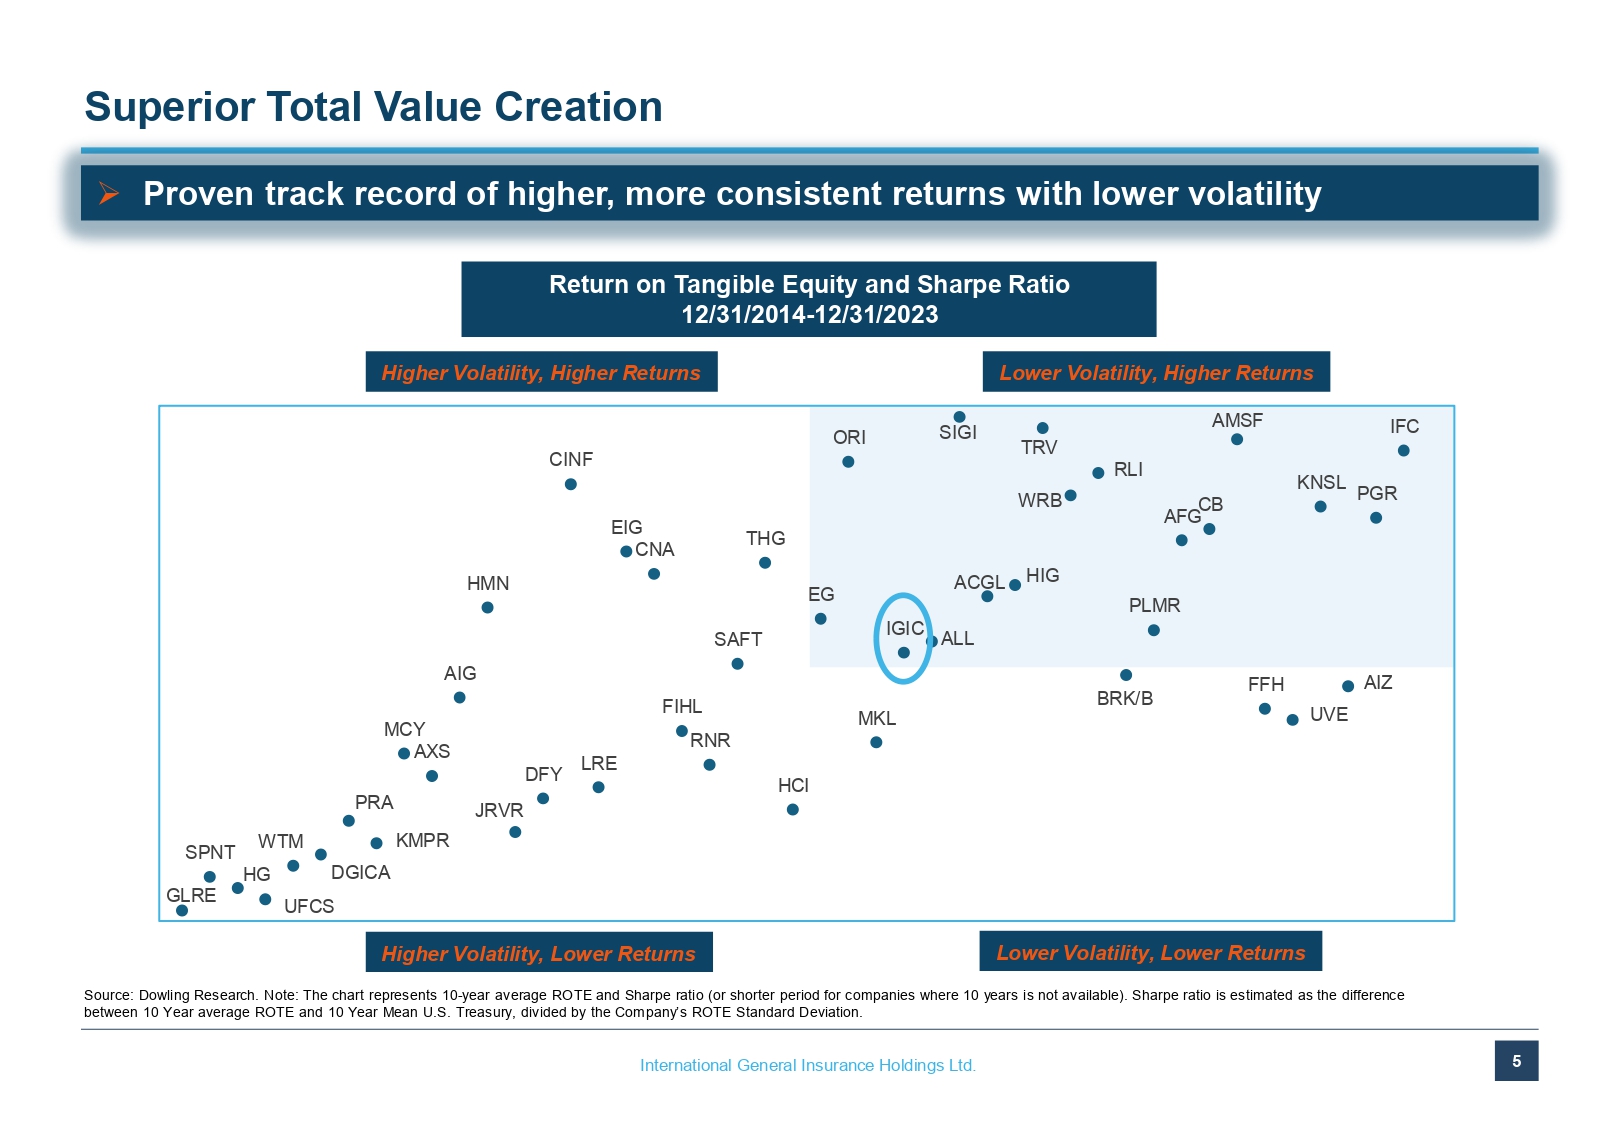
International General Insurance Holdings Ltd. 5 IFC PGR AIZ KNSL UVE FFH AMSF CB AFG PLMR BRK/B RLI WRB TRV HIG ACGL SIGI ALL IGIC MKL ORI EG HCI THG SAFT RNR FIHL CNA EIG LRE CINF DFY JRVR HMN AIG AXS MCY KMPR PRA DGICA WTM UFCS HG SPNT GLRE Return on Tangible Equity and Sharpe Ratio 12/31/2014 - 12/31/2023 Superior Total Value Creation Source: Dowling Research. Note: The chart represents 10 - year average ROTE and Sharpe ratio (or shorter period for companies wher e 10 years is not available). Sharpe ratio is estimated as the difference between 10 Year average ROTE and 10 Year Mean U.S. Treasury, divided by the Company’s ROTE Standard Deviation. Lower Volatility, Higher Returns Higher Volatility, Higher Returns Higher Volatility, Lower Returns Lower Volatility, Lower Returns » Proven track record of higher, more consistent returns with lower volatility
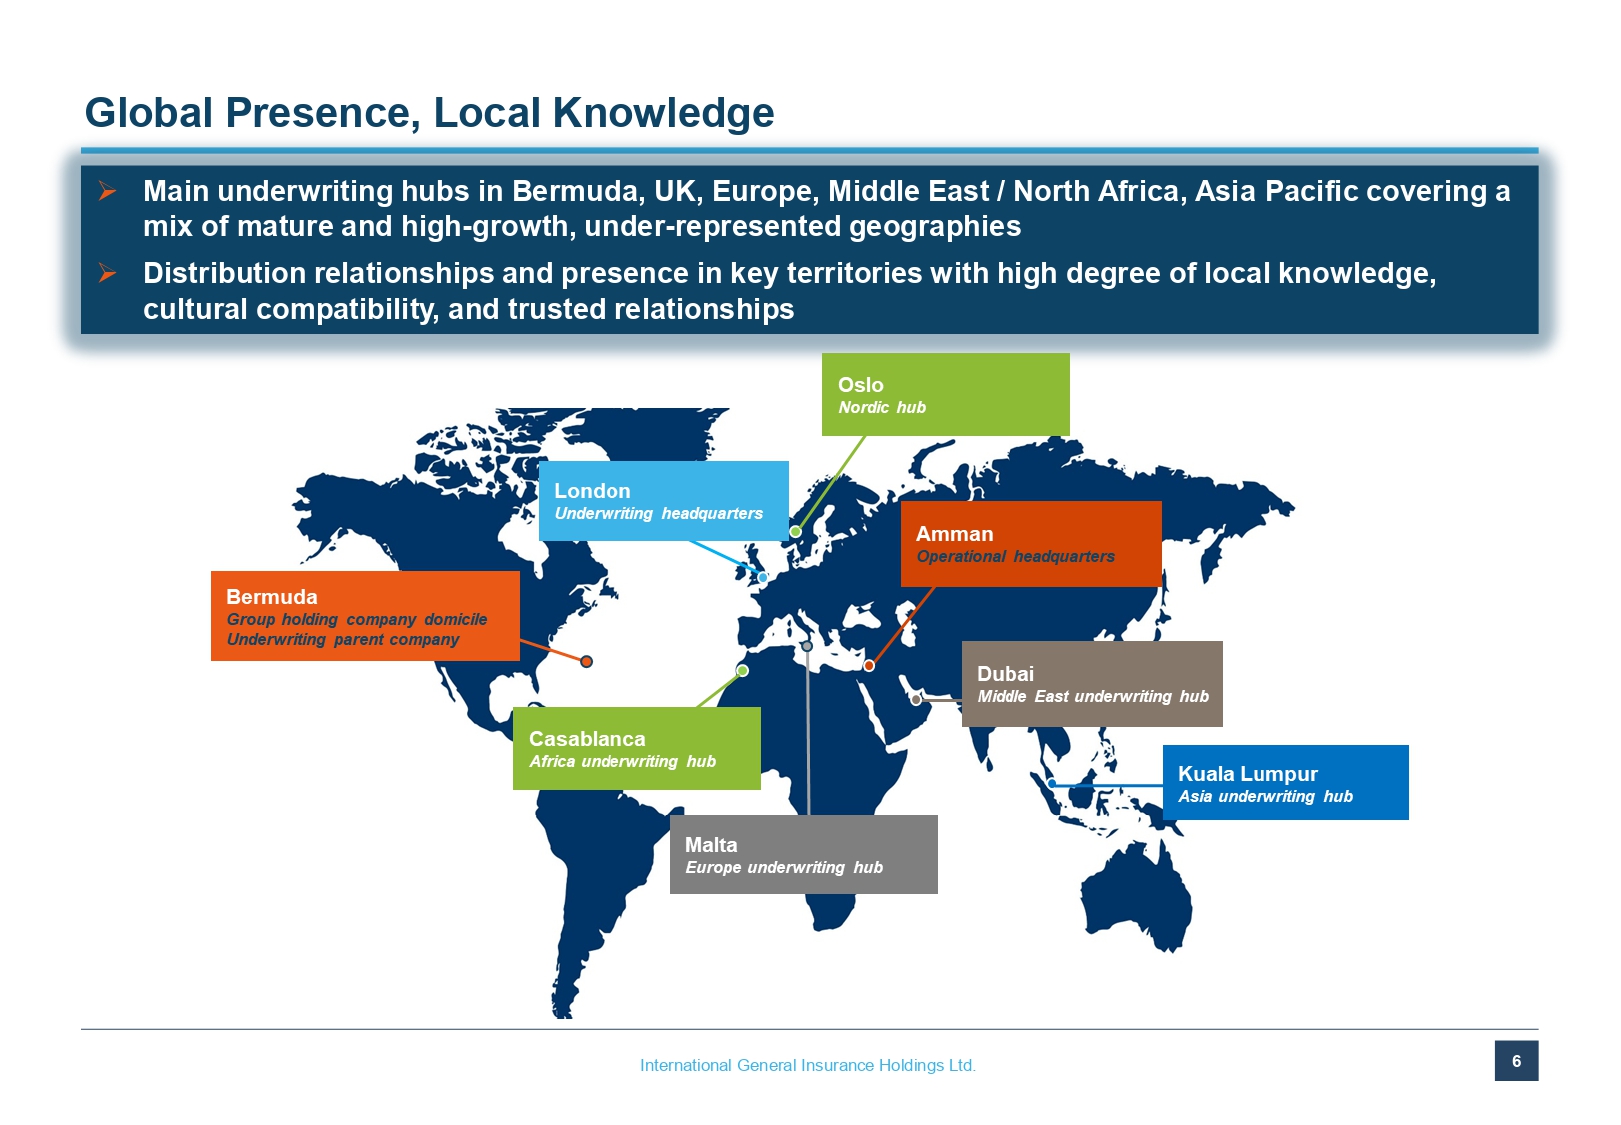
International General Insurance Holdings Ltd. 6 Global Presence, Local Knowledge » Main underwriting hubs in Bermuda, UK, Europe, Middle East / North Africa, Asia Pacific covering a mix of mature and high - growth, under - represented geographies » Distribution relationships and presence in key territories with high degree of local knowledge, cultural compatibility, and trusted relationships
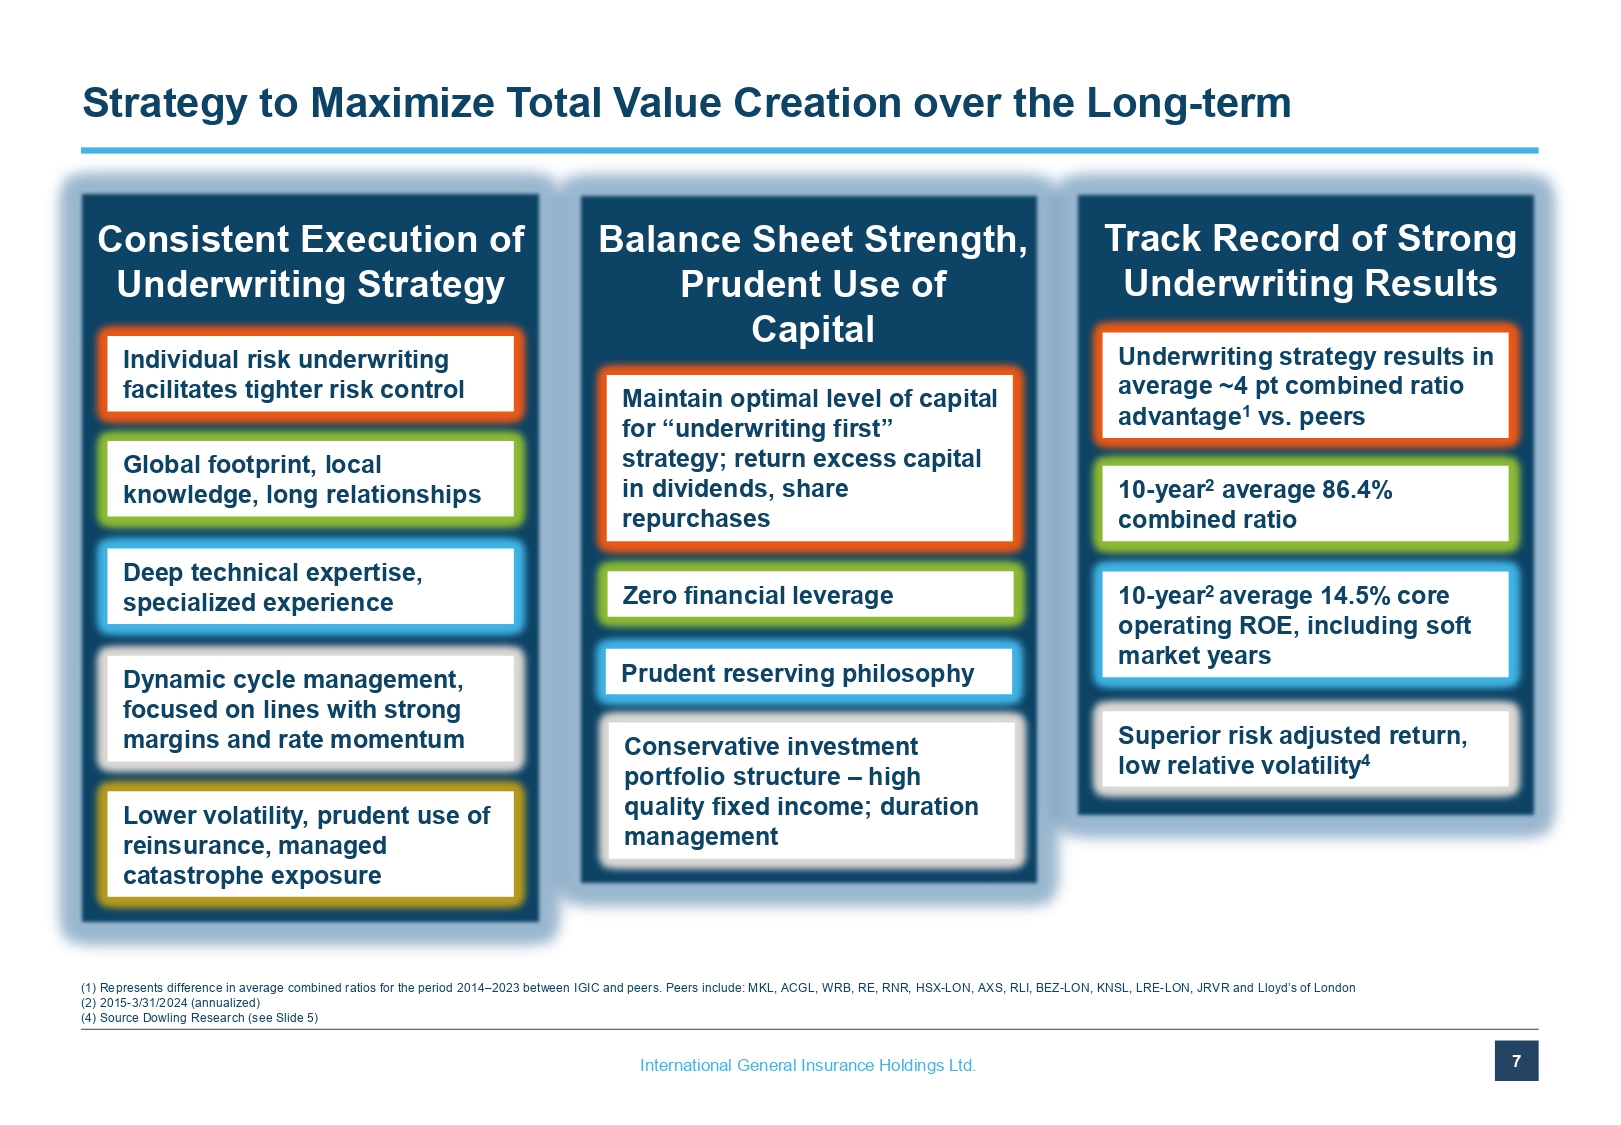
International General Insurance Holdings Ltd. 7 (1) Represents difference in average combined ratios for the period 2014 – 2023 between IGIC and peers. Peers include: MKL, ACGL, WRB, RE, RNR, HSX - LON, AXS, RLI, BEZ - LON, KNSL, LRE - LON, JRVR and Lloyd’s of London (2) 2015 - 3/31/2024 (annualized) (4) Source Dowling Research (see Slide 5) Strategy to Maximize Total Value Creation over the Long - term Track Record of Strong Underwriting Results Consistent Execution of Underwriting Strategy Balance Sheet Strength, Prudent Use of Capital Individual risk underwriting facilitates tighter risk control Global footprint, local knowledge, long relationships Deep technical expertise, specialized experience Dynamic cycle management, focused on lines with strong margins and rate momentum Lower volatility, prudent use of reinsurance, managed catastrophe exposure Maintain optimal level of capital for “underwriting first” strategy; return excess capital in dividends, share repurchases Prudent reserving philosophy Zero financial leverage Conservative investment portfolio structure – high quality fixed income; duration management Underwriting strategy results in average ~4 pt combined ratio advantage 1 vs. peers 10 - year 2 average 86.4% combined ratio 10 - year 2 average 14.5% core operating ROE, including soft market years Superior risk adjusted return, low relative volatility 4
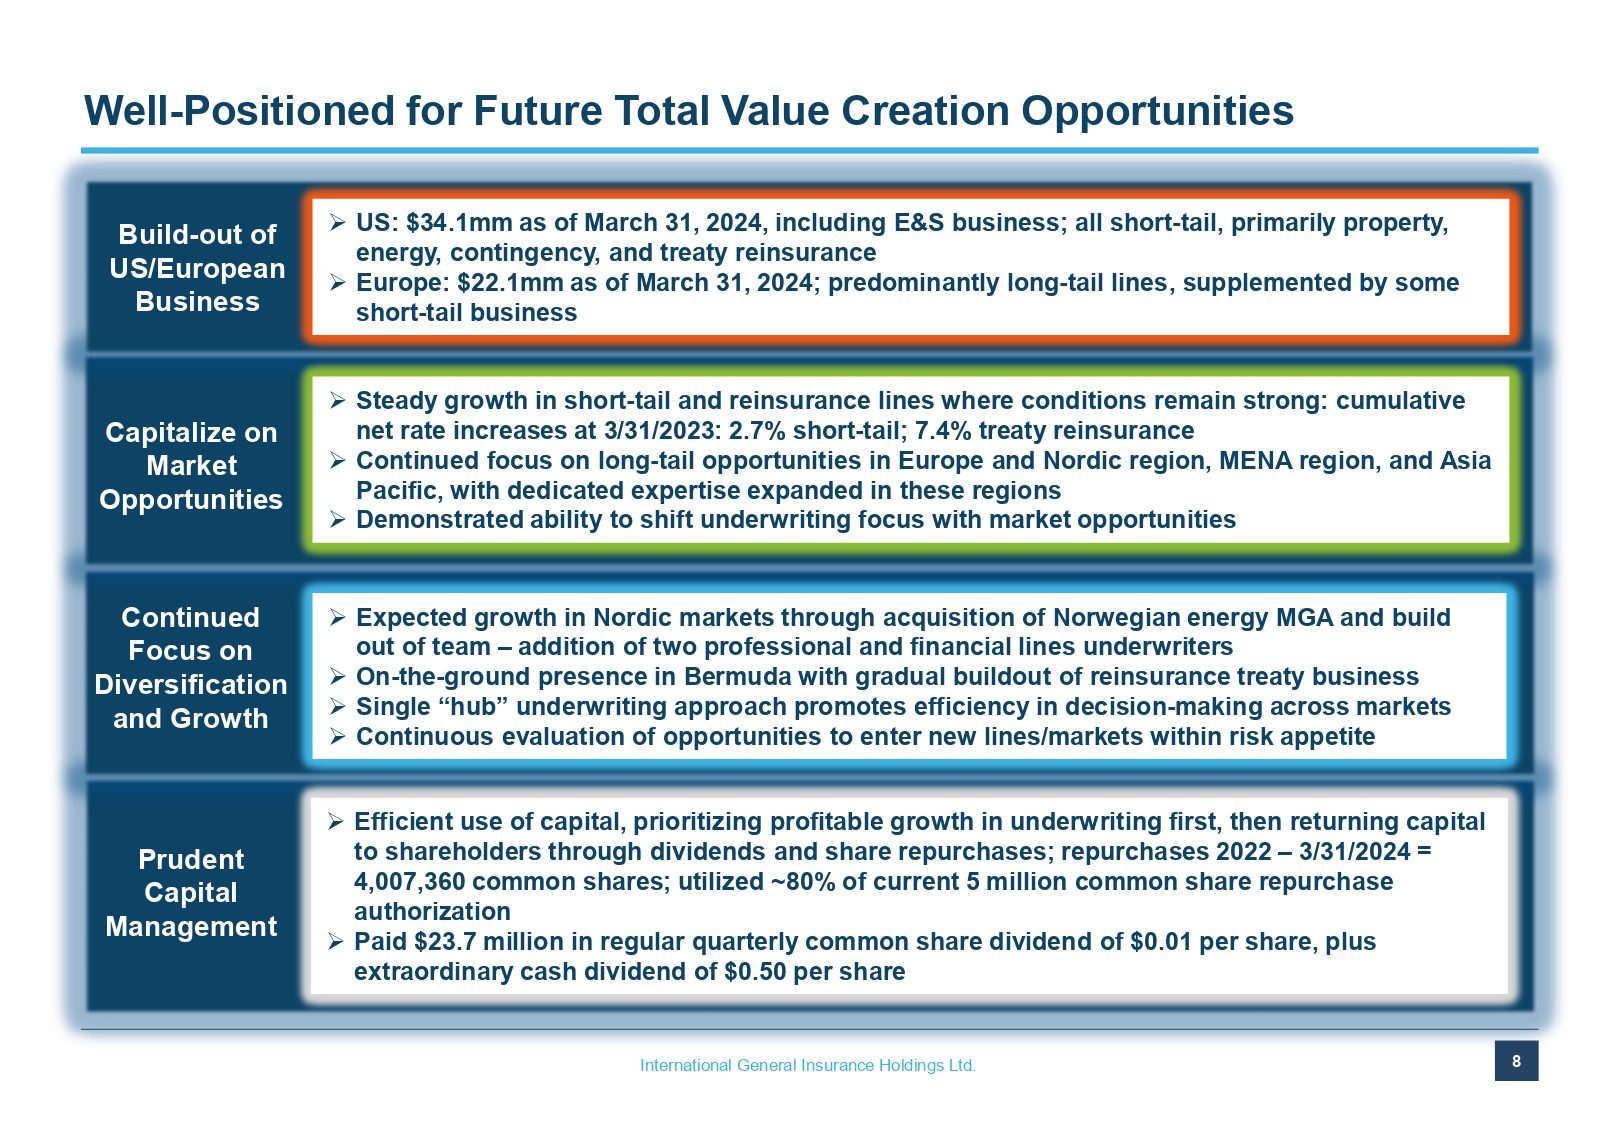
International General Insurance Holdings Ltd. 8 Well - Positioned for Future Total Value Creation Opportunities Build - out of US/European Business » US: $34.1mm as of March 31, 2024, including E&S business; all short - tail, primarily property, energy, contingency, and treaty reinsurance » Europe: $22.1mm as of March 31, 2024; predominantly long - tail lines, supplemented by some short - tail business » Steady growth in short - tail and reinsurance lines where conditions remain strong: cumulative net rate increases at 3/31/2023: 2.7% short - tail; 7.4% treaty reinsurance » Continued focus on long - tail opportunities in Europe and Nordic region, MENA region, and Asia Pacific, with dedicated expertise expanded in these regions » Demonstrated ability to shift underwriting focus with market opportunities Capitalize on Market Opportunities Continued Focus on Diversification and Growth » Expected growth in Nordic markets through acquisition of Norwegian energy MGA and build out of team – addition of two professional and financial lines underwriters » On - the - ground presence in Bermuda with gradual buildout of reinsurance treaty business » Single “hub” underwriting approach promotes efficiency in decision - making across markets » Continuous evaluation of opportunities to enter new lines/markets within risk appetite Prudent Capital Management » Efficient use of capital, prioritizing profitable growth in underwriting first, then returning capital to shareholders through dividends and share repurchases; repurchases 2022 – 3/31/2024 = 4,007,360 common shares; utilized ~80% of current 5 million common share repurchase authorization » Paid $23.7 million in regular quarterly common share dividend of $0.01 per share, plus extraordinary cash dividend of $0.50 per share
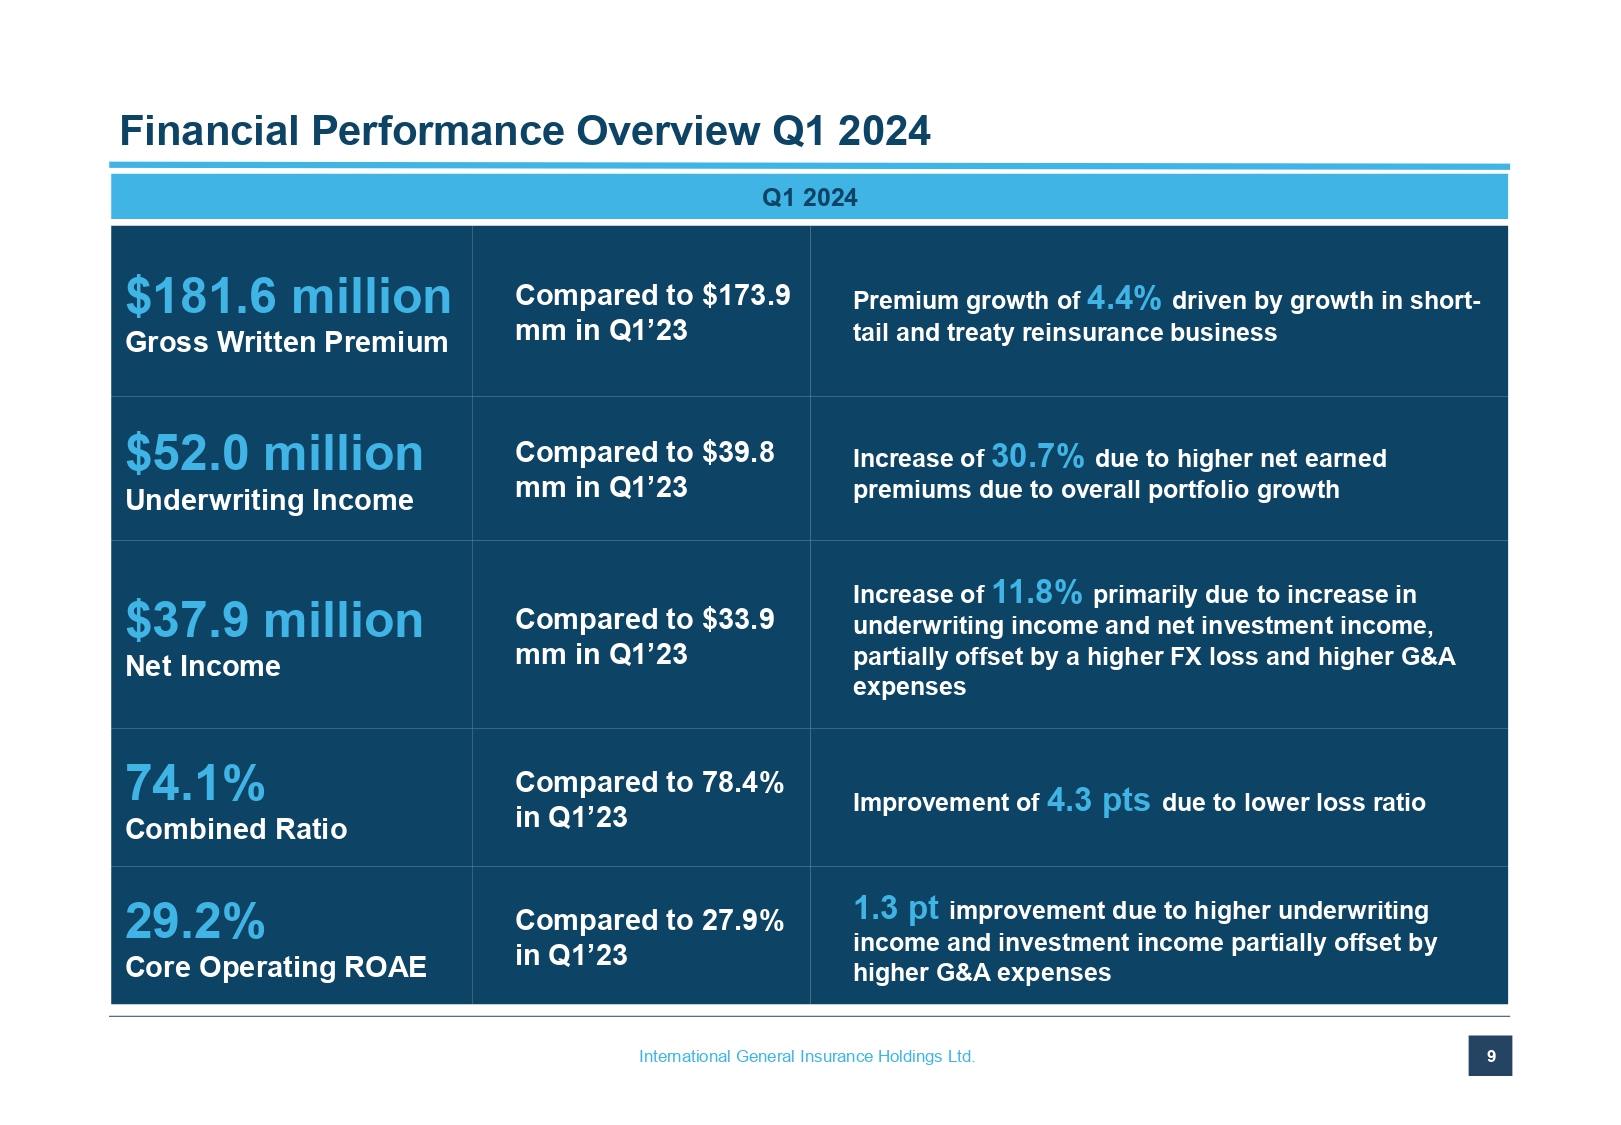
9 International General Insurance Holdings Ltd. Financial Performance Overview Q1 2024 Premium growth of 4.4 % driven by growth in short - tail and treaty reinsurance business Compared to $173.9 mm in Q1’23 $181.6 million Gross Written Premium Increase of 30.7% due to higher net earned premiums due to overall portfolio growth Compared to $39.8 mm in Q1’23 $52.0 million Underwriting Income Increase of 11.8% primarily due to increase in underwriting income and net investment income, partially offset by a higher FX loss and higher G&A expenses Compared to $33.9 mm in Q1’23 $37.9 million Net Income Improvement of 4.3 pts due to lower loss ratio Compared to 78.4% in Q1’23 74.1% Combined Ratio 1.3 pt improvement due to higher underwriting income and investment income partially offset by higher G&A expenses Compared to 27.9% in Q1’23 29.2% Core Operating ROAE Q1 2024
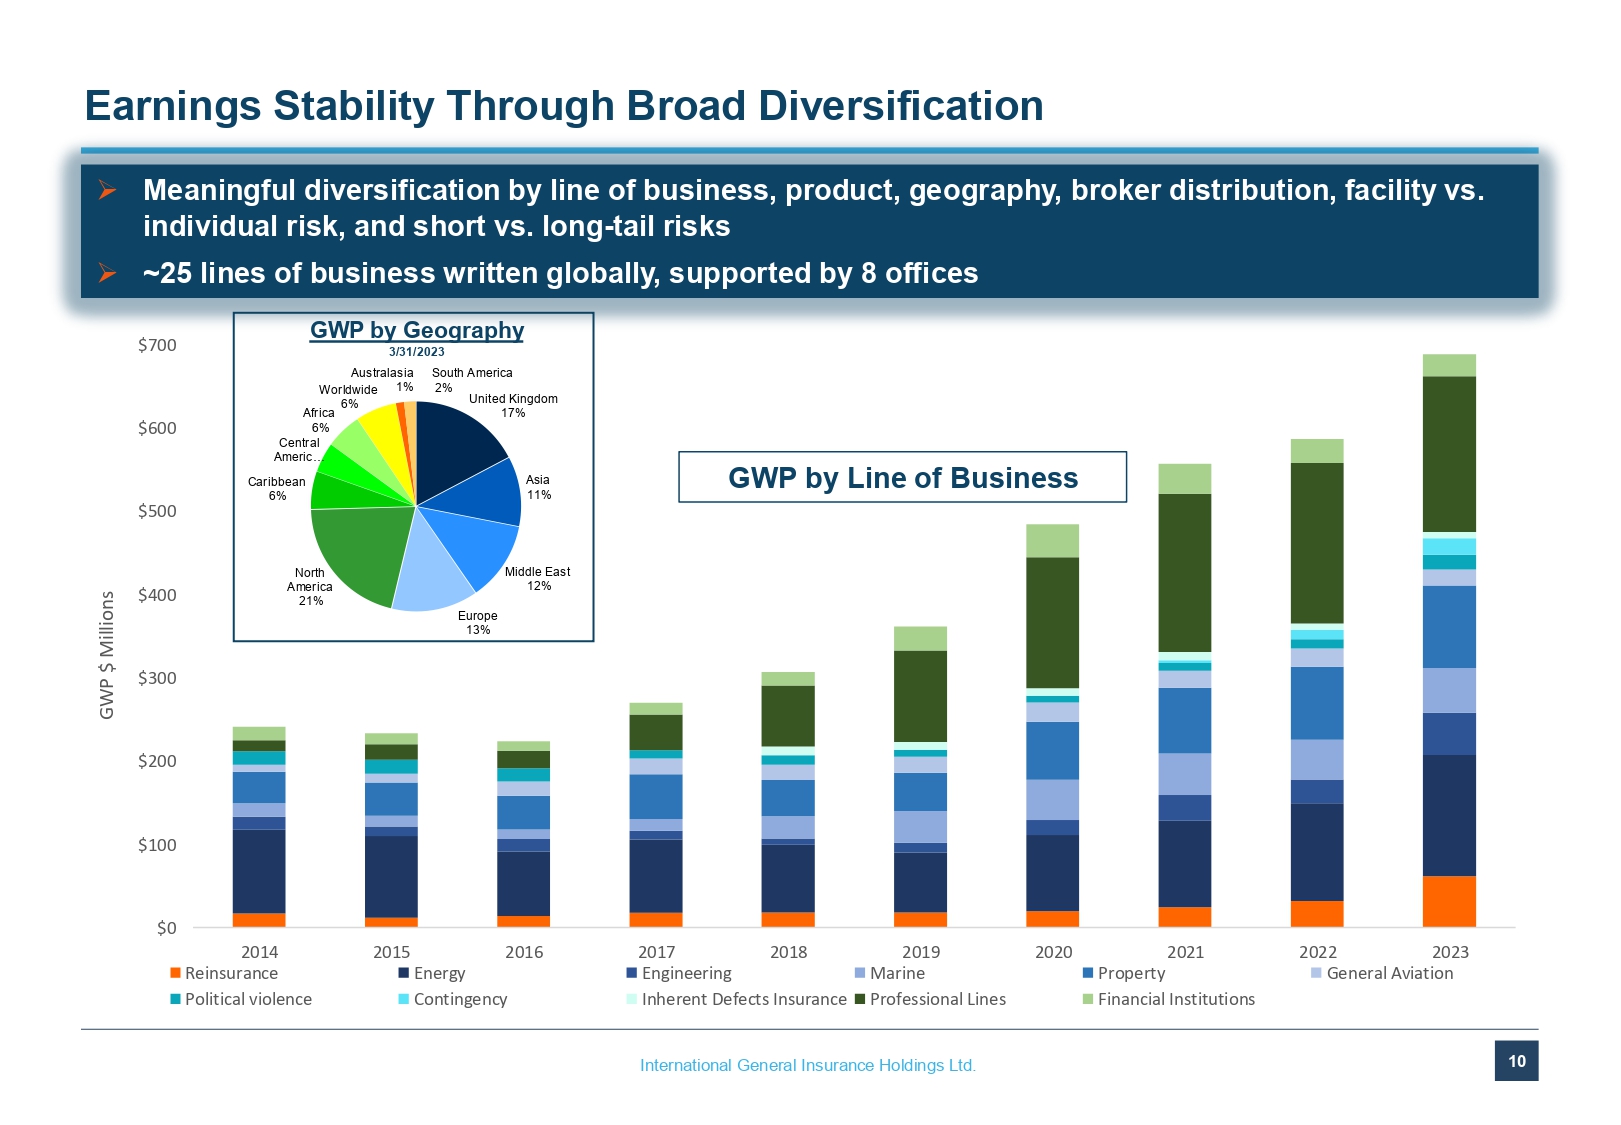
International General Insurance Holdings Ltd. 10 $0 $100 $200 $300 $400 $500 $600 $700 2014 2015 2016 2017 2018 2019 2020 2021 2022 2023 GWP $ Millions Reinsurance Energy Engineering Marine Property General Aviation Political violence Contingency Inherent Defects Insurance Professional Lines Financial Institutions Earnings Stability Through Broad Diversification » Meaningful diversification by line of business, product, geography, broker distribution, facility vs. individual risk, and short vs. long - tail risks » ~25 lines of business written globally, supported by 8 offices GWP by Geography 3/31/2023 GWP by Line of Business United Kingdom 17% Asia 11% Middle East 12% Europe 13% North America 21% Caribbean 6% Central Americ … Africa 6% Worldwide 6% Australasia 1% South America 2%
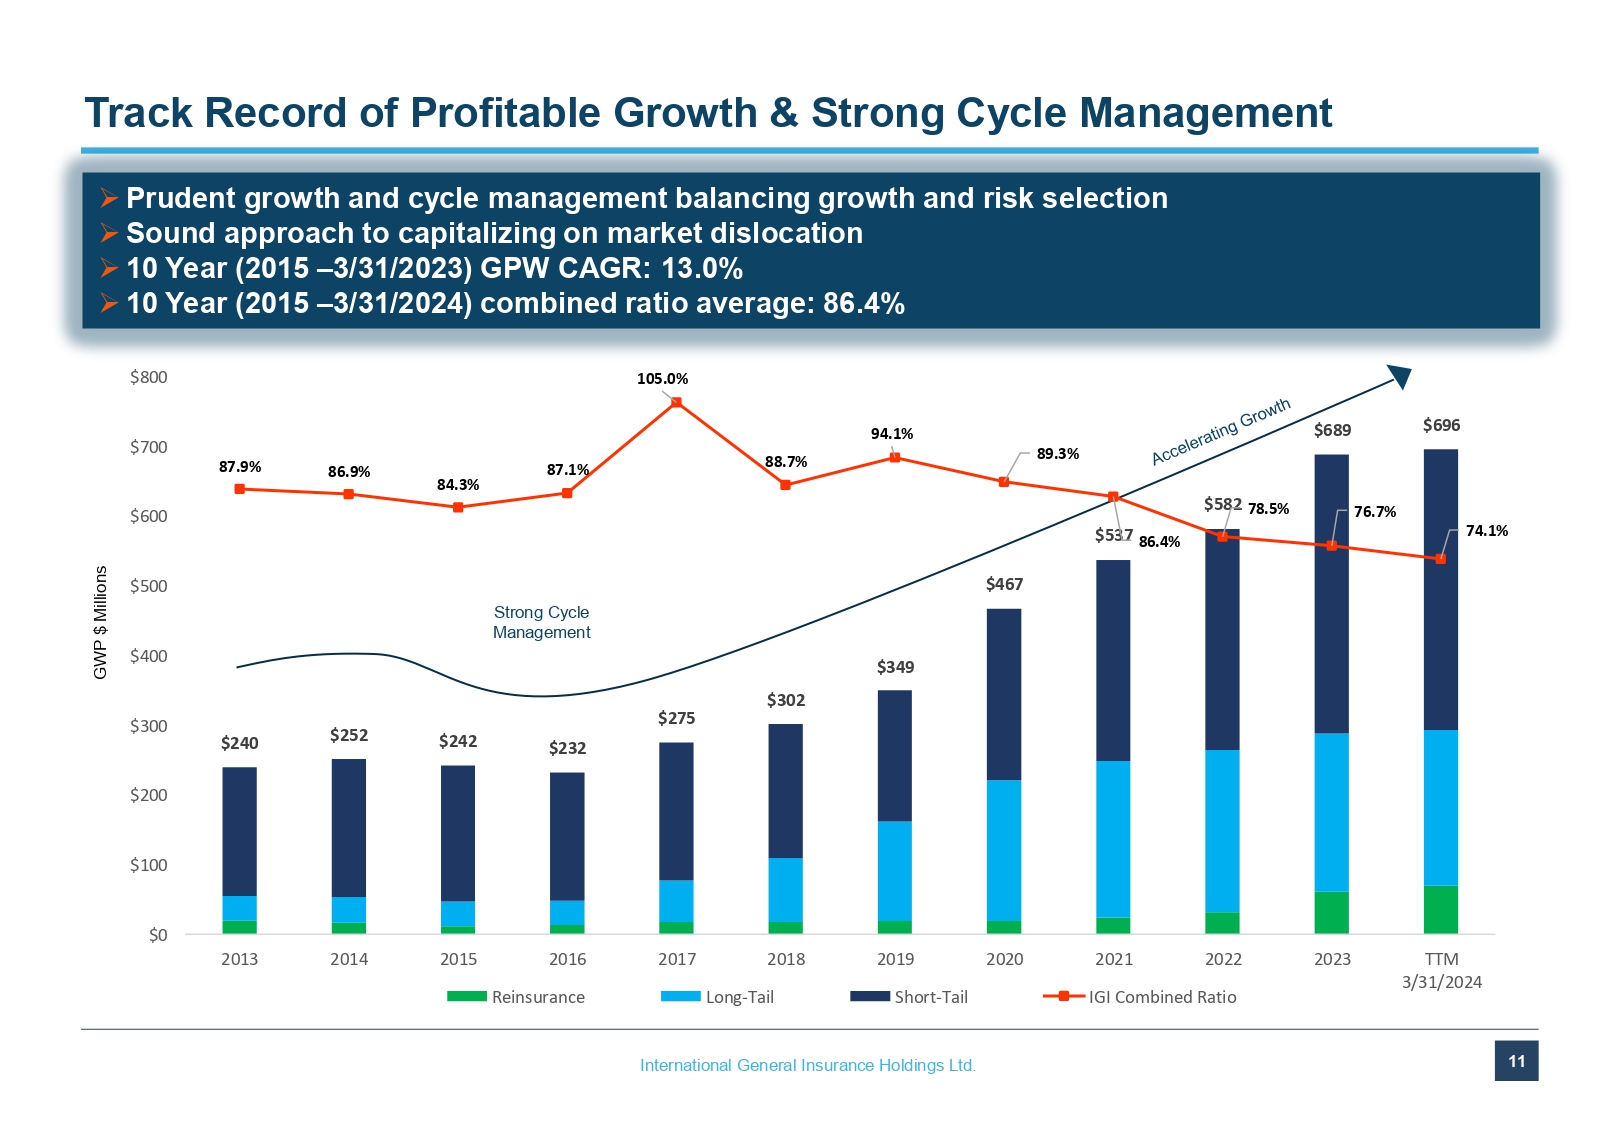
International General Insurance Holdings Ltd. 11 Track Record of Profitable Growth & Strong Cycle Management » Prudent growth and cycle management balancing growth and risk selection » Sound approach to capitalizing on market dislocation » 10 Year (2015 – 3/31/2023) GPW CAGR: 13.0% » 10 Year (2015 – 3/31/2024) combined ratio average: 86.4% Strong Cycle Management GWP $ Millions $240 $252 $242 $232 $275 $302 $349 $467 $537 $582 $689 $696 87.9% 86.9% 84.3% 87.1% 105.0% 88.7% 94.1% 89.3% 86.4% 78.5% 76.7% 74.1% $0 $100 $200 $300 $400 $500 $600 $700 $800 2013 2014 2015 2016 2017 2018 2019 2020 2021 2022 2023 TTM 3/31/2024 Reinsurance Long-Tail Short-Tail IGI Combined Ratio
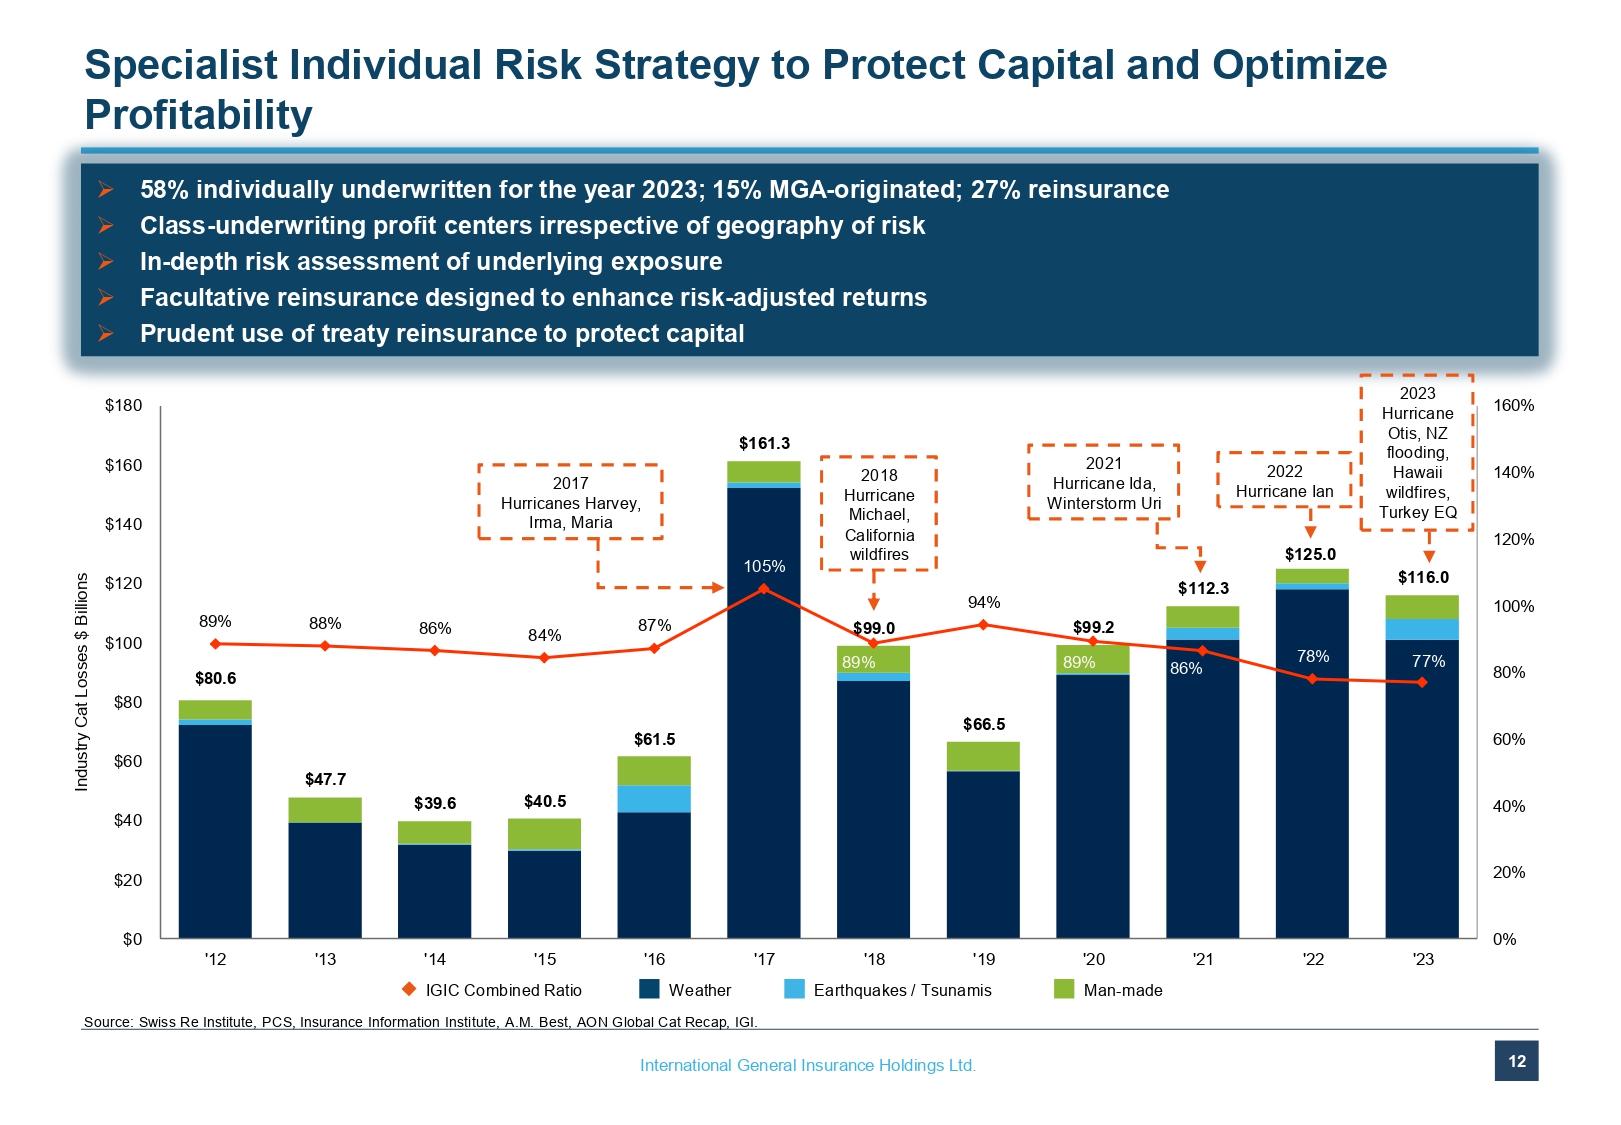
International General Insurance Holdings Ltd. 12 $80.6 $47.7 $39.6 $40.5 $61.5 $161.3 $99.0 $66.5 $99.2 $112.3 $125.0 $116.0 89% 88% 86% 84% 87% 105% 89% 94% 89% 86% 78% 0% 20% 40% 60% 80% 100% 120% 140% 160% $0 $20 $40 $60 $80 $100 $120 $140 $160 $180 '12 '13 '14 '15 '16 '17 '18 '19 '20 '21 '22 '23 Specialist Individual Risk Strategy to Protect Capital and Optimize Profitability » 58% individually underwritten for the year 2023; 15% MGA - originated; 27% reinsurance » Class - underwriting profit centers irrespective of geography of risk » In - depth risk assessment of underlying exposure » Facultative reinsurance designed to enhance risk - adjusted returns » Prudent use of treaty reinsurance to protect capital Source: Swiss Re Institute, PCS, Insurance Information Institute, A.M. Best, AON Global Cat Recap, IGI. 2023 Hurricane Otis, NZ flooding, Hawaii wildfires, Turkey EQ 2021 Hurricane Ida, Winterstorm Uri 2017 Hurricanes Harvey, Irma, Maria 2018 Hurricane Michael, California wildfires Weather Earthquakes / Tsunamis Man - made IGIC Combined Ratio Industry Cat Losses $ Billions 2022 Hurricane Ian 77%
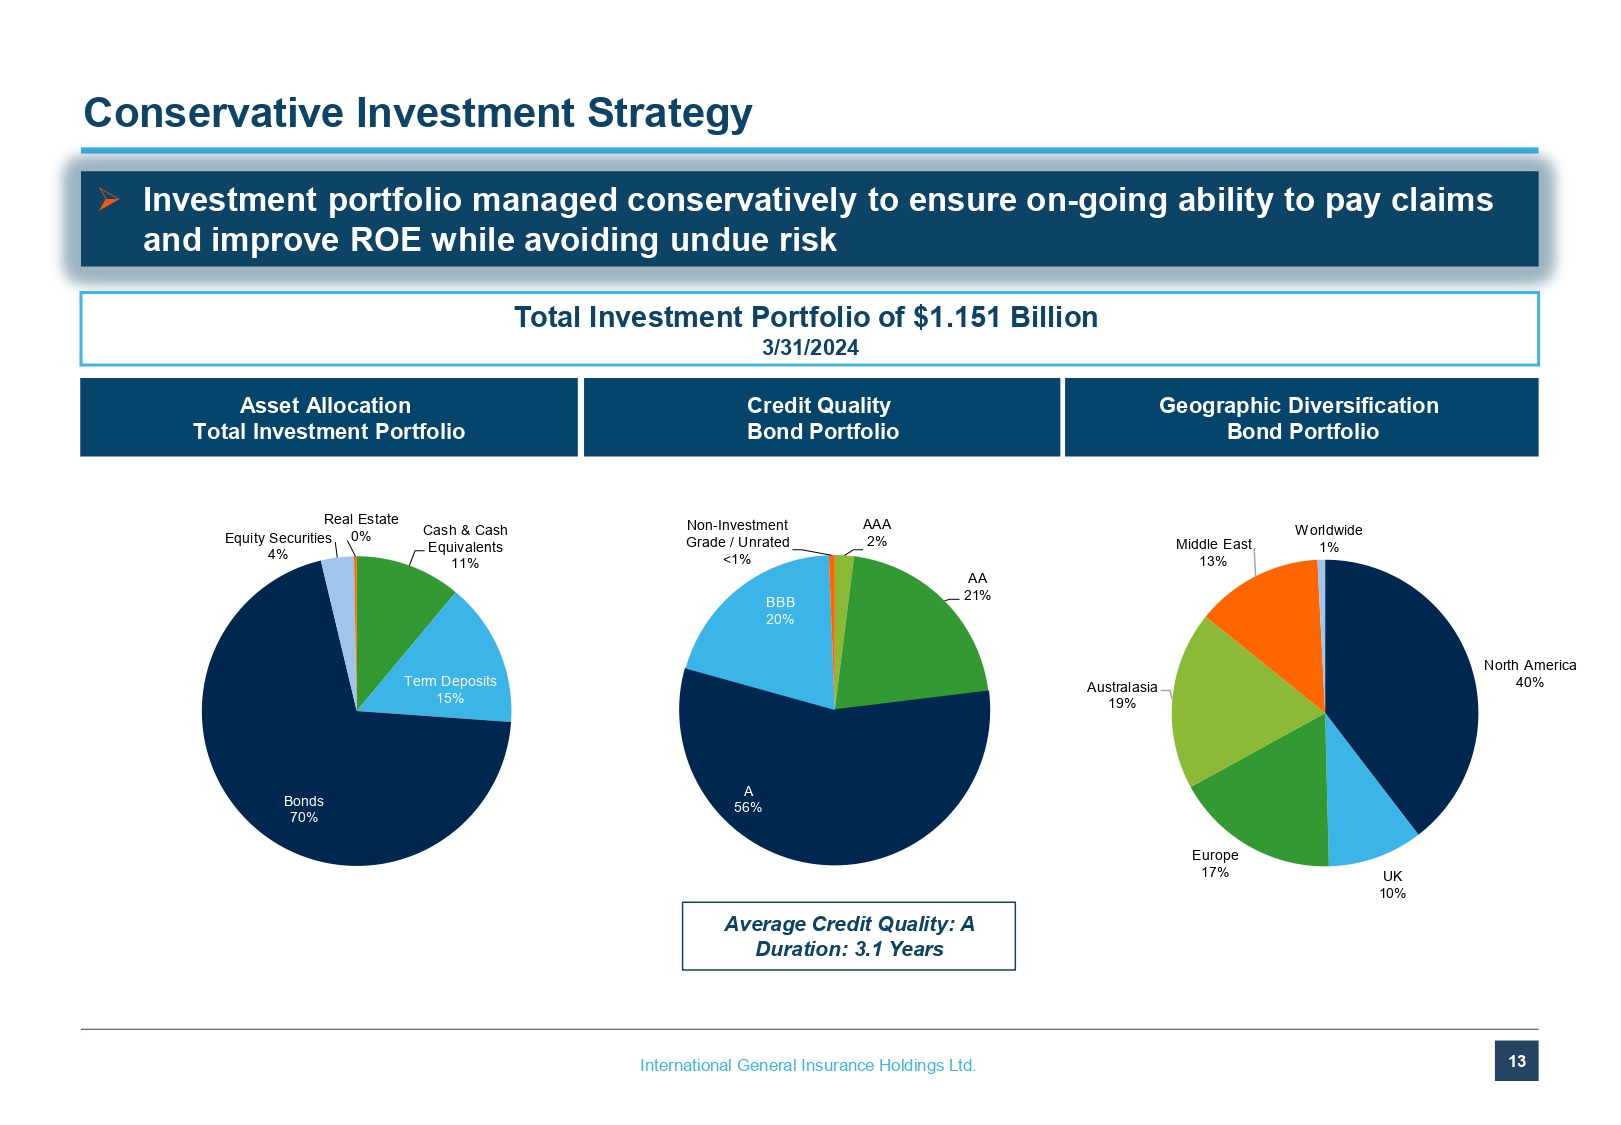
International General Insurance Holdings Ltd. 13 Asset Allocation Total Investment Portfolio Credit Quality Bond Portfolio Conservative Investment Strategy » Investment portfolio managed conservatively to ensure on - going ability to pay claims and improve ROE while avoiding undue risk Total Investment Portfolio of $1.151 Billion 3/31/2024 Average Credit Quality: A Duration: 3.1 Years Geographic Diversification Bond Portfolio Cash & Cash Equivalents 11% Term Deposits 15% Bonds 70% Equity Securities 4% Real Estate 0% AAA 2% AA 21% A 56% BBB 20% Non - Investment Grade / Unrated <1% North America 40% UK 10% Europe 17% Australasia 19% Middle East 13% Worldwide 1%
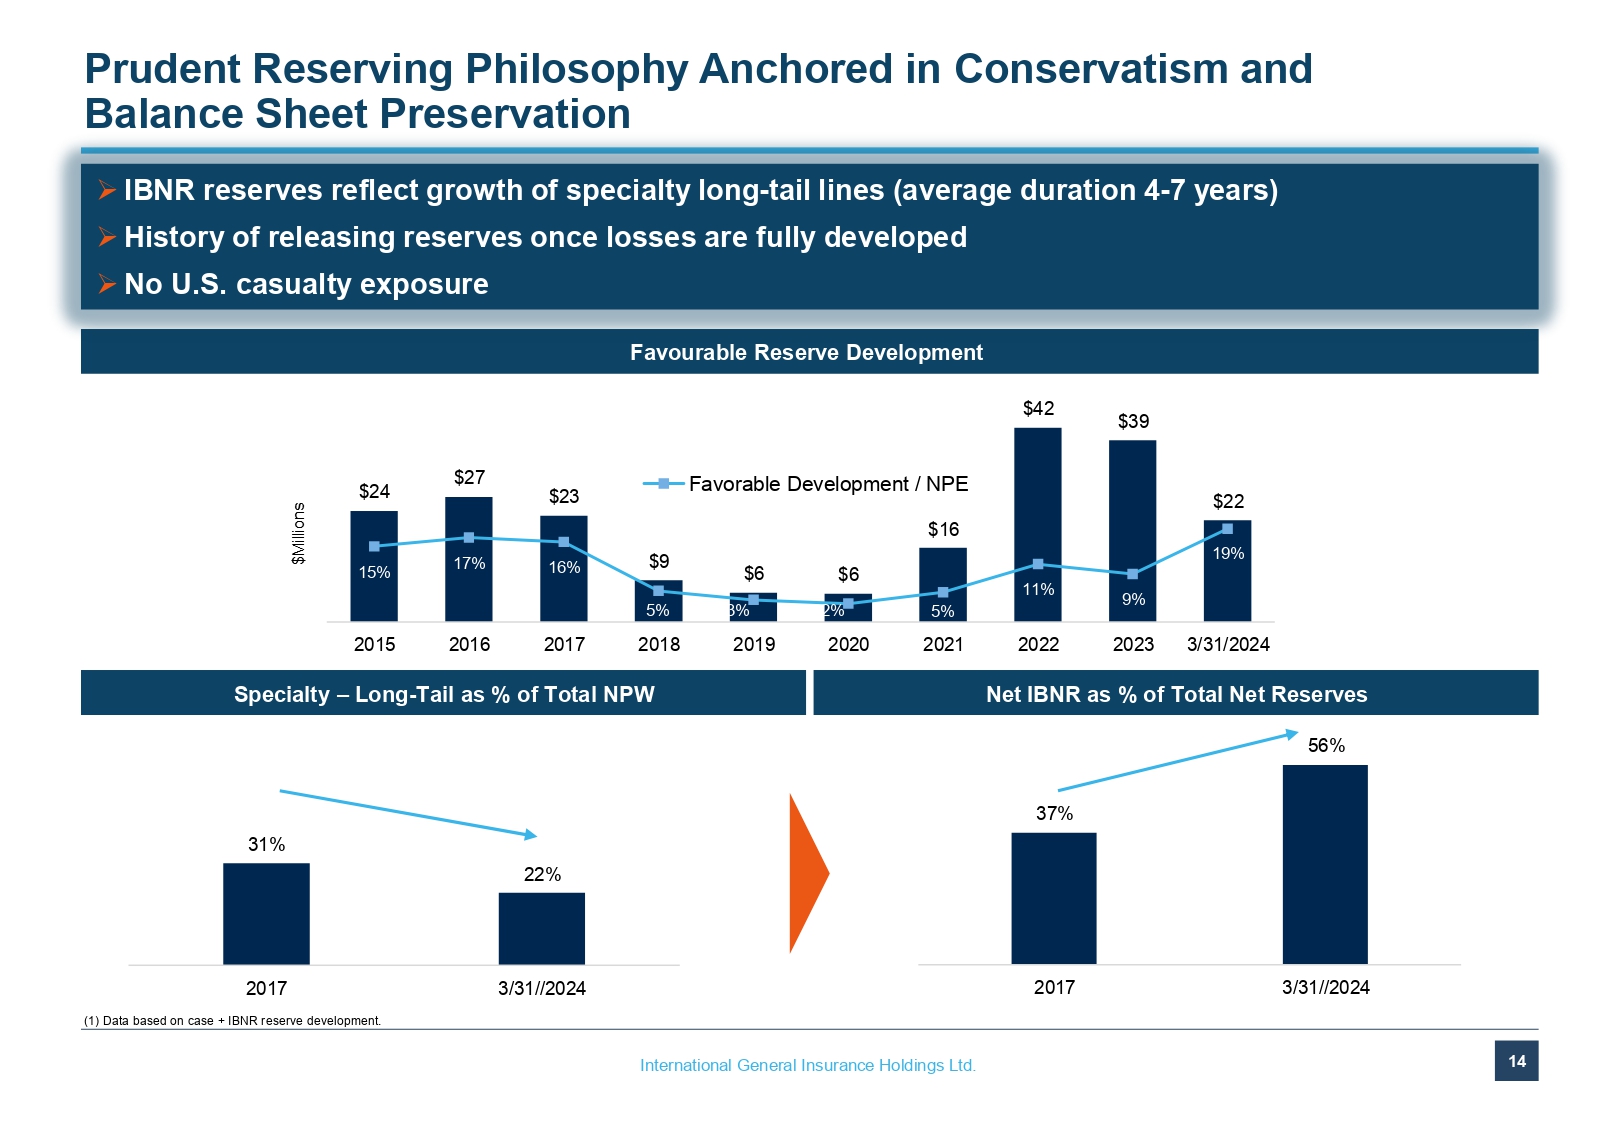
International General Insurance Holdings Ltd. 14 37% 56% 2017 3/31//2024 31% 22% 2017 3/31//2024 Net IBNR as % of Total Net Reserves Specialty – Long - Tail as % of Total NPW Favourable Reserve Development Prudent Reserving Philosophy Anchored in Conservatism and Balance Sheet Preservation (1) Data based on case + IBNR reserve development. » IBNR reserves reflect growth of specialty long - tail lines (average duration 4 - 7 years) » History of releasing reserves once losses are fully developed » No U.S. casualty exposure $24 $27 $23 $9 $6 $6 $16 $42 $39 $22 15% 17% 16% 5% 3% 2% 5% 11% 9% 19% 2015 2016 2017 2018 2019 2020 2021 2022 2023 3/31/2024 Favorable Development / NPE
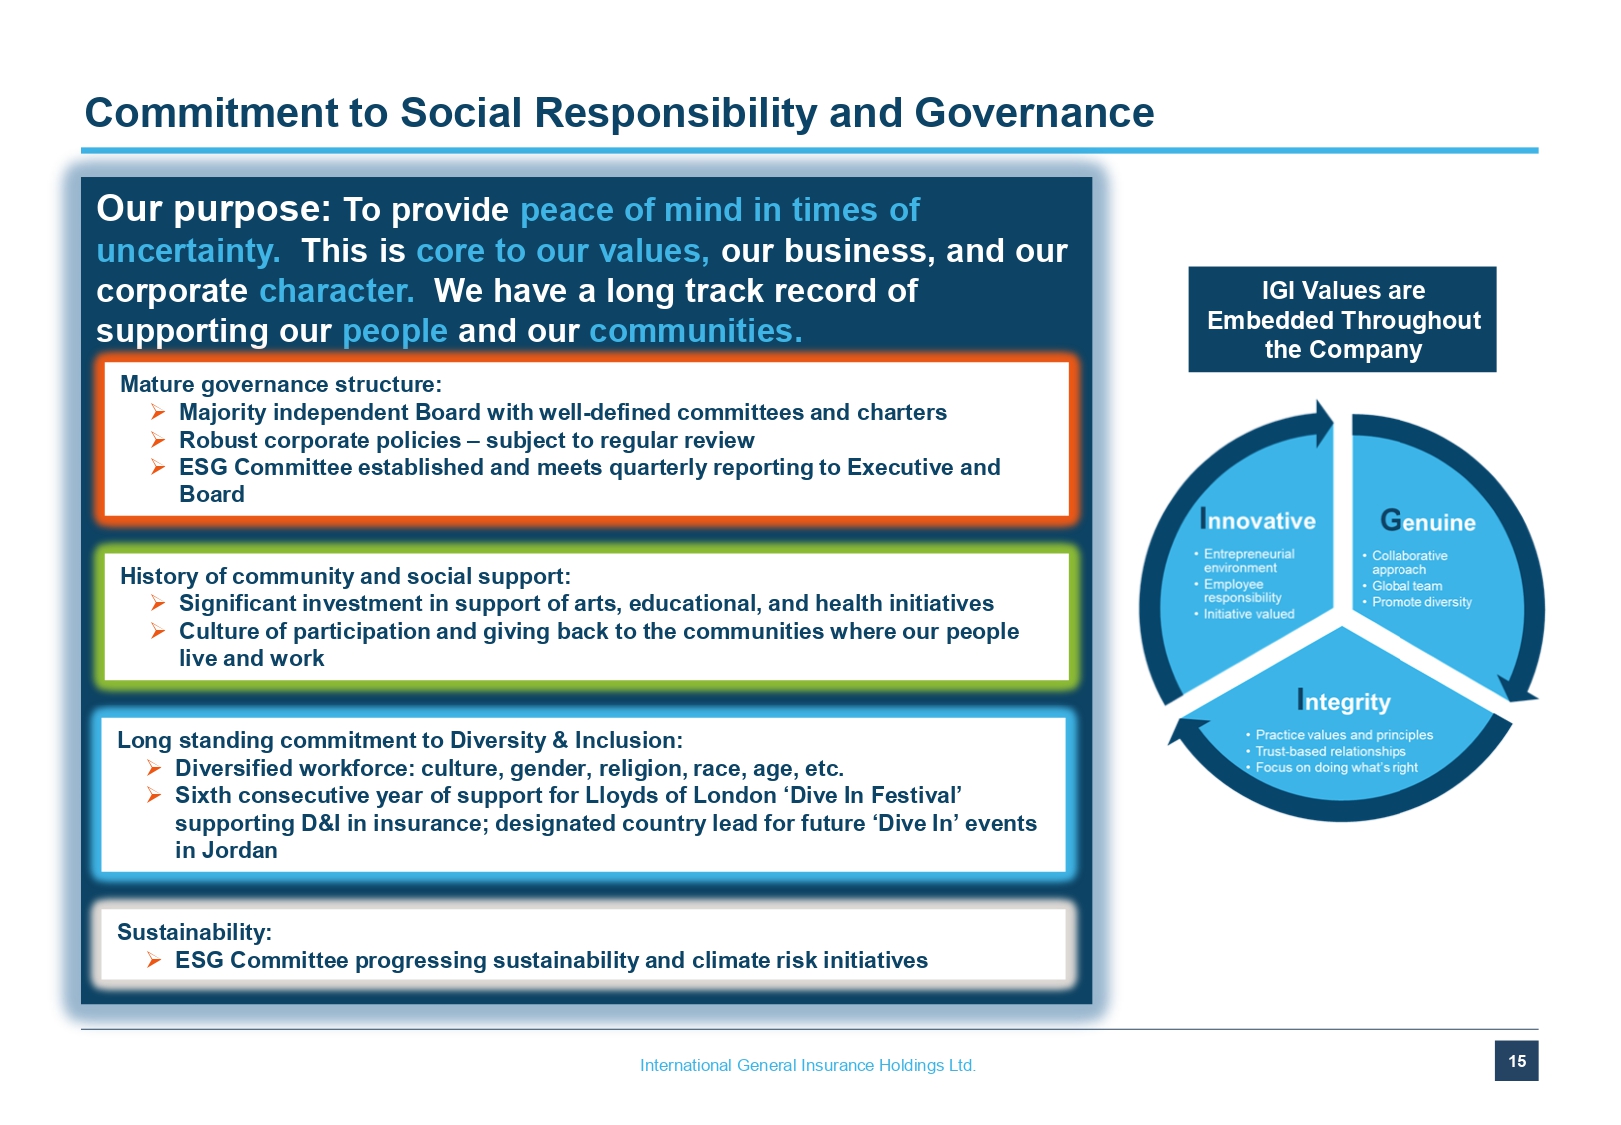
International General Insurance Holdings Ltd. 15 Commitment to Social Responsibility and Governance Our purpose: To provide peace of mind in times of uncertainty. . This is core to our values, our business, and our corporate character. . We have a long track record of supporting our people and our communities. IGI Values are Embedded Throughout the Company Mature governance structure: » Majority independent Board with well - defined committees and charters » Robust corporate policies – subject to regular review » ESG Committee established and meets quarterly reporting to Executive and Board History of community and social support: » Significant investment in support of arts, educational, and health initiatives » Culture of participation and giving back to the communities where our people live and work Long standing commitment to Diversity & Inclusion: » Diversified workforce: culture, gender, religion, race, age, etc. » Sixth consecutive year of support for Lloyds of London ‘Dive In Festival’ supporting D&I in insurance; designated country lead for future ‘Dive In’ events in Jordan Sustainability: » ESG Committee progressing sustainability and climate risk initiatives
Appendix
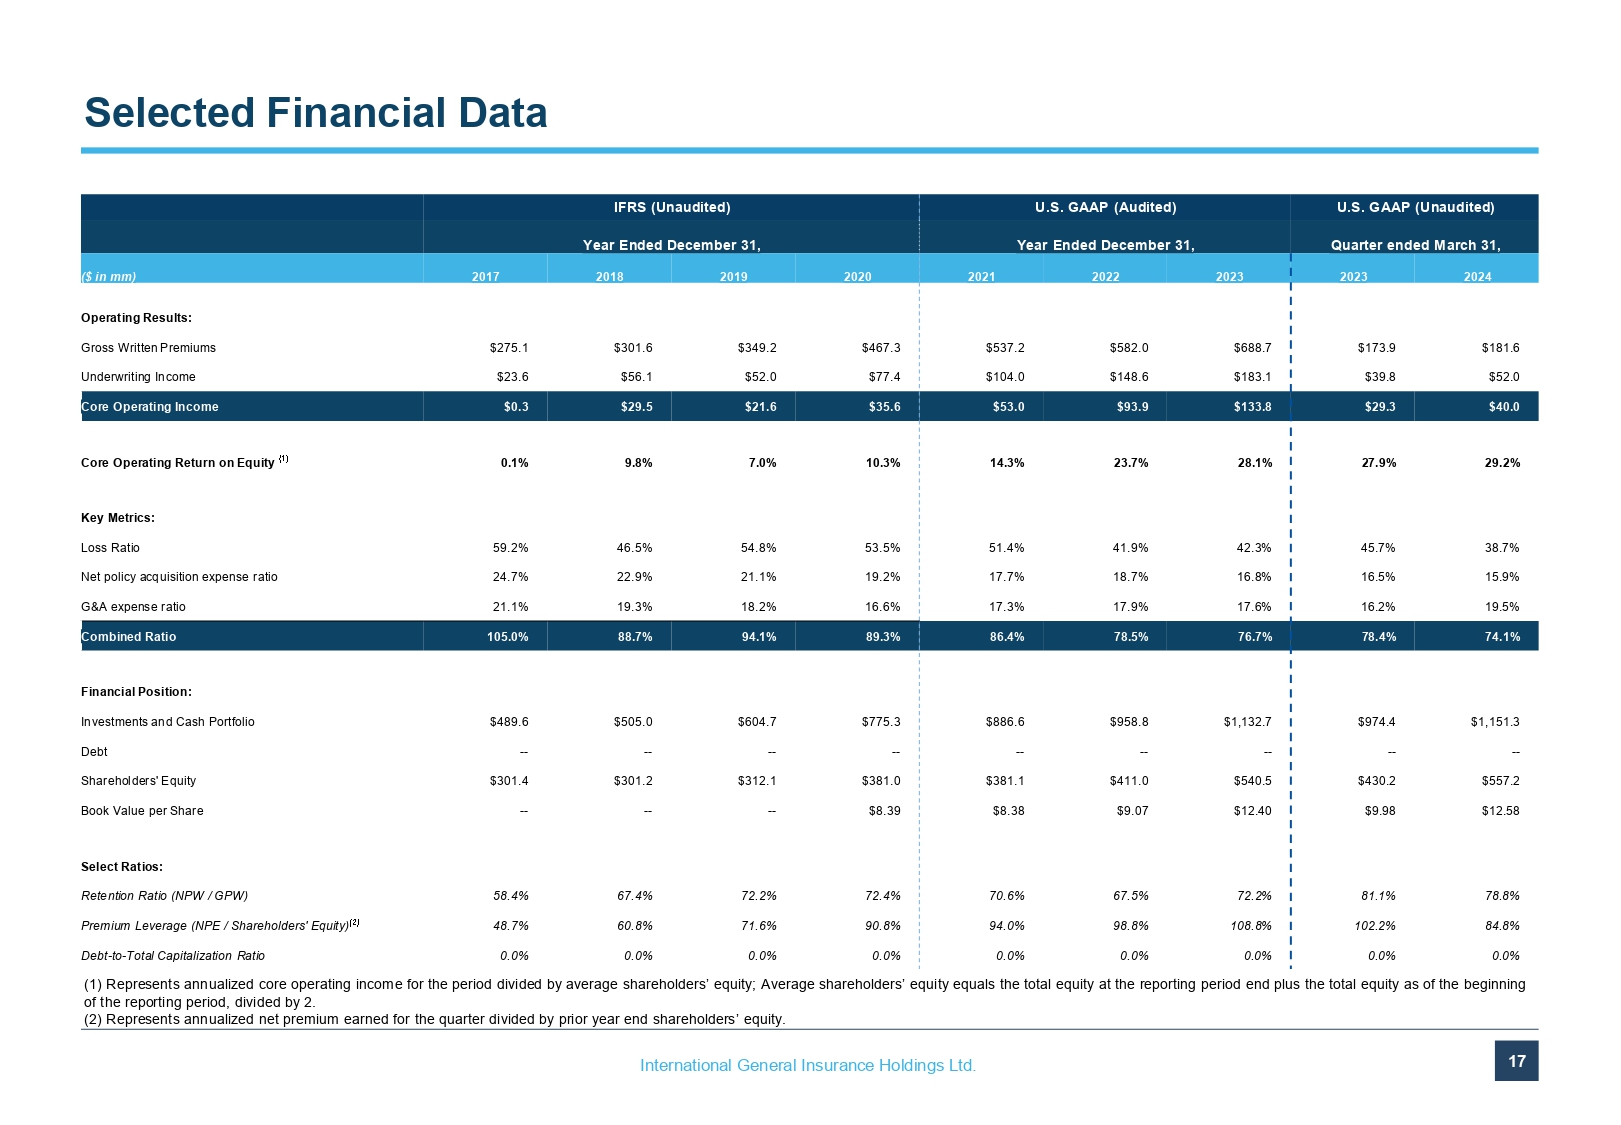
International General Insurance Holdings Ltd. 17 Selected Financial Data (1) Represents annualized core operating income for the period divided by average shareholders’ equity; Average shareholders’ eq uity equals the total equity at the reporting period end plus the total equity as of the beginning of the reporting period, divided by 2. (2) Represents annualized net premium earned for the quarter divided by prior year end shareholders’ equity. U.S. GAAP (Unaudited) U.S. GAAP (Audited) IFRS (Unaudited) Quarter ended March 31, Year Ended December 31, Year Ended December 31, 2024 2023 2023 2022 2021 2020 2019 2018 2017 ($ in mm) Operating Results: $181.6 $173.9 $688.7 $582.0 $537.2 $467.3 $349.2 $301.6 $275.1 Gross Written Premiums $52.0 $39.8 $183.1 $148.6 $104.0 $77.4 $52.0 $56.1 $23.6 Underwriting Income $40.0 $29.3 $133.8 $93.9 $53.0 $35.6 $21.6 $29.5 $0.3 Core Operating Income 29.2% 27.9% 28.1% 23.7% 14.3% 10.3% 7.0% 9.8% 0.1% Core Operating Return on Equity (1) Key Metrics: 38.7% 45.7% 42.3% 41.9% 51.4% 53.5% 54.8% 46.5% 59.2% Loss Ratio 15.9% 16.5% 16.8% 18.7% 17.7% 19.2% 21.1% 22.9% 24.7% Net policy acquisition expense ratio 19.5% 16.2% 17.6% 17.9% 17.3% 16.6% 18.2% 19.3% 21.1% G&A expense ratio 74.1% 78.4% 76.7% 78.5% 86.4% 89.3% 94.1% 88.7% 105.0% Combined Ratio Financial Position: $1,151.3 $974.4 $1,132.7 $958.8 $886.6 $775.3 $604.7 $505.0 $489.6 Investments and Cash Portfolio -- -- -- -- -- -- -- -- -- Debt $557.2 $430.2 $540.5 $411.0 $381.1 $381.0 $312.1 $301.2 $301.4 Shareholders' Equity $12.58 $9.98 $12.40 $9.07 $8.38 $8.39 -- -- -- Book Value per Share Select Ratios: 78.8% 81.1% 72.2% 67.5% 70.6% 72.4% 72.2% 67.4% 58.4% Retention Ratio (NPW / GPW) 84.8% 102.2% 108.8% 98.8% 94.0% 90.8% 71.6% 60.8% 48.7% Premium Leverage (NPE / Shareholders' Equity) (2) 0.0% 0.0% 0.0% 0.0% 0.0% 0.0% 0.0% 0.0% 0.0% Debt - to - Total Capitalization Ratio
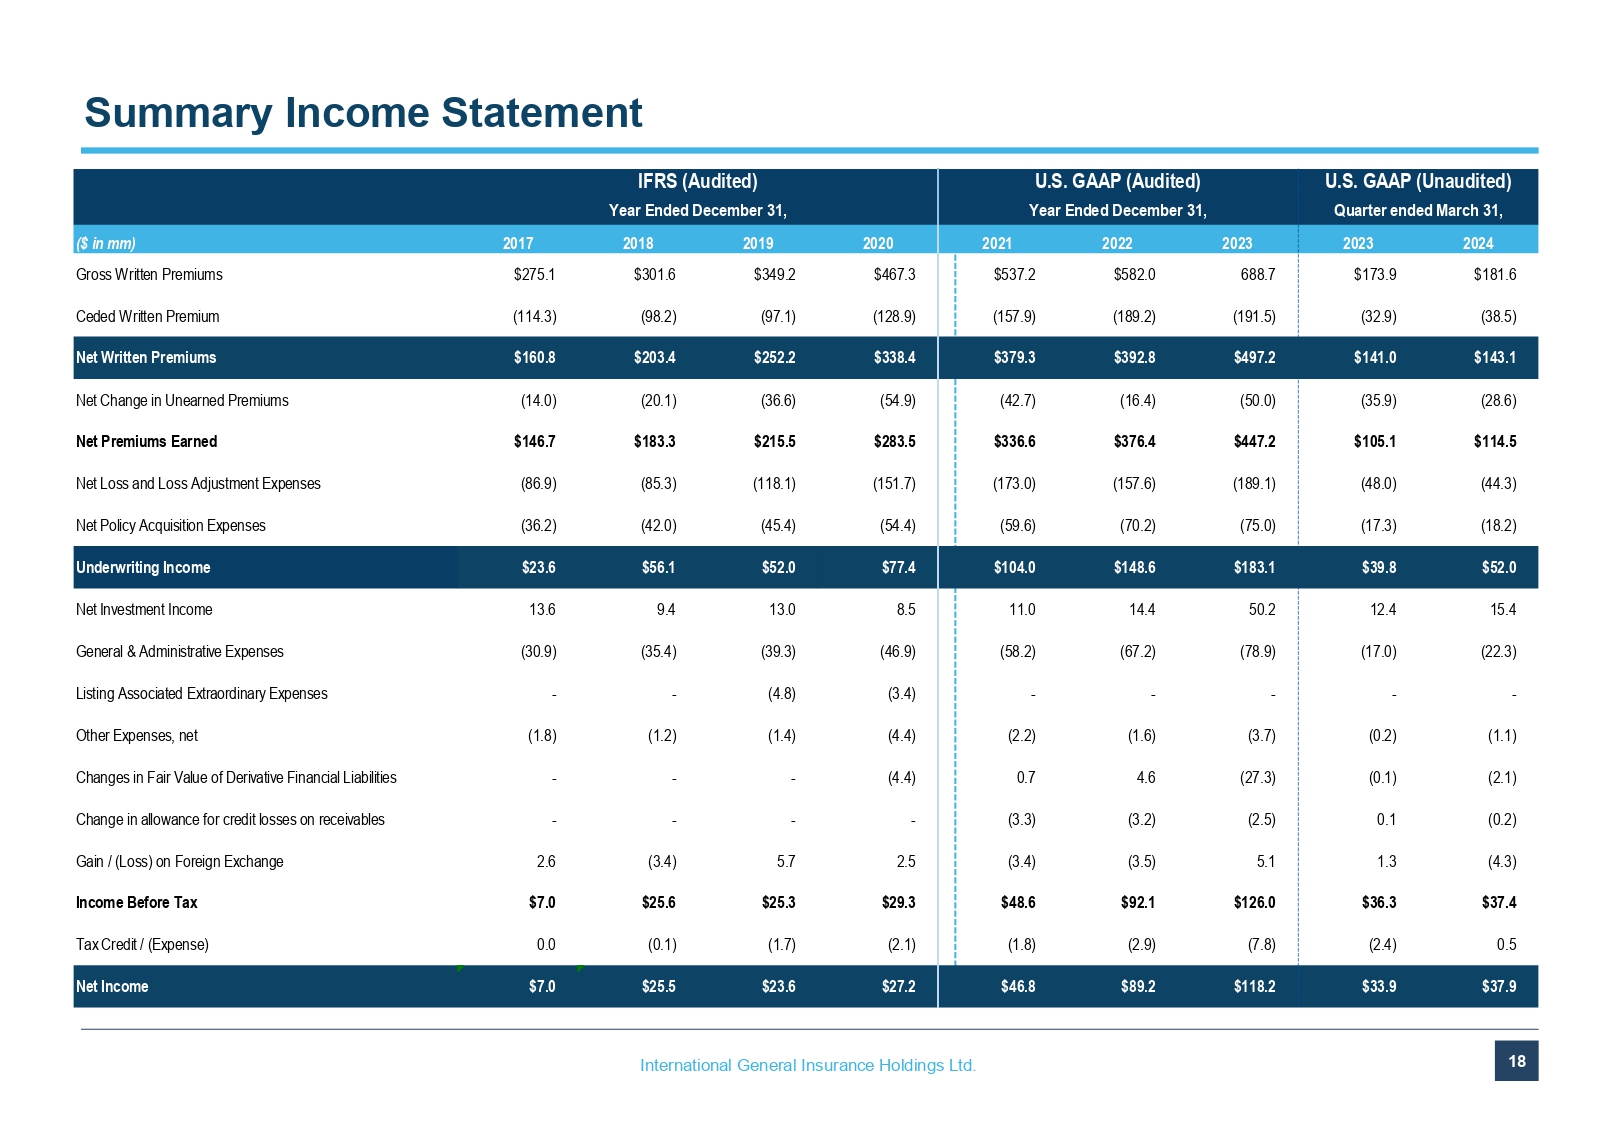
International General Insurance Holdings Ltd. 18 Quarter ended March 31, ($ in mm) 2017 2018 2019 2020 2021 2022 2023 2023 2024 Gross Written Premiums $275.1 $301.6 $349.2 $467.3 $537.2 $582.0 688.7 $173.9 $181.6 Ceded Written Premium (114.3) (98.2) (97.1) (128.9) (157.9) (189.2) (191.5) (32.9) (38.5) Net Written Premiums $160.8 $203.4 $252.2 $338.4 $379.3 $392.8 $497.2 $141.0 $143.1 Net Change in Unearned Premiums (14.0) (20.1) (36.6) (54.9) (42.7) (16.4) (50.0) (35.9) (28.6) Net Premiums Earned $146.7 $183.3 $215.5 $283.5 $336.6 $376.4 $447.2 $105.1 $114.5 Net Loss and Loss Adjustment Expenses (86.9) (85.3) (118.1) (151.7) (173.0) (157.6) (189.1) (48.0) (44.3) Net Policy Acquisition Expenses (36.2) (42.0) (45.4) (54.4) (59.6) (70.2) (75.0) (17.3) (18.2) Underwriting Income $23.6 $56.1 $52.0 $77.4 $104.0 $148.6 $183.1 $39.8 $52.0 Net Investment Income 13.6 9.4 13.0 8.5 11.0 14.4 50.2 12.4 15.4 General & Administrative Expenses (30.9) (35.4) (39.3) (46.9) (58.2) (67.2) (78.9) (17.0) (22.3) Listing Associated Extraordinary Expenses - - (4.8) (3.4) - - - - - Other Expenses, net (1.8) (1.2) (1.4) (4.4) (2.2) (1.6) (3.7) (0.2) (1.1) Changes in Fair Value of Derivative Financial Liabilities - - - (4.4) 0.7 4.6 (27.3) (0.1) (2.1) Change in allowance for credit losses on receivables - - - - (3.3) (3.2) (2.5) 0.1 (0.2) Gain / (Loss) on Foreign Exchange 2.6 (3.4) 5.7 2.5 (3.4) (3.5) 5.1 1.3 (4.3) Income Before Tax $7.0 $25.6 $25.3 $29.3 $48.6 $92.1 $126.0 $36.3 $37.4 Tax Credit / (Expense) 0.0 (0.1) (1.7) (2.1) (1.8) (2.9) (7.8) (2.4) 0.5 Net Income $7.0 $25.5 $23.6 $27.2 $46.8 $89.2 $118.2 $33.9 $37.9 IFRS (Audited) U.S. GAAP (Audited) U.S. GAAP (Unaudited) Year Ended December 31, Year Ended December 31, Summary Income Statement
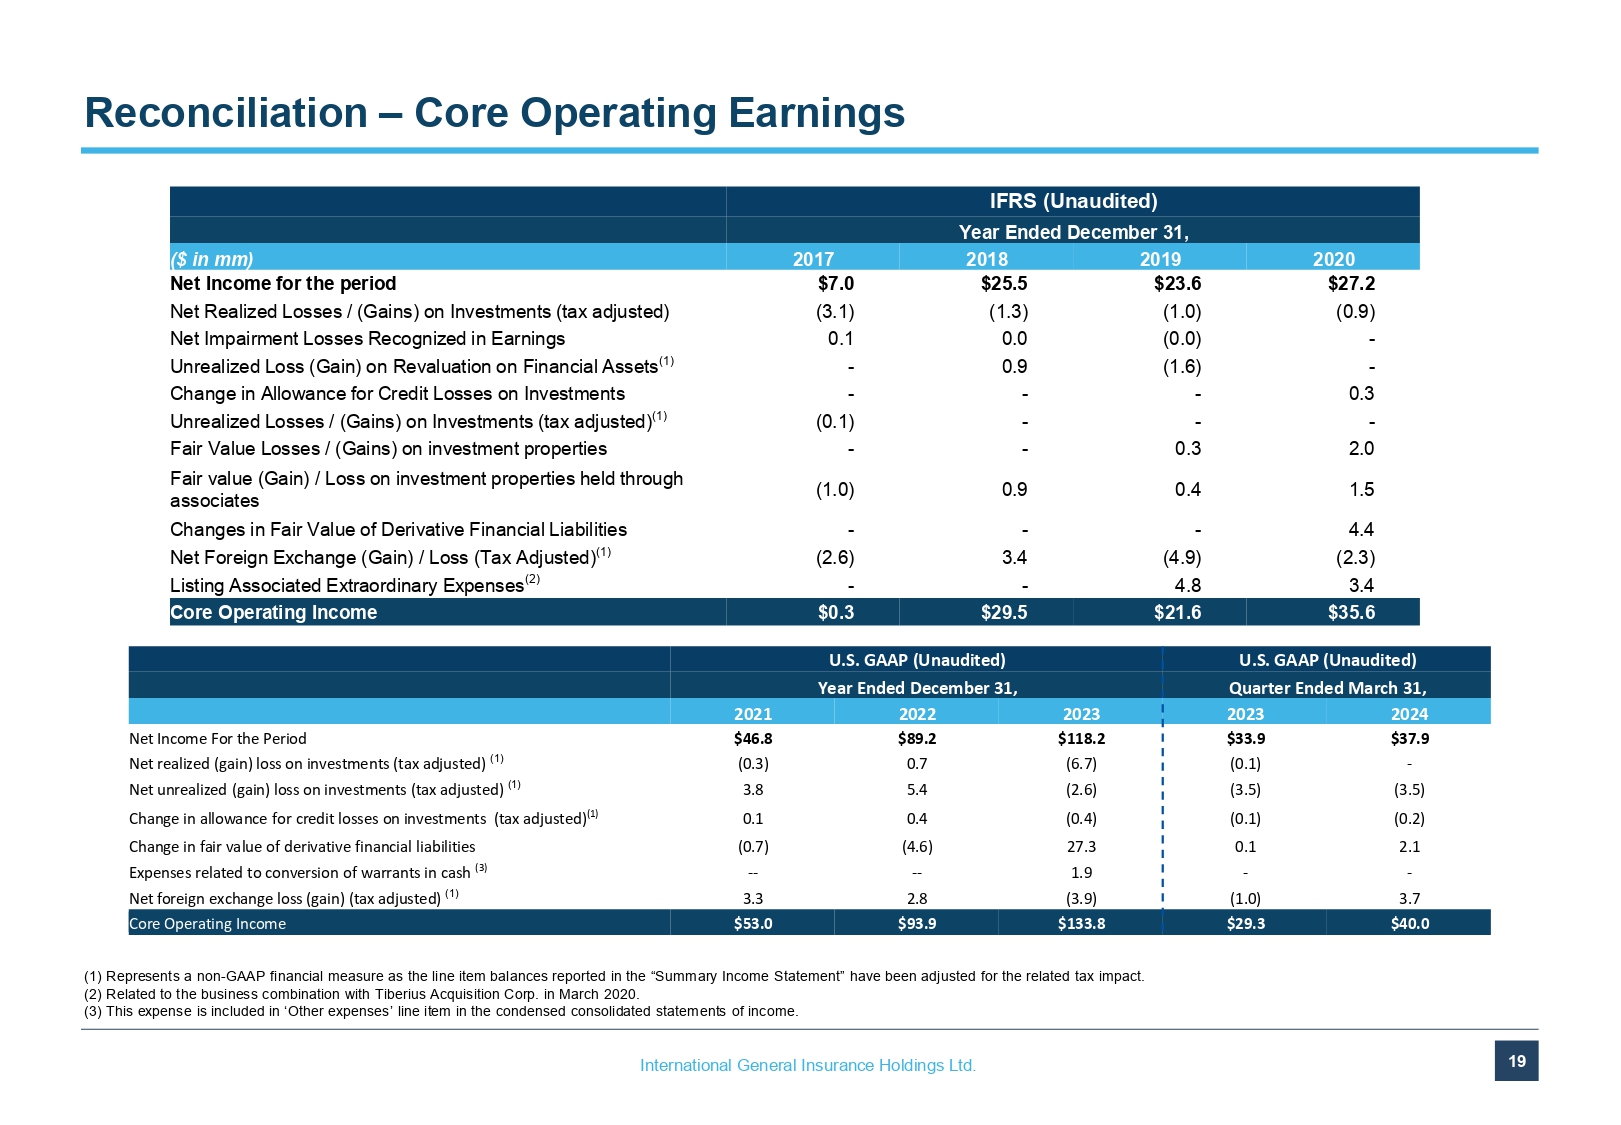
International General Insurance Holdings Ltd. 19 Reconciliation – Core Operating Earnings (1) Represents a non - GAAP financial measure as the line item balances reported in the “Summary Income Statement” have been adjus ted for the related tax impact. (2) Related to the business combination with Tiberius Acquisition Corp. in March 2020. (3) This expense is included in ‘Other expenses’ line item in the condensed consolidated statements of income. IFRS (Unaudited) Year Ended December 31, 2020 2019 2018 2017 ($ in mm) $27.2 $23.6 $25.5 $7.0 Net Income for the period (0.9) (1.0) (1.3) (3.1) Net Realized Losses / (Gains) on Investments (tax adjusted) - (0.0) 0.0 0.1 Net Impairment Losses Recognized in Earnings - (1.6) 0.9 - Unrealized Loss (Gain) on Revaluation on Financial Assets (1) 0.3 - - - Change in Allowance for Credit Losses on Investments - - - (0.1) Unrealized Losses / (Gains) on Investments (tax adjusted) (1) 2.0 0.3 - - Fair Value Losses / (Gains) on investment properties 1.5 0.4 0.9 (1.0) Fair value (Gain) / Loss on investment properties held through associates 4.4 - - - Changes in Fair Value of Derivative Financial Liabilities (2.3) (4.9) 3.4 (2.6) Net Foreign Exchange (Gain) / Loss (Tax Adjusted) (1) 3.4 4.8 - - Listing Associated Extraordinary Expenses (2) $35.6 $21.6 $29.5 $0.3 Core Operating Income U.S. GAAP (Unaudited) U.S. GAAP (Unaudited) Quarter Ended March 31, Year Ended December 31, 2024 2023 2023 2022 2021 $37.9 $33.9 $118.2 $89.2 $46.8 Net Income For the Period - (0.1) (6.7) 0.7 (0.3) Net realized (gain) loss on investments (tax adjusted) ( 1 ) (3.5) (3.5) (2.6) 5.4 3.8 Net unrealized (gain) loss on investments (tax adjusted) ( 1 ) (0.2) (0.1) (0.4) 0.4 0.1 Change in allowance for credit losses on investments (tax adjusted) ( 1 ) 2.1 0.1 27.3 (4.6) (0.7) Change in fair value of derivative financial liabilities - - 1.9 -- -- Expenses related to conversion of warrants in cash (3) 3.7 (1.0) (3.9) 2.8 3.3 Net foreign exchange loss (gain) (tax adjusted) ( 1 ) $40.0 $29.3 $133.8 $93.9 $53.0 Core Operating Income
International General Insurance Holdings Ltd. 20 For more information: Investor Relations Robin Sidders (Head of Investor Relations) Email: Robin.Sidders@iginsure.com Mobile: +44 7384 514785
International General In... (NASDAQ:IGIC)
Historical Stock Chart
From Apr 2024 to May 2024

International General In... (NASDAQ:IGIC)
Historical Stock Chart
From May 2023 to May 2024
