false 0001464423 0001464423 2025-01-30 2025-01-30 0001464423 us-gaap:CommonStockMember 2025-01-30 2025-01-30 0001464423 us-gaap:SeriesAPreferredStockMember 2025-01-30 2025-01-30 0001464423 us-gaap:SeriesBPreferredStockMember 2025-01-30 2025-01-30 0001464423 us-gaap:SeriesCPreferredStockMember 2025-01-30 2025-01-30 0001464423 us-gaap:SeniorNotesMember 2025-01-30 2025-01-30
UNITED STATES
SECURITIES AND EXCHANGE COMMISSION
Washington, D.C. 20549
FORM 8-K
CURRENT REPORT
Pursuant to Section 13 or 15(d)
of the Securities Exchange Act of 1934
Date of Report (Date of earliest event reported): January 30, 2025
PennyMac Mortgage Investment Trust
(Exact name of registrant as specified in its charter)
|
|
|
|
|
| Maryland |
|
001-34416 |
|
27-0186273 |
| (State or other jurisdiction of incorporation) |
|
(Commission File Number) |
|
(IRS Employer Identification No.) |
|
|
|
|
|
| 3043 Townsgate Road, Westlake Village, California |
|
91361 |
| (Address of principal executive offices) |
|
(Zip Code) |
(818) 224-7442
(Registrant’s telephone number, including area code)
Not Applicable
(Former name or former address, if changed since last report)
Check the appropriate box below if the Form 8-K filing is intended to simultaneously satisfy the filing obligation of the registrant under any of the following provisions:
| ☐ |
Written communications pursuant to Rule 425 under the Securities Act (17 CFR 230.425) |
| ☐ |
Soliciting material pursuant to Rule 14a-12 under the Exchange Act (17 CFR 240.14a-12) |
| ☐ |
Pre-commencement communications pursuant to Rule 14d-2(b) under the Exchange Act (17 CFR 240.14d-2(b)) |
| ☐ |
Pre-commencement communications pursuant to Rule 13e-4(c) under the Exchange Act (17 CFR 240.13e-4(c)) |
Securities registered pursuant to Section 12(b) of the Act:
|
|
|
|
|
| Title of each class |
|
Trading Symbol(s) |
|
Name of each exchange on which registered |
| Common Shares of Beneficial Interest, $0.01 par value |
|
PMT |
|
New York Stock Exchange |
| 8.125% Series A Cumulative Redeemable Preferred Shares of Beneficial Interest, $0.01 par value |
|
PMT/PA |
|
New York Stock Exchange |
| 8.00% Series B Cumulative Redeemable Preferred Shares of Beneficial Interest, $0.01 par value |
|
PMT/PB |
|
New York Stock Exchange |
| 6.75% Series C Cumulative Redeemable Preferred Shares of Beneficial Interest, $0.01 par value |
|
PMT/PC |
|
New York Stock Exchange |
| 8.50% Senior Note Due 2028 |
|
PMTU |
|
New York Stock Exchange |
Indicate by check mark whether the registrant is an emerging growth company as defined in Rule 405 of the Securities Act of 1933 (§230.405 of this chapter) or Rule 12b-2 of the Securities Exchange Act of 1934 (§240.12b-2 of this chapter).
Emerging growth company ☐
If an emerging growth company, indicate by check mark if the registrant has elected not to use the extended transition period for complying with any new or revised financial accounting standards provided pursuant to Section 13(a) of the Exchange Act. ☐
| Item 2.02 |
Results of Operations and Financial Condition. |
On January 30, 2025, PennyMac Mortgage Investment Trust (the “Company”) issued a press release announcing its financial results for the fiscal quarter and year ended December 31, 2024. A copy of the press release and the slide presentation used in connection with the Company’s presentation of financial results were made available on January 30, 2025 and are furnished as Exhibits 99.1 and Exhibit 99.2, respectively. In addition, the Company has made available other supplemental financial information for the fiscal quarter and year ended December 31, 2024 on its website at pmt.pennymac.com.
The information in Item 2.02 of this report, including the exhibits hereto, shall not be deemed “filed” for purposes of Section 18 of the Securities Exchange Act of 1934, or otherwise subject to the liabilities of Section 18, nor shall it be deemed incorporated by reference into any disclosure document relating to the Company, except to the extent, if any, expressly set forth by specific reference in such filing.
| Item 9.01 |
Financial Statements and Exhibits. |
(d) Exhibits.
SIGNATURE
Pursuant to the requirements of the Securities Exchange Act of 1934, the registrant has duly caused this report to be signed on its behalf by the undersigned hereunto duly authorized.
|
|
|
|
|
|
|
|
|
|
|
|
|
PENNYMAC MORTGAGE INVESTMENT TRUST |
|
|
|
|
| Dated: January 30, 2025 |
|
|
|
|
|
/s/ Daniel S. Perotti |
|
|
|
|
|
|
Daniel S. Perotti Senior Managing Director and Chief Financial Officer |
Exhibit 99.1

PennyMac Mortgage Investment Trust Reports
Fourth Quarter and Full-Year 2024 Results
WESTLAKE VILLAGE, Calif. – January 30, 2025 – PennyMac Mortgage Investment Trust (NYSE: PMT) today reported net income
attributable to common shareholders of $36.1 million, or $0.41 per common share on a diluted basis for the fourth quarter of 2024, on net investment income of $107.9 million. PMT previously announced a cash dividend for the fourth quarter
of 2024 of $0.40 per common share of beneficial interest, which was declared on December 13, 2024, and paid on January 24, 2025, to common shareholders of record as of December 27, 2024.
Fourth Quarter 2024 Highlights
Financial results:
| |
• |
|
Net income attributable to common shareholders of $36.1 million; annualized return on average common equity
of 10%1 |
| |
• |
|
Results driven by strong levels of income excluding market driven value changes |
| |
• |
|
Book value per common share increased to $15.87 at December 31, 2024, from $15.85 at September 30, 2024
|
Other investment highlights:
| |
• |
|
Investment activity driven by correspondent production volumes |
| |
• |
|
Correspondent loan production volumes for PMT’s account totaled $3.5 billion in unpaid principal
balance (UPB), down 41 percent from the prior quarter as a result of the sale of a large percentage of conventional loans to PennyMac Financial Services, Inc. (NYSE: PFSI), and up 41 percent from the fourth quarter of 2023 as a result of
higher overall volumes |
| |
• |
|
Resulted in the creation of $60 million in new mortgage servicing rights (MSRs) |
| 1 |
Return on average common equity is calculated based on net income attributable to common shareholders as a
percentage of monthly average common equity during the quarter |
1
| |
• |
|
Closed two Agency-eligible investor loan securitizations with combined UPB of $822 million
|
| |
• |
|
Generated $52 million of net new investments in non-Agency
subordinate bonds |
Other highlights:
| |
• |
|
Renewed management and services agreement with PFSI for five years |
Notable activity after quarter end
| |
• |
|
Closed an additional Agency eligible investor loan securitization with UPB of $341 million
|
| |
• |
|
Generated $21 million of net new investments in non-Agency
subordinate bonds |
Full-Year 2024 Highlights
Financial results:
| |
• |
|
Net income of $161.0 million, versus $199.7 million in 2023 |
| |
• |
|
Net income attributable to common shareholders of $119.2 million, versus $157.8 million in 2023;
diluted earnings per share of $1.37 versus $1.63 in 2023 |
| |
• |
|
Dividends of $1.60 per common share |
| |
• |
|
Book value per share decreased slightly from $16.13 to $15.87 |
| |
• |
|
Net investment income of $334.2 million, down from $429.0 million in 2023 |
| |
• |
|
Return on average common equity of 8%2
|
| |
• |
|
Issued $1.3 billion in term debt to address or refinance upcoming maturities |
| 2 |
Return on average common equity is calculated based on net income attributable to common shareholders as a
percentage of monthly average common equity during the year |
2
“PMT produced strong results in the fourth quarter with a 10 percent annualized return on equity
primarily driven by strong levels of income excluding market driven value changes and excellent performance across all three investment strategies,” said Chairman and CEO David Spector. “Importantly, the fourth quarter marked a return to
organic creation of credit investments as we leveraged the strength of our correspondent production and securitization expertise to complete two securitizations of Agency-eligible investor loans and retained $52 million of net new credit
subordinate bond investments. With a growing pipeline of loans available for private label securitization and strong investor demand, we expect similar levels of activity well into 2025, with the potential for increased activity and securitizations
of other loan products as the origination market grows.”
Mr. Spector concluded, “While I am pleased with PMT’s performance in 2024, I
am even more excited by the opportunity ahead. Given our expectations for PMT to be a consistent issuer and investor in private label securitizations alongside its seasoned portfolio of MSRs and CRT with strong underlying fundamentals, I am
confident the company will continue to deliver attractive risk-adjusted returns in 2025 and beyond.”
3
The following table presents the contributions of PMT’s operating segments, consisting of Credit
Sensitive Strategies, Interest Rate Sensitive Strategies, and Correspondent Production, as well as non-segment activities in our corporate operations:
|
|
|
|
|
|
|
|
|
|
|
|
|
|
|
|
|
|
|
|
|
|
|
|
|
| Quarter ended December 31, 2024 |
|
Credit sensitive
strategies |
|
|
Interest rate sensitive
strategies |
|
|
Correspondent
production |
|
|
Reportable
segment total |
|
|
Corporate |
|
|
Total |
|
| |
|
(in thousands) |
|
| Net investment income: |
|
|
|
|
|
|
|
|
|
|
|
|
|
|
|
|
|
|
|
|
|
|
|
|
| Net loan servicing fees |
|
$ |
— |
|
|
$ |
207,421 |
|
|
$ |
— |
|
|
$ |
207,421 |
|
|
$ |
— |
|
|
$ |
207,421 |
|
| Net gains on loans acquired for sale |
|
|
— |
|
|
|
— |
|
|
|
26,387 |
|
|
|
26,387 |
|
|
|
— |
|
|
|
26,387 |
|
| Net gains (losses) on investments and financings |
|
|
|
|
|
|
|
|
|
|
|
|
|
|
|
|
|
|
|
|
|
|
|
|
| Mortgage-backed securities |
|
|
(292 |
) |
|
|
(130,856 |
) |
|
|
— |
|
|
|
(131,148 |
) |
|
|
— |
|
|
|
(131,148 |
) |
| Loans at fair value |
|
|
(4,016 |
) |
|
|
4,957 |
|
|
|
— |
|
|
|
941 |
|
|
|
— |
|
|
|
941 |
|
| CRT investments |
|
|
24,552 |
|
|
|
— |
|
|
|
— |
|
|
|
24,552 |
|
|
|
— |
|
|
|
24,552 |
|
|
|
|
|
|
|
|
|
|
|
|
|
|
|
|
|
|
|
|
|
|
|
|
|
|
|
|
|
20,244 |
|
|
|
(125,899 |
) |
|
|
— |
|
|
|
(105,655 |
) |
|
|
— |
|
|
|
(105,655 |
) |
| Net interest income: |
|
|
|
|
|
|
|
|
|
|
|
|
|
|
|
|
|
|
|
|
|
|
|
|
| Interest income |
|
|
21,114 |
|
|
|
106,117 |
|
|
|
32,478 |
|
|
|
159,709 |
|
|
|
3,426 |
|
|
|
163,135 |
|
| Interest expense |
|
|
20,679 |
|
|
|
135,733 |
|
|
|
29,531 |
|
|
|
185,943 |
|
|
|
1,177 |
|
|
|
187,120 |
|
|
|
|
|
|
|
|
|
|
|
|
|
|
|
|
|
|
|
|
|
|
|
|
|
|
|
|
|
435 |
|
|
|
(29,616 |
) |
|
|
2,947 |
|
|
|
(26,234 |
) |
|
|
2,249 |
|
|
|
(23,985 |
) |
| Other |
|
|
(282 |
) |
|
|
— |
|
|
|
4,041 |
|
|
|
3,759 |
|
|
|
— |
|
|
|
3,759 |
|
|
|
|
|
|
|
|
|
|
|
|
|
|
|
|
|
|
|
|
|
|
|
|
|
|
|
|
|
20,397 |
|
|
|
51,906 |
|
|
|
33,375 |
|
|
|
105,678 |
|
|
|
2,249 |
|
|
|
107,927 |
|
|
|
|
|
|
|
|
|
|
|
|
|
|
|
|
|
|
|
|
|
|
|
|
|
|
| Expenses: |
|
|
|
|
|
|
|
|
|
|
|
|
|
|
|
|
|
|
|
|
|
|
|
|
| Earned by PennyMac Financial Services, Inc.: |
|
|
|
|
|
|
|
|
|
|
|
|
|
|
|
|
|
|
|
|
|
|
|
|
| Loan servicing fees |
|
|
19 |
|
|
|
20,467 |
|
|
|
— |
|
|
|
20,486 |
|
|
|
— |
|
|
|
20,486 |
|
| Management fees |
|
|
— |
|
|
|
— |
|
|
|
— |
|
|
|
— |
|
|
|
7,149 |
|
|
|
7,149 |
|
| Loan fulfillment fees |
|
|
— |
|
|
|
— |
|
|
|
6,356 |
|
|
|
6,356 |
|
|
|
— |
|
|
|
6,356 |
|
| Professional Services |
|
|
— |
|
|
|
— |
|
|
|
3,508 |
|
|
|
3,508 |
|
|
|
2,533 |
|
|
|
6,041 |
|
| Loan Collection and Liquidation |
|
|
281 |
|
|
|
2,256 |
|
|
|
— |
|
|
|
2,537 |
|
|
|
— |
|
|
|
2,537 |
|
| Compensation |
|
|
— |
|
|
|
— |
|
|
|
— |
|
|
|
— |
|
|
|
997 |
|
|
|
997 |
|
| Safekeeping |
|
|
— |
|
|
|
1,252 |
|
|
|
84 |
|
|
|
1,336 |
|
|
|
— |
|
|
|
1,336 |
|
| Mortgage Loan Origination Fees |
|
|
— |
|
|
|
— |
|
|
|
914 |
|
|
|
914 |
|
|
|
— |
|
|
|
914 |
|
| Other Expenses |
|
|
— |
|
|
|
2,464 |
|
|
|
— |
|
|
|
2,464 |
|
|
|
4,523 |
|
|
|
6,987 |
|
|
|
|
|
|
|
|
|
|
|
|
|
|
|
|
|
|
|
|
|
|
|
|
|
|
|
|
|
300 |
|
|
|
26,439 |
|
|
|
10,862 |
|
|
|
37,601 |
|
|
|
15,202 |
|
|
|
52,803 |
|
|
|
|
|
|
|
|
|
|
|
|
|
|
|
|
|
|
|
|
|
|
|
|
|
|
| Pretax income (loss) |
|
$ |
20,097 |
|
|
$ |
25,467 |
|
|
$ |
22,513 |
|
|
$ |
68,077 |
|
|
$ |
(12,953 |
) |
|
$ |
55,124 |
|
|
|
|
|
|
|
|
|
|
|
|
|
|
|
|
|
|
|
|
|
|
|
|
|
|
Credit Sensitive Strategies Segment
The Credit Sensitive Strategies segment primarily includes results from PMT’s organically-created GSE CRT investments, opportunistic investments in other
GSE CRT, investments in non-agency subordinate bonds from private-label securitizations of PMT’s production and legacy investments. Pretax income for the segment was $20.1 million on net investment
income of $20.4 million, compared to pretax income of $26.4 million on net investment income of $26.5 million in the prior quarter.
Net
gains on investments in the segment were $20.2 million, compared to $27.1 million in the prior quarter. These net gains include $24.6 million of gains on PMT’s organically-created GSE CRT investments, $0.3 million in losses
on other acquired subordinate CRT mortgage-backed securities (MBS), and $4.0 million of losses on investments from non-agency subordinate bonds from PMT’s production.
4
Net gains on PMT’s organically-created CRT investments for the quarter were $24.6 million,
compared to $20.8 million in the prior quarter. These net gains include $10.2 million in valuation-related gains, which reflected the impact of credit spread tightening in the fourth quarter. The prior quarter included $6.6 million of
such gains. Net gains on PMT’s organically-created CRT investments also included $14.8 million in realized gains and carry, compared to $15.0 million in the prior quarter. Realized losses during the quarter were $0.5 million.
Net interest income for the segment totaled $0.4 million, compared to $0.5 million of net interest expense in the prior quarter. Interest
income totaled $21.1 million, down slightly from $21.4 million in the prior quarter. Interest expense totaled $20.7 million, down from $21.9 million in the prior quarter.
Interest Rate Sensitive Strategies Segment
The Interest
Rate Sensitive Strategies segment includes results from investments in MSRs, Agency MBS, non-Agency senior MBS and interest rate hedges. Pretax income for the segment was $25.5 million on net investment
income of $51.9 million, compared to pretax income of $0.5 million on net investment income of $26.1 million in the prior quarter. The segment includes investments that typically have offsetting fair value exposures to changes in
interest rates. For example, in a period with increasing interest rates, MSRs are expected to increase in fair value, whereas Agency pass-through and non-Agency senior MBS are expected to decrease in fair
value.
The results in the Interest Rate Sensitive Strategies segment consist of net gains and losses on investments, net interest income and net loan
servicing fees, as well as associated expenses.
Income from net loan servicing fees was $207.4 million, compared to losses of $85.1 million in
the prior quarter. Net loan servicing fees included contractually specified servicing fees of $159.6 million and $4.9 million in other fees, reduced by $90.6 million in realization of MSR cash flows, which was down from
$100.6 million in the prior quarter due to higher interest rates during the quarter. Net loan servicing fees also included $183.9 million in fair value gains on MSRs due to higher interest rates, $51.2 million in hedging losses, and
$0.9 million of MSR recapture income. PMT’s hedging activities are intended to manage its net exposure across all interest rate sensitive strategies, which include MSRs, MBS and related tax impacts.
5
Net losses on investments for the segment were $125.9 million, which primarily consisted of losses on
MBS due to higher interest rates.
The following schedule details net loan servicing fees:
|
|
|
|
|
|
|
|
|
|
|
|
|
| |
|
Quarter ended |
|
| |
|
December 31, 2024 |
|
|
September 30, 2024 |
|
|
December 31, 2023 |
|
| |
|
|
|
|
|
|
|
|
|
| |
|
|
|
|
(in thousands) |
|
|
|
|
| From non-affiliates: |
|
|
|
|
|
|
|
|
|
|
|
|
| Contractually specified |
|
$ |
159,553 |
|
|
$ |
162,605 |
|
|
$ |
162,916 |
|
| Other fees |
|
|
4,884 |
|
|
|
4,012 |
|
|
|
2,487 |
|
| Effect of MSRs: |
|
|
|
|
|
|
|
|
|
|
|
|
| Change in fair value |
|
|
|
|
|
|
|
|
|
|
|
|
| Realization of cashflows |
|
|
(90,612 |
) |
|
|
(100,612 |
) |
|
|
(87,729 |
) |
| Market changes |
|
|
183,879 |
|
|
|
(84,306 |
) |
|
|
(144,603 |
) |
|
|
|
|
|
|
|
|
|
|
|
|
|
|
|
|
93,267 |
|
|
|
(184,918 |
) |
|
|
(232,332 |
) |
| Hedging results |
|
|
(51,209 |
) |
|
|
(67,220 |
) |
|
|
(11,191 |
) |
|
|
|
|
|
|
|
|
|
|
|
|
|
|
|
|
42,058 |
|
|
|
(252,138 |
) |
|
|
(243,523 |
) |
|
|
|
|
|
|
|
|
|
|
|
|
|
| Net servicing fees from non-affiliates |
|
|
206,495 |
|
|
|
(85,521 |
) |
|
|
(78,120 |
) |
| From PFSI—MSR recapture income |
|
|
926 |
|
|
|
441 |
|
|
|
290 |
|
|
|
|
|
|
|
|
|
|
|
|
|
|
| Net loan servicing fees |
|
$ |
207,421 |
|
|
$ |
(85,080 |
) |
|
$ |
(77,830 |
) |
|
|
|
|
|
|
|
|
|
|
|
|
|
Net interest expense for the segment was $29.6 million versus $8.4 million in the prior quarter. Interest income
totaled $106.1 million, down from $128.5 million in the prior quarter primarily due to lower interest income on MBS and earnings on custodial balances. Interest expense totaled $135.7 million, down slightly from $136.9 million in
the prior quarter.
Segment expenses were $26.4 million, up slightly from $25.6 million in the prior quarter.
Correspondent Production Segment
PMT acquires newly
originated loans from correspondent sellers and typically sells or securitizes the loans, resulting in current-period income and additions to its investments in MSRs related to a portion of its production. PMT’s Correspondent Production segment
generated pretax income of $22.5 million in the fourth quarter, up from $13.2 million in the prior quarter.
6
Through its correspondent production activities in the fourth quarter, PMT acquired a total of
$28.1 billion in UPB of loans, up 9 percent from the prior quarter and 19 percent from the fourth quarter of 2023. Of total correspondent acquisitions, government-insured or guaranteed acquisitions totaled $11.0 billion, down
7 percent from the prior quarter, while conventional conforming and jumbo acquisitions totaled $17.1 billion, up 22 percent from the prior quarter. $3.5 billion of conventional conforming and jumbo volume was for PMT’s
account, down 41 percent from the prior quarter due to PMT retaining a smaller percentage of conventional conforming correspondent loan production. PMT is expected to retain all jumbo production and 15 to 25 percent of total conventional
conforming correspondent production in the first quarter of 2025, compared to 19 percent in the fourth quarter of 2024, as PMT continues to pursue investment opportunities in the private label securitization market. Interest rate lock
commitments on conventional conforming and jumbo loans for PMT’s account totaled $3.2 billion, down 58 percent from the prior quarter.
Segment revenues were $33.4 million and included net gains on loans acquired for sale of $26.4 million, other income of $4.0 million, which
primarily consists of volume-based origination fees, and net interest income of $2.9 million. Net gains on loans acquired for sale increased $6.3 million from the prior quarter, primarily due to increased demand for private label
securitization and whole loan execution for investor loans during the quarter. Interest income was $32.5 million, up from $23.9 million in the prior quarter, and interest expense was $29.5 million, up from $24.3 million in the
prior quarter, both due to higher inventory of loans held for sale at fair value.
Segment expenses were $10.9 million, down from $13.1 million
in the prior quarter. The weighted average fulfillment fee rate in the fourth quarter was 18 basis points, down from 19 basis points in the prior quarter.
Under a renewed mortgage banking services agreement with PFSI, effective July 1, 2025, correspondent production volumes will initially be acquired by
PFSI. PMT will retain the right to purchase up to 100 percent of non-government correspondent loan production.
Corporate
Corporate includes interest income from cash
and short-term investments, management fees, and corporate expenses.
7
Corporate revenues were $2.3 million, up from $1.9 million in the prior quarter. Management fees
were $7.1 million, and other expenses were $4.5 million.
Taxes
PMT recorded a provision for tax expense of $8.6 million, driven by income from correspondent production and gains on MSRs held in PMT’s taxable REIT
subsidiary.
***
Management’s slide
presentation and accompanying materials will be available in the Investor Relations section of the Company’s website at pmt.pennymac.com after the market closes on Thursday, January 30, 2025. Management will also host a conference
call and live audio webcast at 6:00 p.m. Eastern Time to review the Company’s financial results. The webcast can be accessed at pmt.pennymac.com, and a replay will be available shortly after its conclusion.
Individuals who are unable to access the website but would like to receive a copy of the materials should contact the Company’s Investor Relations
department at 818.224.7028.
About PennyMac Mortgage Investment Trust
PennyMac Mortgage Investment Trust is a mortgage real estate investment trust (REIT) that invests primarily in residential mortgage loans and mortgage-related
assets. PMT is externally managed by PNMAC Capital Management, LLC, a wholly-owned subsidiary of PennyMac Financial Services, Inc. (NYSE: PFSI). Additional information about PennyMac Mortgage Investment Trust is available at pmt.pennymac.com.
|
|
|
| Media |
|
Investors |
|
|
| Kristyn Clark |
|
Kevin Chamberlain |
|
|
| mediarelations@pennymac.com |
|
Isaac Garden |
|
|
| 805.225.8224 |
|
investorrelations@pennymac.com |
|
|
|
|
818.224.7028 |
8
“Forward-Looking Statements
This press release contains forward-looking statements within the meaning of Section 21E of the Securities Exchange Act of 1934”, as amended, regarding
management’s beliefs, estimates, projections and assumptions with respect to, among other things, the Company’s financial results, future operations, business plans and investment strategies, as well as industry and market conditions, all
of which are subject to change. Words like “believe,” “expect,” “anticipate,” “promise,” “plan,” and other expressions or words of similar meanings, as well as future or conditional verbs such as
“will,” “would,” “should,” “could,” or “may” are generally intended to identify forward-looking statements. Actual results and operations for any future period may vary materially from those
projected herein and from past results discussed herein. Factors which could cause actual results to differ materially from historical results or those anticipated include, but are not limited to: changes in interest rates; the Company’s
ability to comply with various federal, state and local laws and regulations that govern its business; volatility in the Company’s industry, the debt or equity markets, the general economy or the real estate finance and real estate markets;
events or circumstances which undermine confidence in the financial and housing markets or otherwise have a broad impact on financial and housing markets; changes in real estate values, housing prices and housing sales; changes in macroeconomic,
consumer and real estate market conditions; the degree and nature of the Company’s competition; the availability of, and level of competition for, attractive risk-adjusted investment opportunities in mortgage loans and mortgage-related assets
that satisfy the Company’s investment objectives; the inherent difficulty in winning bids to acquire mortgage loans, and the Company’s success in doing so; the concentration of credit risks to which the Company is exposed; the
Company’s dependence on its manager and servicer, potential conflicts of interest with such entities and their affiliates, and the performance of such entities; changes in personnel and lack of availability of qualified personnel at its
manager, servicer or their affiliates; our ability to mitigate cybersecurity risks, cybersecurity incidents and technology disruptions; the development of artificial intelligence; the availability, terms and deployment of short-term and long-term
capital; the adequacy of the Company’s cash reserves and working capital; the Company’s ability to maintain the desired relationship between its financing and the interest rates and maturities of its assets; the timing and amount of cash
flows, if any, from the Company’s investments; our substantial amount of indebtedness; the performance, financial condition and liquidity of borrowers; our exposure to risks of loss and disruptions in operations resulting from severe weather events, man-made or other natural conditions, including climate change and pandemics; the ability of the Company’s servicer, which also provides the Company with fulfillment services, to approve and
monitor correspondent sellers and underwrite loans to investor standards; incomplete or inaccurate information or documentation provided by customers or counterparties, or adverse changes in the financial condition of the Company’s customers
and counterparties; the Company’s indemnification and repurchase obligations in connection with mortgage loans it purchases and later sells or securitizes; the quality and enforceability of the collateral documentation evidencing the
Company’s ownership and rights in the assets in which it invests; increased rates of delinquency, defaults and forbearances and/or decreased recovery rates on the Company’s investments; the performance of mortgage loans underlying
mortgage-backed securities in which the Company retains credit risk; the Company’s ability to foreclose on its investments in a timely manner or at all; increased prepayments of the mortgages and other loans underlying the Company’s
mortgage-backed securities or relating to the Company’s mortgage servicing rights and other investments; risks associated with the discontinuation of LIBOR; the degree to which the Company’s hedging strategies may or may not protect it
from interest rate volatility; the effect of the accuracy of or changes in the estimates the Company makes about uncertainties, contingencies and asset and liability valuations when measuring and reporting upon the Company’s financial condition
and results of operations; the Company’s ability to maintain appropriate internal control over financial reporting; the Company’s ability to detect misconduct and fraud; developments in the secondary markets for the Company’s mortgage
loan products; legislative and
9
regulatory changes that impact the mortgage loan industry or housing market; regulatory or other changes that impact government agencies or government-sponsored entities, or such changes that
increase the cost of doing business with such agencies or entities; the Consumer Financial Protection Bureau and its issued and future rules and the enforcement thereof; changes in government support of homeownership; changes in government or
government-sponsored home affordability programs; changes in the Company’s investment objectives or investment or operational strategies, including any new lines of business or new products and services that may subject it to additional risks;
limitations imposed on the Company’s business and its ability to satisfy complex rules for it to qualify as a REIT for U.S. federal income tax purposes and qualify for an exclusion from the Investment Company Act of 1940 and the ability of
certain of the Company’s subsidiaries to qualify as REITs or as taxable REIT subsidiaries for U.S. federal income tax purposes; changes in governmental regulations, accounting treatment, tax rates and similar matters; the Company’s ability
to make distributions to its shareholders in the future; the Company’s failure to deal appropriately with issues that may give rise to reputational risk; and the Company’s organizational structure and certain requirements in its charter
documents. You should not place undue reliance on any forward-looking statement and should consider all of the uncertainties and risks described above, as well as those more fully discussed in reports and other documents filed by the Company with
the Securities and Exchange Commission from time to time. The Company undertakes no obligation to publicly update or revise any forward-looking statements or any other information contained herein, and the statements made in this press release are
current as of the date of this release only.
10
PENNYMAC MORTGAGE INVESTMENT TRUST AND SUBSIDIARIES
CONSOLIDATED BALANCE SHEETS (UNAUDITED)
|
|
|
|
|
|
|
|
|
|
|
|
|
| |
|
December 31, 2024 |
|
|
September 30, 2024 |
|
|
December 31, 2023 |
|
| |
|
|
|
|
|
|
|
|
|
| |
|
(in thousands except share amounts) |
|
| ASSETS |
|
|
|
|
|
|
|
|
|
|
|
|
| Cash |
|
$ |
337,694 |
|
|
$ |
344,358 |
|
|
$ |
281,085 |
|
| Short-term investments at fair value |
|
|
103,198 |
|
|
|
102,787 |
|
|
|
128,338 |
|
| Mortgage-backed securities at fair value |
|
|
4,063,706 |
|
|
|
4,182,382 |
|
|
|
4,836,292 |
|
| Loans acquired for sale at fair value |
|
|
2,116,318 |
|
|
|
1,665,796 |
|
|
|
669,018 |
|
| Loans at fair value |
|
|
2,193,575 |
|
|
|
1,429,525 |
|
|
|
1,433,820 |
|
| Derivative assets |
|
|
56,840 |
|
|
|
81,844 |
|
|
|
177,984 |
|
| Deposits securing credit risk transfer arrangements |
|
|
1,110,708 |
|
|
|
1,135,447 |
|
|
|
1,209,498 |
|
| Mortgage servicing rights at fair value |
|
|
3,867,394 |
|
|
|
3,809,047 |
|
|
|
3,919,107 |
|
| Servicing advances |
|
|
105,037 |
|
|
|
71,124 |
|
|
|
206,151 |
|
| Due from PennyMac Financial Services, Inc. |
|
|
16,015 |
|
|
|
8,538 |
|
|
|
56 |
|
| Other |
|
|
438,221 |
|
|
|
224,806 |
|
|
|
252,538 |
|
|
|
|
|
|
|
|
|
|
|
|
|
|
| Total assets |
|
$ |
14,408,706 |
|
|
$ |
13,055,654 |
|
|
$ |
13,113,887 |
|
|
|
|
|
|
|
|
|
|
|
|
|
|
| LIABILITIES |
|
|
|
|
|
|
|
|
|
|
|
|
| Assets sold under agreements to repurchase |
|
$ |
6,500,938 |
|
|
$ |
5,748,461 |
|
|
$ |
5,624,558 |
|
| Mortgage loan participation and sale agreements |
|
|
11,593 |
|
|
|
28,790 |
|
|
|
— |
|
| Notes payable secured by credit risk transfer and mortgage servicing assets |
|
|
2,929,790 |
|
|
|
2,830,108 |
|
|
|
2,910,605 |
|
| Unsecured senior notes |
|
|
605,860 |
|
|
|
814,915 |
|
|
|
600,458 |
|
| Asset-backed financing of variable interest entities at fair value |
|
|
2,040,375 |
|
|
|
1,334,797 |
|
|
|
1,336,731 |
|
| Interest-only security payable at fair value |
|
|
34,222 |
|
|
|
35,098 |
|
|
|
32,667 |
|
| Derivative and credit risk transfer strip liabilities at fair value |
|
|
7,351 |
|
|
|
16,151 |
|
|
|
51,381 |
|
| Accounts payable and accrued liabilities |
|
|
139,124 |
|
|
|
114,085 |
|
|
|
354,989 |
|
| Due to PennyMac Financial Services, Inc. |
|
|
30,206 |
|
|
|
32,603 |
|
|
|
29,262 |
|
| Income taxes payable |
|
|
163,861 |
|
|
|
155,544 |
|
|
|
190,003 |
|
| Liability for losses under representations and warranties |
|
|
6,886 |
|
|
|
8,315 |
|
|
|
26,143 |
|
|
|
|
|
|
|
|
|
|
|
|
|
|
| Total liabilities |
|
|
12,470,206 |
|
|
|
11,118,867 |
|
|
|
11,156,797 |
|
|
|
|
|
|
|
|
|
|
|
|
|
|
| SHAREHOLDERS’ EQUITY |
|
|
|
|
|
|
|
|
|
|
|
|
| Preferred shares of beneficial interest |
|
|
541,482 |
|
|
|
541,482 |
|
|
|
541,482 |
|
| Common shares of beneficial interest—authorized, 500,000,000 common shares of $0.01 par
value; issued and outstanding 86,860,960, 86,860,960 and 86,760,408 common shares, respectively |
|
|
869 |
|
|
|
869 |
|
|
|
866 |
|
| Additional paid-in capital |
|
|
1,925,067 |
|
|
|
1,924,596 |
|
|
|
1,923,437 |
|
| Accumulated deficit |
|
|
(528,918 |
) |
|
|
(530,160 |
) |
|
|
(508,695 |
) |
|
|
|
|
|
|
|
|
|
|
|
|
|
| Total shareholders’ equity |
|
|
1,938,500 |
|
|
|
1,936,787 |
|
|
|
1,957,090 |
|
|
|
|
|
|
|
|
|
|
|
|
|
|
| Total liabilities and shareholders’ equity |
|
$ |
14,408,706 |
|
|
$ |
13,055,654 |
|
|
$ |
13,113,887 |
|
|
|
|
|
|
|
|
|
|
|
|
|
|
11
PENNYMAC MORTGAGE INVESTMENT TRUST AND SUBSIDIARIES
CONSOLIDATED STATEMENTS OF INCOME (UNAUDITED)
|
|
|
|
|
|
|
|
|
|
|
|
|
| |
|
For the Quarterly Periods Ended |
|
| |
|
December 31, 2024 |
|
|
September 30, 2024 |
|
|
December 31, 2023 |
|
| Investment Income |
|
|
|
|
|
|
|
|
|
|
|
|
| Net loan servicing fees: |
|
|
|
|
|
|
|
|
|
|
|
|
| From nonaffiliates |
|
|
|
|
|
|
|
|
|
|
|
|
| Servicing fees |
|
$ |
164,437 |
|
|
$ |
166,617 |
|
|
$ |
165,403 |
|
| Change in fair value of mortgage servicing rights |
|
|
93,267 |
|
|
|
(184,918 |
) |
|
|
(232,332 |
) |
| Hedging results |
|
|
(51,209 |
) |
|
|
(67,220 |
) |
|
|
(11,191 |
) |
|
|
|
|
|
|
|
|
|
|
|
|
|
|
|
|
206,495 |
|
|
|
(85,521 |
) |
|
|
(78,120 |
) |
| From PennyMac Financial Services, Inc. |
|
|
926 |
|
|
|
441 |
|
|
|
290 |
|
|
|
|
|
|
|
|
|
|
|
|
|
|
|
|
|
207,421 |
|
|
|
(85,080 |
) |
|
|
(77,830 |
) |
| Net gains on loans acquired for sale |
|
|
26,387 |
|
|
|
20,059 |
|
|
|
15,380 |
|
| Loan origination fees |
|
|
3,986 |
|
|
|
6,640 |
|
|
|
3,004 |
|
| Net (losses) gains on investments and financings |
|
|
(105,655 |
) |
|
|
146,695 |
|
|
|
164,338 |
|
| Interest income |
|
|
163,135 |
|
|
|
176,734 |
|
|
|
165,278 |
|
| Interest expense |
|
|
187,120 |
|
|
|
184,171 |
|
|
|
185,523 |
|
|
|
|
|
|
|
|
|
|
|
|
|
|
| Net interest expense |
|
|
(23,985 |
) |
|
|
(7,437 |
) |
|
|
(20,245 |
) |
| Other |
|
|
(227 |
) |
|
|
(13 |
) |
|
|
127 |
|
|
|
|
|
|
|
|
|
|
|
|
|
|
| Net investment income |
|
|
107,927 |
|
|
|
80,864 |
|
|
|
84,774 |
|
|
|
|
|
|
|
|
|
|
|
|
|
|
| Expenses |
|
|
|
|
|
|
|
|
|
|
|
|
| Earned by PennyMac Financial Services, Inc.: |
|
|
|
|
|
|
|
|
|
|
|
|
| Loan servicing fees |
|
|
20,486 |
|
|
|
22,240 |
|
|
|
20,324 |
|
| Management fees |
|
|
7,149 |
|
|
|
7,153 |
|
|
|
7,252 |
|
| Loan fulfillment fees |
|
|
6,356 |
|
|
|
11,492 |
|
|
|
4,931 |
|
| Professional services |
|
|
6,041 |
|
|
|
2,614 |
|
|
|
2,084 |
|
| Loan collection and liquidation |
|
|
2,537 |
|
|
|
2,257 |
|
|
|
1,184 |
|
| Safekeeping |
|
|
1,336 |
|
|
|
1,174 |
|
|
|
1,059 |
|
| Compensation |
|
|
997 |
|
|
|
1,326 |
|
|
|
2,327 |
|
| Loan origination |
|
|
914 |
|
|
|
1,408 |
|
|
|
817 |
|
| Other |
|
|
6,987 |
|
|
|
4,666 |
|
|
|
4,476 |
|
|
|
|
|
|
|
|
|
|
|
|
|
|
| Total expenses |
|
|
52,803 |
|
|
|
54,330 |
|
|
|
44,454 |
|
|
|
|
|
|
|
|
|
|
|
|
|
|
| Income before provision for (benefit from) income taxes |
|
|
55,124 |
|
|
|
26,534 |
|
|
|
40,320 |
|
| Provision for (benefit from) income taxes |
|
|
8,589 |
|
|
|
(14,873 |
) |
|
|
(12,590 |
) |
|
|
|
|
|
|
|
|
|
|
|
|
|
| Net income |
|
|
46,535 |
|
|
|
41,407 |
|
|
|
52,910 |
|
| Dividends on preferred shares |
|
|
10,455 |
|
|
|
10,455 |
|
|
|
10,455 |
|
|
|
|
|
|
|
|
|
|
|
|
|
|
| Net income attributable to common shareholders |
|
$ |
36,080 |
|
|
$ |
30,952 |
|
|
$ |
42,455 |
|
|
|
|
|
|
|
|
|
|
|
|
|
|
| Earnings per common share |
|
|
|
|
|
|
|
|
|
|
|
|
| Basic |
|
$ |
0.41 |
|
|
$ |
0.36 |
|
|
$ |
0.49 |
|
| Diluted |
|
$ |
0.41 |
|
|
$ |
0.36 |
|
|
$ |
0.44 |
|
| Weighted average shares outstanding |
|
|
|
|
|
|
|
|
|
|
|
|
| Basic |
|
|
86,861 |
|
|
|
86,861 |
|
|
|
86,659 |
|
| Diluted |
|
|
86,861 |
|
|
|
86,861 |
|
|
|
110,987 |
|
12
PENNYMAC MORTGAGE INVESTMENT TRUST AND SUBSIDIARIES
CONSOLIDATED STATEMENTS OF OPERATIONS (UNAUDITED)
|
|
|
|
|
|
|
|
|
|
|
|
|
| |
|
Year ended December 31, |
|
| |
|
2024 |
|
|
2023 |
|
|
2022 |
|
| |
|
(in thousands, except earnings per common share) |
|
| Net investment income |
|
|
|
|
|
|
|
|
|
|
|
|
| Net loan servicing fees: |
|
|
|
|
|
|
|
|
|
|
|
|
| From nonaffiliates |
|
|
|
|
|
|
|
|
|
|
|
|
| Contractually specified |
|
$ |
644,642 |
|
|
$ |
659,438 |
|
|
$ |
625,210 |
|
| Other |
|
|
14,722 |
|
|
|
17,008 |
|
|
|
26,041 |
|
|
|
|
|
|
|
|
|
|
|
|
|
|
|
|
|
659,364 |
|
|
|
676,446 |
|
|
|
651,251 |
|
| Change in fair value of mortgage servicing rights |
|
|
(170,409 |
) |
|
|
(296,847 |
) |
|
|
449,435 |
|
| Mortgage servicing rights hedging results |
|
|
(226,608 |
) |
|
|
(92,775 |
) |
|
|
(204,879 |
) |
|
|
|
|
|
|
|
|
|
|
|
|
|
|
|
|
262,347 |
|
|
|
286,824 |
|
|
|
895,807 |
|
| From PennyMac Financial Services, Inc. |
|
|
2,193 |
|
|
|
1,784 |
|
|
|
13,744 |
|
|
|
|
|
|
|
|
|
|
|
|
|
|
|
|
|
264,540 |
|
|
|
288,608 |
|
|
|
909,551 |
|
| Net gains on loans acquired for sale: |
|
|
|
|
|
|
|
|
|
|
|
|
| From nonaffiliates |
|
|
65,055 |
|
|
|
32,695 |
|
|
|
20,724 |
|
| From PennyMac Financial Services, Inc. |
|
|
8,069 |
|
|
|
7,162 |
|
|
|
4,968 |
|
|
|
|
|
|
|
|
|
|
|
|
|
|
|
|
|
73,124 |
|
|
|
39,857 |
|
|
|
25,692 |
|
| Loan origination fees |
|
|
15,085 |
|
|
|
18,231 |
|
|
|
52,085 |
|
| Net gains (losses) on investments and financings |
|
|
61,050 |
|
|
|
178,099 |
|
|
|
(658,787 |
) |
| Net interest expense: |
|
|
|
|
|
|
|
|
|
|
|
|
| Interest income |
|
|
635,263 |
|
|
|
639,907 |
|
|
|
383,794 |
|
| Interest expense |
|
|
714,659 |
|
|
|
735,968 |
|
|
|
410,420 |
|
|
|
|
|
|
|
|
|
|
|
|
|
|
| Net interest expense |
|
|
(79,396 |
) |
|
|
(96,061 |
) |
|
|
(26,626 |
) |
| Results of real estate acquired in settlement of loans |
|
|
(437 |
) |
|
|
(186 |
) |
|
|
496 |
|
| Other |
|
|
228 |
|
|
|
472 |
|
|
|
1,360 |
|
|
|
|
|
|
|
|
|
|
|
|
|
|
| Net investment income |
|
|
334,194 |
|
|
|
429,020 |
|
|
|
303,771 |
|
|
|
|
|
|
|
|
|
|
|
|
|
|
| Expenses |
|
|
|
|
|
|
|
|
|
|
|
|
| Earned by PennyMac Financial Services, Inc.: |
|
|
|
|
|
|
|
|
|
|
|
|
| Loan servicing fees |
|
|
83,252 |
|
|
|
81,347 |
|
|
|
81,915 |
|
| Management fees |
|
|
28,623 |
|
|
|
28,762 |
|
|
|
31,065 |
|
| Loan fulfillment fees |
|
|
26,291 |
|
|
|
27,826 |
|
|
|
67,991 |
|
| Professional services |
|
|
12,779 |
|
|
|
7,621 |
|
|
|
9,569 |
|
| Loan collection and liquidation |
|
|
6,834 |
|
|
|
4,562 |
|
|
|
5,396 |
|
| Compensation |
|
|
5,608 |
|
|
|
7,106 |
|
|
|
5,941 |
|
| Safekeeping |
|
|
4,403 |
|
|
|
3,766 |
|
|
|
8,201 |
|
| Loan origination |
|
|
3,328 |
|
|
|
4,602 |
|
|
|
12,036 |
|
| Other |
|
|
20,428 |
|
|
|
19,033 |
|
|
|
18,570 |
|
|
|
|
|
|
|
|
|
|
|
|
|
|
| Total expenses |
|
|
191,546 |
|
|
|
184,625 |
|
|
|
240,684 |
|
|
|
|
|
|
|
|
|
|
|
|
|
|
| Income before (benefit from) provision for income taxes |
|
|
142,648 |
|
|
|
244,395 |
|
|
|
63,087 |
|
| (Benefit from) provision for income taxes |
|
|
(18,336 |
) |
|
|
44,741 |
|
|
|
136,374 |
|
|
|
|
|
|
|
|
|
|
|
|
|
|
| Net income (loss) |
|
|
160,984 |
|
|
|
199,654 |
|
|
|
(73,287 |
) |
| Dividends on preferred shares |
|
|
41,819 |
|
|
|
41,819 |
|
|
|
41,819 |
|
|
|
|
|
|
|
|
|
|
|
|
|
|
| Net income (loss) attributable to common shareholders |
|
$ |
119,165 |
|
|
$ |
157,835 |
|
|
$ |
(115,106 |
) |
|
|
|
|
|
|
|
|
|
|
|
|
|
| Earnings (losses) per common share |
|
|
|
|
|
|
|
|
|
|
|
|
| Basic |
|
$ |
1.37 |
|
|
$ |
1.80 |
|
|
$ |
(1.26 |
) |
| Diluted |
|
$ |
1.37 |
|
|
$ |
1.63 |
|
|
$ |
(1.26 |
) |
| Weighted average common shares outstanding |
|
|
|
|
|
|
|
|
|
|
|
|
| Basic |
|
|
86,815 |
|
|
|
87,372 |
|
|
|
91,434 |
|
| Diluted |
|
|
86,815 |
|
|
|
111,700 |
|
|
|
91,434 |
|
13

Exhibit 99.2 4Q24 EARNINGS REPORT PennyMac Mortgage Investment Trust
January 2025
FORWARD LOOKING STATEMENTS This presentation contains forward-looking
statements within the meaning of Section 21E of the Securities Exchange Act of 1934, as amended, regarding management’s beliefs, estimates, projections and assumptions with respect to, among other things, the Company’s financial
results, future operations, business plans and investment strategies, as well as industry and market conditions, all of which are subject to change. Words like “believe,” “expect,” “anticipate,”
“promise,” “plan,” and other expressions or words of similar meanings, as well as future or conditional verbs such as “will,” “would,” “should,” “could,” or “may”
are generally intended to identify forward-looking statements. Actual results and operations for any future period may vary materially from those projected herein and from past results discussed herein. These forward-looking statements include, but
are not limited to, statements regarding future changes in interest rates, housing, and prepayment rates; future loan originations and production; future loan delinquencies, defaults and forbearances; future investment and hedge expenses; future
investment strategies, future earnings and return on equity as well as other business and financial expectations. Factors which could cause actual results to differ materially from historical results or those anticipated include, but are not
limited to: changes in interest rates; the Company’s ability to comply with various federal, state and local laws and regulations that govern its business; the general economy or the real estate finance and real estate markets; events or
circumstances which undermine confidence in the financial and housing markets or otherwise have a broad impact on financial and housing markets; changes in real estate values, housing prices and housing sales; changes in
macroeconomic, consumer and real estate market conditions; the degree and nature of the Company’s competition; the availability of, and level of competition for, attractive risk adjusted investment opportunities in mortgage loans and mortgage
related assets that satisfy the Company’s investment objectives; the inherent difficulty in winning bids to acquire mortgage loans, and the Company’s success in doing so; the concentration of credit risks to which the Company is
exposed; the Company’s dependence on its manager and servicer, potential conflicts of interest with such entities and their affiliates, and the performance of such entities; changes in personnel and lack of availability of
qualified personnel at its manager, servicer or their affiliates; our ability to mitigate cybersecurity risks, cybersecurity incidents and technology disruptions; the development of artificial intelligence; the availability, terms
and deployment of short term and long term capital; the adequacy of the Company’s cash reserves and working capital; the Company’s ability to maintain the desired relationship between its financing and the interest rates and
maturities of its assets; the timing and amount of cash flows, if any, from the Company’ s investments; our substantial amount of indebtedness; the performance, financial condition and liquidity of borrowers; our exposure to risks
of loss and disruptions in operations resulting from severe weather events, man-made or other natural conditions, including climate change and pandemics; the ability of the Company’s servicer, which also provides the Company with
fulfillment services, to approve and monitor correspondent sellers and underwrite loans to investor standards; incomplete or inaccurate information or documentation provided by customers or counterparties, or adverse changes in the
financial condition of the Company’s customers and counterparties; the Company’s indemnification and repurchase obligations in connection with mortgage loans it purchases and later sells or securitizes; the quality and
enforceability of the collateral documentation evidencing the Company’ s ownership and rights in the assets in which it invests; increased rates of delinquency, defaults and forbearances and/or decreased recovery rates on the Company’s
investments; the performance of mortgage loans underlying mortgage backed securities in which the Company retains credit risk; the Company’s ability to foreclose on its investments in a timely manner or at all; increased prepayments of the
mortgages and other loans underlying the Company’s mortgage backed securities or relating to the Company’s mortgage servicing rights and other investments; risks associated with the discontinuation of LIBOR; the degree to which the
Company’s hedging strategies may or may not protect it from interest rate volatility; the effect of the accuracy of or changes in the estimates the Company makes about uncertainties, contingencies and asset and liability valuations when
measuring and reporting upon the Company’s financial condition and results of operations; the Company’s ability to maintain appropriate internal control over financial reporting; the Company’s ability to detect
misconduct and fraud; developments in the secondary markets for the Company’s mortgage loan products; legislative and regulatory changes that impact the mortgage loan industry or housing market regulatory or other changes that impact
government agencies or government sponsored entities, or such changes that increase the cost of doing business with such agencies or entities; the Consumer Financial Protection Bureau and its issued and future rules and the enforcement thereof;
changes in government support of homeownership; changes in government or government sponsored home affordability programs; changes in the Company’s investment objectives or investment or operational strategies, including any new lines of
business or new products and services that may subject it to additional risks volatility in the Company’s industry, the debt or equity markets; limitations imposed on the Company’s business and its ability to satisfy complex rules for it
to qualify as a REIT for U.S. federal income tax purposes and qualify for an exclusion from the Investment Company Act of 1940 and the ability of certain of the Company’s subsidiaries to qualify as REITs or as taxable REIT subsidiaries for
U.S. federal income tax purposes; changes in governmental regulations, accounting treatment, tax rates and similar matters; the Company’s ability to make distributions to its shareholders in the future; the Company’s failure to deal
appropriately with issues that may give rise to reputational risk; and the Company’s organizational structure and certain requirements in its charter documents. You should not place undue reliance on any forward-looking statement and should
consider all of the uncertainties and risks described above, as well as those more fully discussed in reports and other documents filed by the Company with the Securities and Exchange Commission from time to time. The Company undertakes no
obligation to publicly update or revise any forward-looking statements or any other information contained herein, and the statements made in this presentation are current as of the date of this presentation only. This presentation contains
financial information calculated other than in accordance with U.S. generally accepted accounting principles (“GAAP”), such as income excluding market driven value changes that provide a meaningful perspective on the
Company’s business results since the Company utilizes this information to evaluate and manage the business. Non-GAAP disclosures have limitations as an analytical tool and should not be viewed as a substitute for financial information
determined in accordance with GAAP. 2
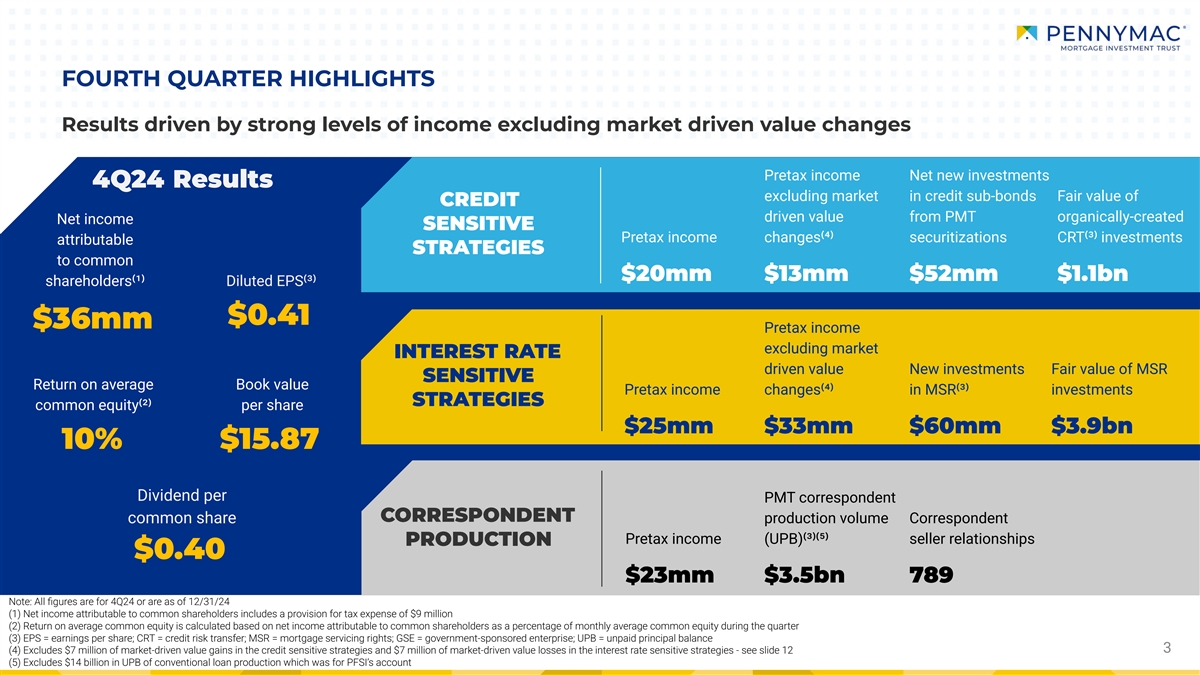
FOURTH QUARTER HIGHLIGHTS Results driven by strong levels of income
excluding market driven value changes Pretax income Net new investments 4Q24 Results excluding market in credit sub-bonds Fair value of CREDIT driven value from PMT organically-created Net income SENSITIVE Pretax income changes⁽⁴⁾
securitizations CRT⁽³⁾ investments attributable STRATEGIES to common $20mm $13mm $52mm $1.1bn shareholders⁽¹⁾ Diluted EPS⁽³⁾ $0.41 $36mm Pretax income excluding market INTEREST RATE driven value New
investments Fair value of MSR SENSITIVE Return on average Book value Pretax income changes⁽⁴⁾ in MSR⁽³⁾ investments STRATEGIES common equity⁽²⁾ per share $25mm $33mm $60mm $3.9bn 10% $15.87
Dividend per PMT correspondent CORRESPONDENT common share production volume Correspondent Pretax income (UPB)⁽³⁾⁽⁵⁾ seller relationships PRODUCTION $0.40 $23mm $3.5bn 789 Note: All figures are for 4Q24 or are
as of 12/31/24 (1) Net income attributable to common shareholders includes a provision for tax expense of $9 million (2) Return on average common equity is calculated based on net income attributable to common shareholders as a percentage of monthly
average common equity during the quarter (3) EPS = earnings per share; CRT = credit risk transfer; MSR = mortgage servicing rights; GSE = government-sponsored enterprise; UPB = unpaid principal balance 3 3 (4) Excludes $7 million of market-driven
value gains in the credit sensitive strategies and $7 million of market-driven value losses in the interest rate sensitive strategies - see slide 12 (5) Excludes $14 billion in UPB of conventional loan production which was for PFSI’s
account
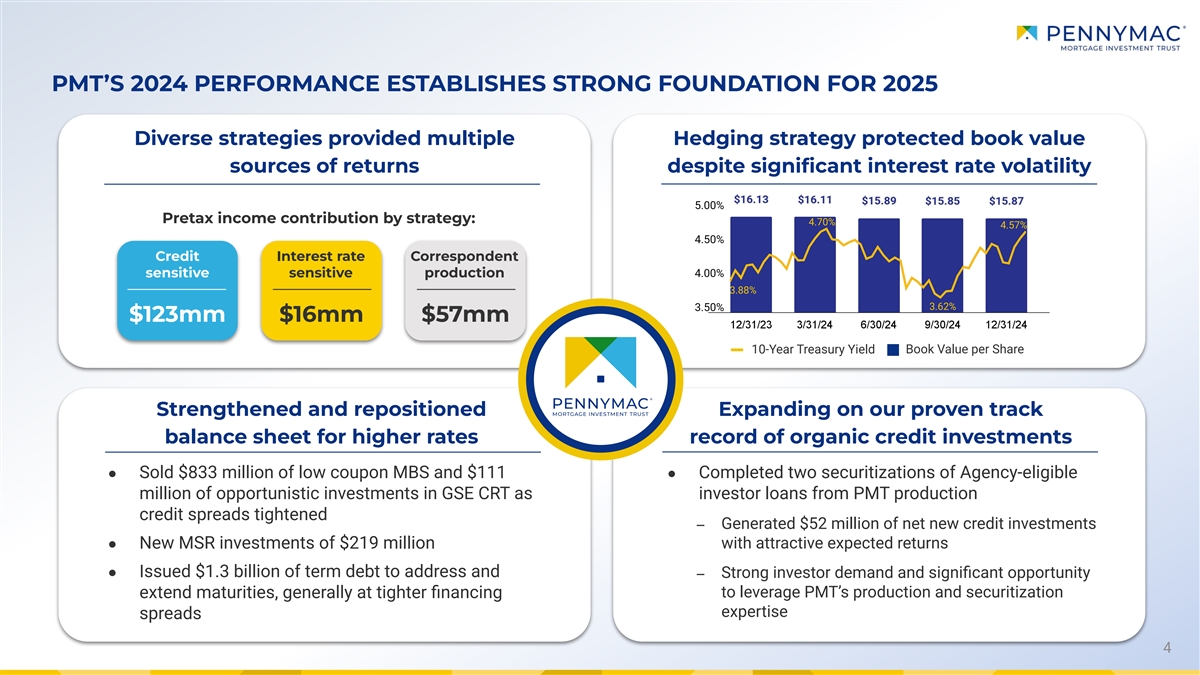
PMT’S 2024 PERFORMANCE ESTABLISHES STRONG FOUNDATION FOR 2025
Diverse strategies provided multiple Hedging strategy protected book value sources of returns despite significant interest rate volatility Pretax income contribution by strategy: 4.70% 4.57% Credit Interest rate Correspondent sensitive
sensitive production 3.88% 3.62% $123mm $16mm $57mm 10-Year Treasury Yield Book Value per Share Strengthened and repositioned Expanding on our proven track balance sheet for higher rates record of organic credit investments ● Sold $833 million
of low coupon MBS and $111 ● Completed two securitizations of Agency-eligible million of opportunistic investments in GSE CRT as investor loans from PMT production credit spreads tightened ‒ Generated $52 million of net new credit
investments ● New MSR investments of $219 million with attractive expected returns ● Issued $1.3 billion of term debt to address and ‒ Strong investor demand and significant opportunity to leverage PMT’s production and
securitization extend maturities, generally at tighter financing expertise spreads 4
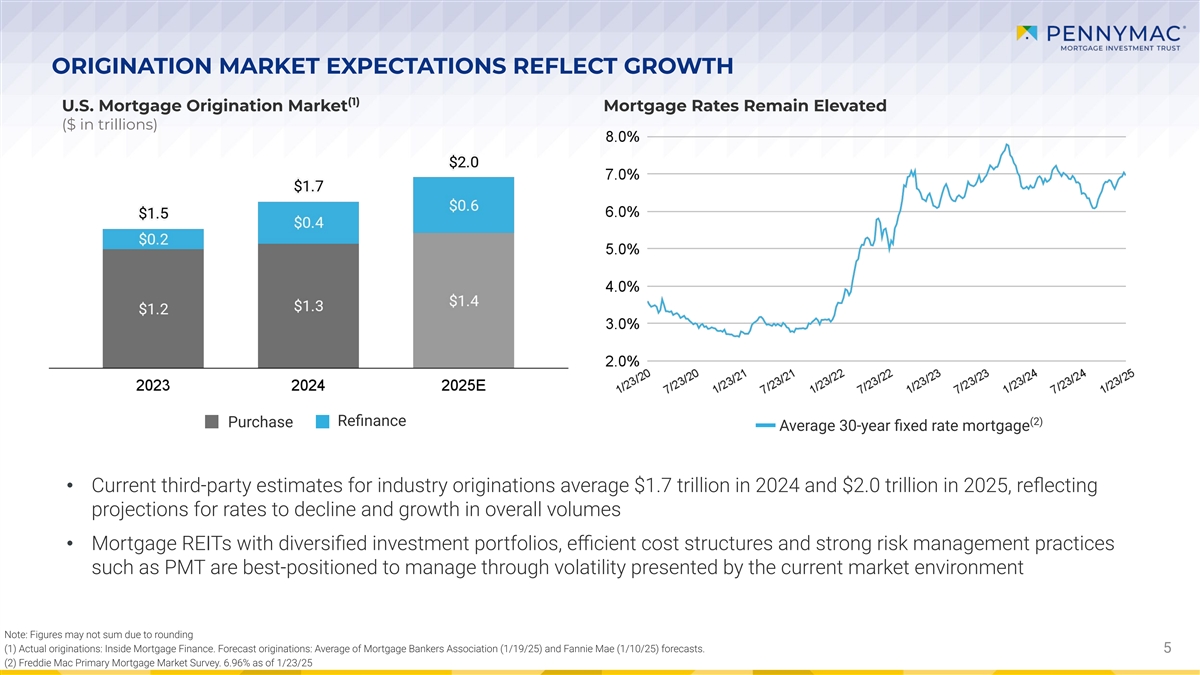
ORIGINATION MARKET EXPECTATIONS REFLECT GROWTH (1) U.S. Mortgage
Origination Market Mortgage Rates Remain Elevated ($ in trillions) (2) Refinance Purchase Average 30-year fixed rate mortgage • Current third-party estimates for industry originations average $1.7 trillion in 2024 and $2.0 trillion
in 2025, reflecting projections for rates to decline and growth in overall volumes • Mortgage REITs with diversified investment portfolios, efficient cost structures and strong risk management practices such as PMT are
best-positioned to manage through volatility presented by the current market environment Note: Figures may not sum due to rounding (1) Actual originations: Inside Mortgage Finance. Forecast originations: Average of Mortgage Bankers Association
(1/19/25) and Fannie Mae (1/10/25) forecasts. 5 (2) Freddie Mac Primary Mortgage Market Survey. 6.96% as of 1/23/25
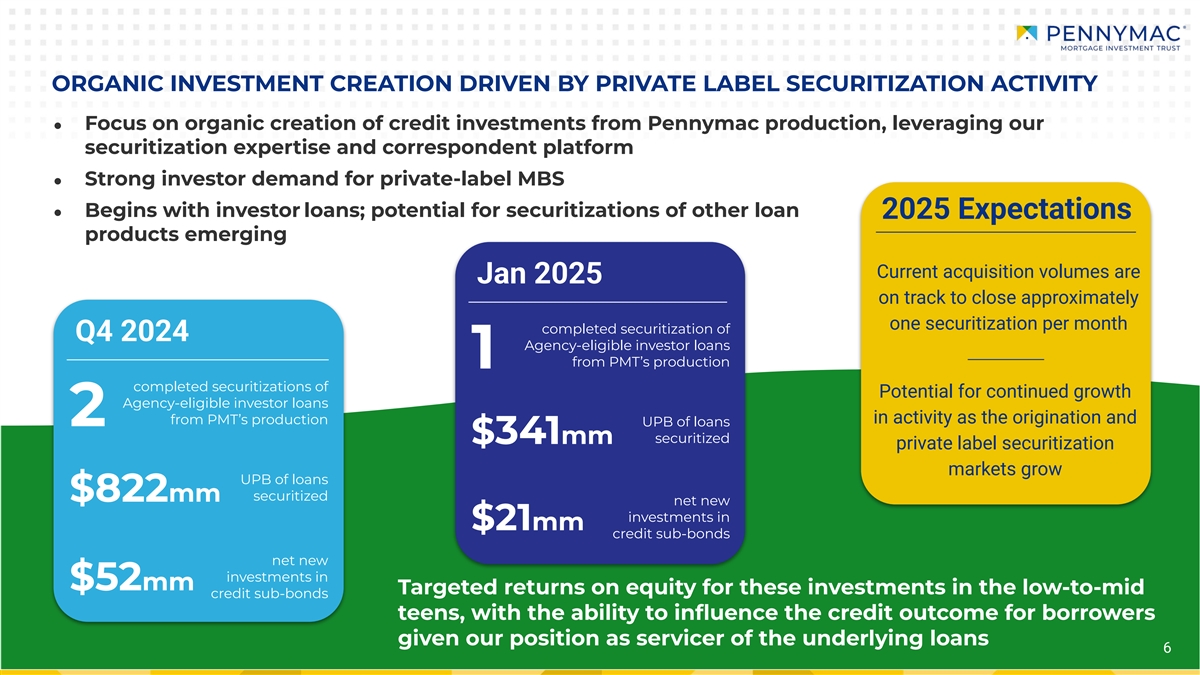
ORGANIC INVESTMENT CREATION DRIVEN BY PRIVATE LABEL SECURITIZATION
ACTIVITY ● Focus on organic creation of credit investments from Pennymac production, leveraging our securitization expertise and correspondent platform ● Strong investor demand for private-label MBS ● Begins with investor loans;
potential for securitizations of other loan 2025 Expectations products emerging Current acquisition volumes are Jan 2025 on track to close approximately one securitization per month completed securitization of Q4 2024 Agency-eligible investor loans
from PMT’s production 1 completed securitizations of Potential for continued growth Agency-eligible investor loans in activity as the origination and from PMT’s production 2 UPB of loans $341mm securitized private label securitization
markets grow UPB of loans securitized $822mm net new investments in $21mm credit sub-bonds net new investments in $52mm Targeted returns on equity for these investments in the low-to-mid credit sub-bonds teens, with the ability to influence
the credit outcome for borrowers given our position as servicer of the underlying loans 6
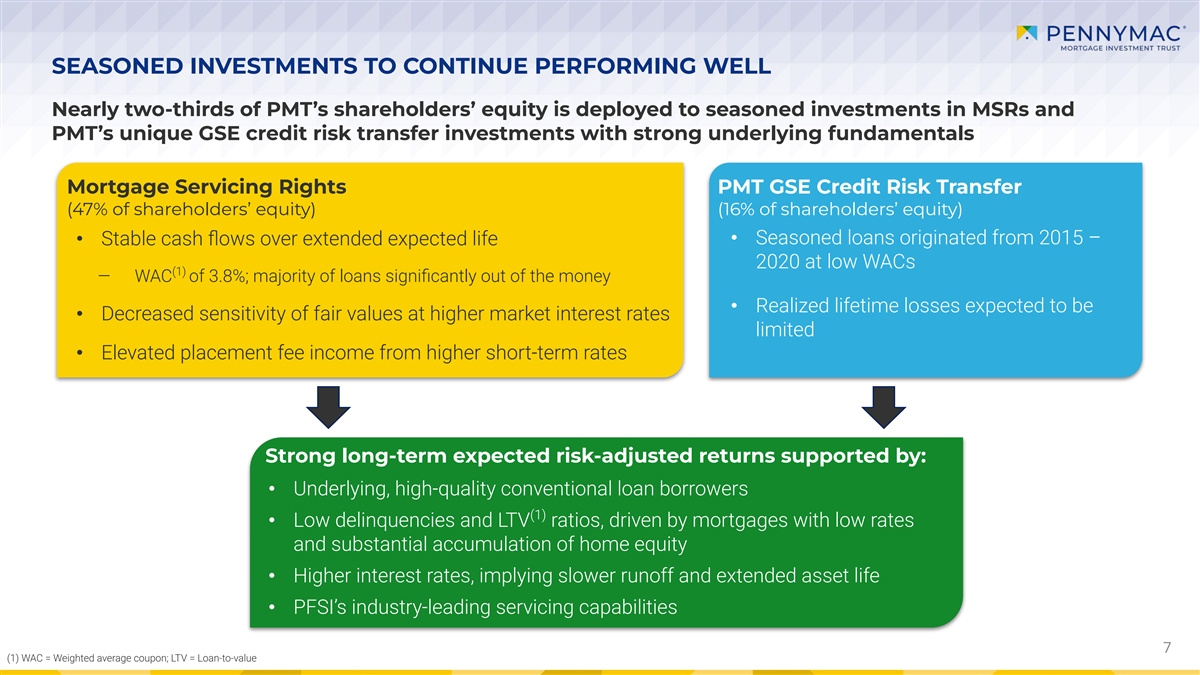
SEASONED INVESTMENTS TO CONTINUE PERFORMING WELL Nearly two-thirds of
PMT’s shareholders’ equity is deployed to seasoned investments in MSRs and PMT’s unique GSE credit risk transfer investments with strong underlying fundamentals Mortgage Servicing Rights PMT GSE Credit Risk Transfer (47% of
shareholders’ equity) (16% of shareholders’ equity) • Stable cash flows over extended expected life • Seasoned loans originated from 2015 – 2020 at low WACs (1) ‒ WAC of 3.8%; majority of loans
significantly out of the money • Realized lifetime losses expected to be • Decreased sensitivity of fair values at higher market interest rates limited • Elevated placement fee income from higher short-term rates Strong
long-term expected risk-adjusted returns supported by: • Underlying, high-quality conventional loan borrowers (1) • Low delinquencies and LTV ratios, driven by mortgages with low rates and substantial accumulation of home equity •
Higher interest rates, implying slower runoff and extended asset life • PFSI’s industry-leading servicing capabilities 7 (1) WAC = Weighted average coupon; LTV = Loan-to-value
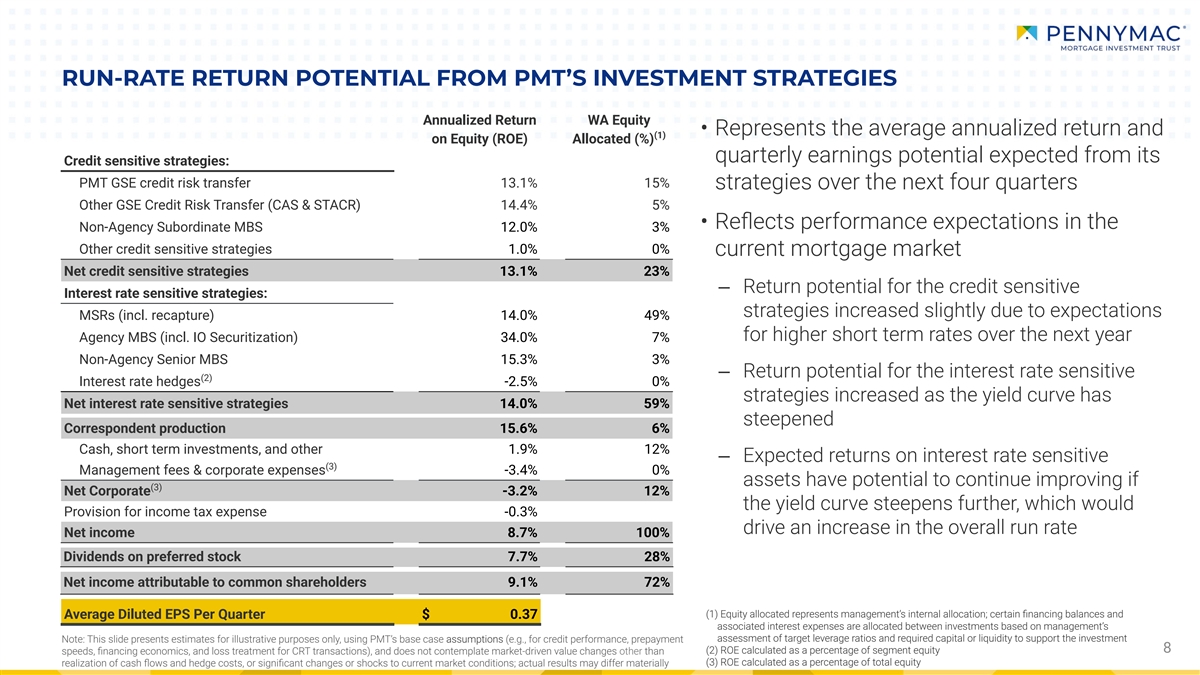
RUN-RATE RETURN POTENTIAL FROM PMT’S INVESTMENT STRATEGIES
Annualized Return WA Equity • Represents the average annualized return and (1) on Equity (ROE) Allocated (%) quarterly earnings potential expected from its Credit sensitive strategies: PMT GSE credit risk transfer 13.1% 15% strategies over the
next four quarters Other GSE Credit Risk Transfer (CAS & STACR) 14.4% 5% • Reflects performance expectations in the Non-Agency Subordinate MBS 12.0% 3% Other credit sensitive strategies 1.0% 0% current mortgage market Net credit
sensitive strategies 13.1% 23% ‒ Return potential for the credit sensitive Interest rate sensitive strategies: strategies increased slightly due to expectations MSRs (incl. recapture) 14.0% 49% for higher short term rates over the next year
Agency MBS (incl. IO Securitization) 34.0% 7% Non-Agency Senior MBS 15.3% 3% ‒ Return potential for the interest rate sensitive (2) Interest rate hedges -2.5% 0% strategies increased as the yield curve has Net interest rate sensitive
strategies 14.0% 59% steepened Correspondent production 15.6% 6% Cash, short term investments, and other 1.9% 12% ‒ Expected returns on interest rate sensitive (3) Management fees & corporate expenses -3.4% 0% assets have potential to
continue improving if (3) Net Corporate -3.2% 12% the yield curve steepens further, which would Provision for income tax expense -0.3% drive an increase in the overall run rate Net income 8.7% 100% Dividends on preferred stock 7.7% 28% Net income
attributable to common shareholders 9.1% 72% (1) Equity allocated represents management’s internal allocation; certain financing balances and Average Diluted EPS Per Quarter $ 0.37 associated interest expenses are allocated between
investments based on management’s assessment of target leverage ratios and required capital or liquidity to support the investment Note: This slide presents estimates for illustrative purposes only, using PMT’s base case assumptions
(e.g., for credit performance, prepayment 8 (2) ROE calculated as a percentage of segment equity speeds, financing economics, and loss treatment for CRT transactions), and does not contemplate market-driven value changes other than (3) ROE
calculated as a percentage of total equity realization of cash flows and hedge costs, or significant changes or shocks to current market conditions; actual results may differ materially
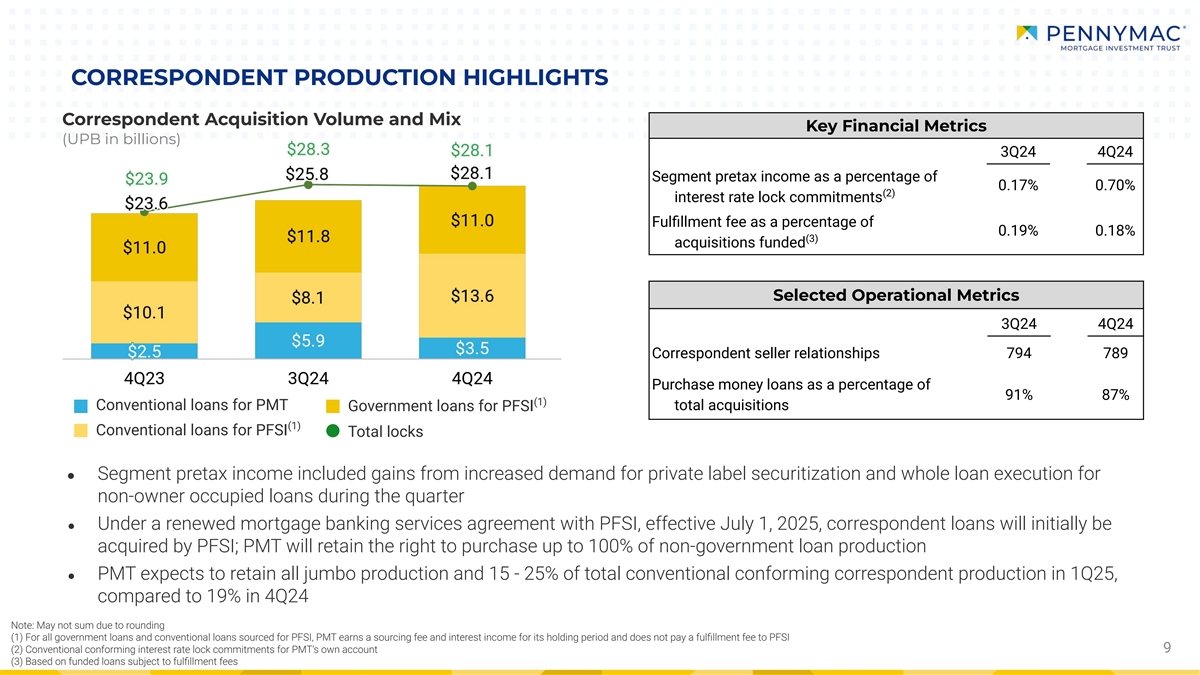
CORRESPONDENT PRODUCTION HIGHLIGHTS Correspondent Acquisition Volume and
Mix Key Financial Metrics (UPB in billions) 3Q24 4Q24 Segment pretax income as a percentage of 0.17% 0.70% (2) interest rate lock commitments Fulfillment fee as a percentage of 0.19% 0.18% (3) acquisitions funded Selected Operational Metrics
3Q24 4Q24 Correspondent seller relationships 794 789 Purchase money loans as a percentage of 91% 87% (1) Conventional loans for PMT total acquisitions Government loans for PFSI (1) Conventional loans for PFSI Total locks ● Segment pretax
income included gains from increased demand for private label securitization and whole loan execution for non-owner occupied loans during the quarter ● Under a renewed mortgage banking services agreement with PFSI, effective July 1, 2025,
correspondent loans will initially be acquired by PFSI; PMT will retain the right to purchase up to 100% of non-government loan production ● PMT expects to retain all jumbo production and 15 - 25% of total conventional conforming correspondent
production in 1Q25, compared to 19% in 4Q24 Note: May not sum due to rounding (1) For all government loans and conventional loans sourced for PFSI, PMT earns a sourcing fee and interest income for its holding period and does not pay a
fulfillment fee to PFSI (2) Conventional conforming interest rate lock commitments for PMT’s own account 9 (3) Based on funded loans subject to fulfillment fees
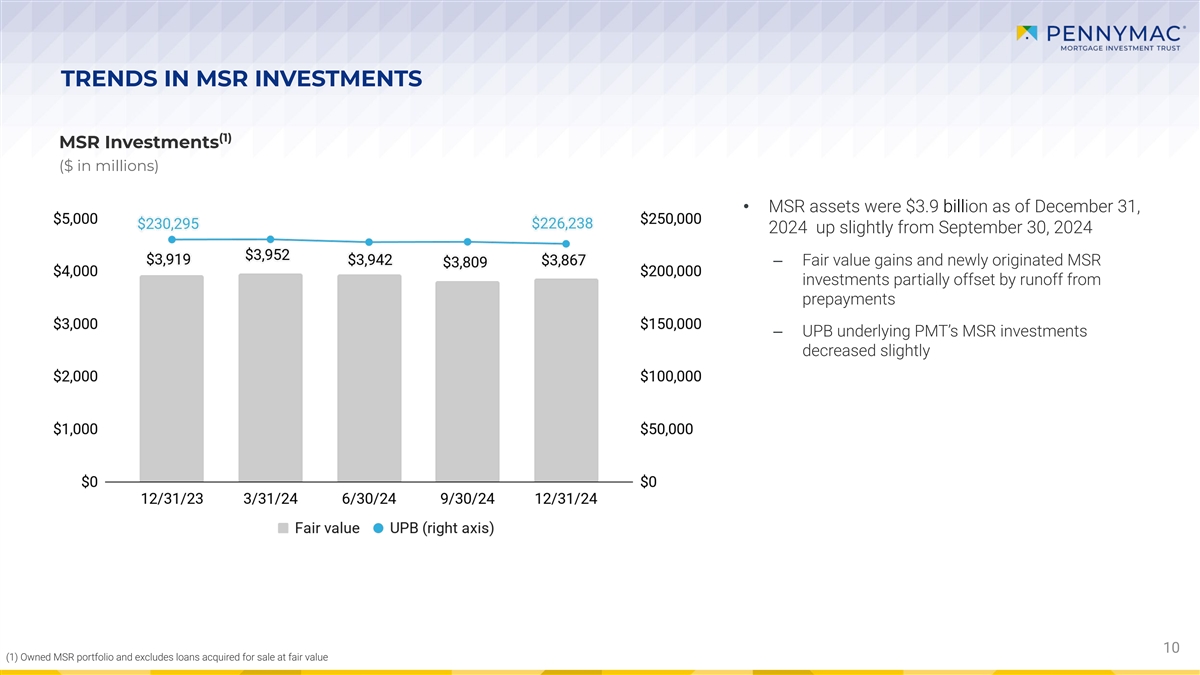
TRENDS IN MSR INVESTMENTS (1) MSR Investments ($ in millions) •
MSR assets were $3.9 billion as of December 31, 2024 up slightly from September 30, 2024 ‒ Fair value gains and newly originated MSR investments partially offset by runoff from prepayments ‒ UPB underlying PMT’s MSR investments
decreased slightly 10 (1) Owned MSR portfolio and excludes loans acquired for sale at fair value
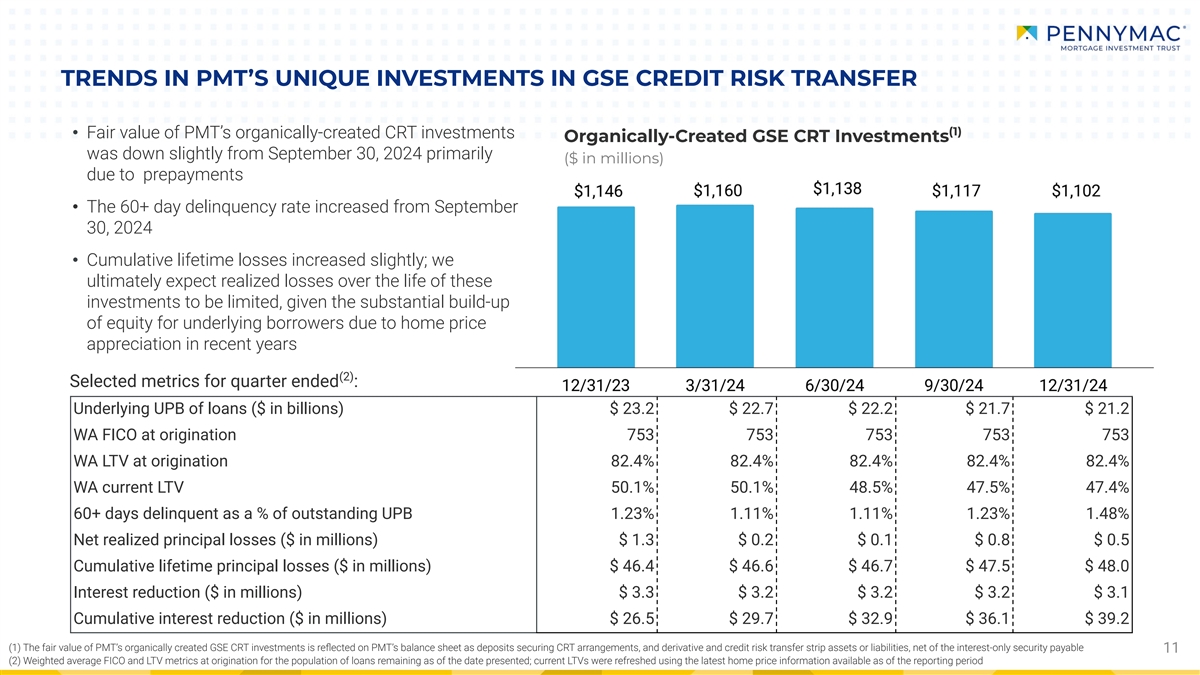
TRENDS IN PMT’S UNIQUE INVESTMENTS IN GSE CREDIT RISK TRANSFER
(1) • Fair value of PMT’s organically-created CRT investments Organically-Created GSE CRT Investments was down slightly from September 30, 2024 primarily ($ in millions) due to prepayments • The 60+ day delinquency rate increased
from September 30, 2024 • Cumulative lifetime losses increased slightly; we ultimately expect realized losses over the life of these investments to be limited, given the substantial build-up of equity for underlying borrowers due to home price
appreciation in recent years (2) Selected metrics for quarter ended : Underlying UPB of loans ($ in billions) $ 23.2 $ 22.7 $ 22.2 $ 21.7 $ 21.2 WA FICO at origination 753 753 753 753 753 WA LTV at origination 82.4% 82.4% 82.4% 82.4% 82.4% WA
current LTV 50.1% 50.1% 48.5% 47.5% 47.4% 60+ days delinquent as a % of outstanding UPB 1.23% 1.11% 1.11% 1.23% 1.48% Net realized principal losses ($ in millions) $ 1.3 $ 0.2 $ 0.1 $ 0.8 $ 0.5 Cumulative lifetime principal losses ($ in millions) $
46.4 $ 46.6 $ 46.7 $ 47.5 $ 48.0 Interest reduction ($ in millions) $ 3.3 $ 3.2 $ 3.2 $ 3.2 $ 3.1 Cumulative interest reduction ($ in millions) $ 26.5 $ 29.7 $ 32.9 $ 36.1 $ 39.2 (1) The fair value of PMT’s organically created GSE CRT
investments is reflected on PMT’s balance sheet as deposits securing CRT arrangements, and derivative and credit risk transfer strip assets or liabilities, net of the interest-only security payable 11 (2) Weighted average FICO and LTV
metrics at origination for the population of loans remaining as of the date presented; current LTVs were refreshed using the latest home price information available as of the reporting period
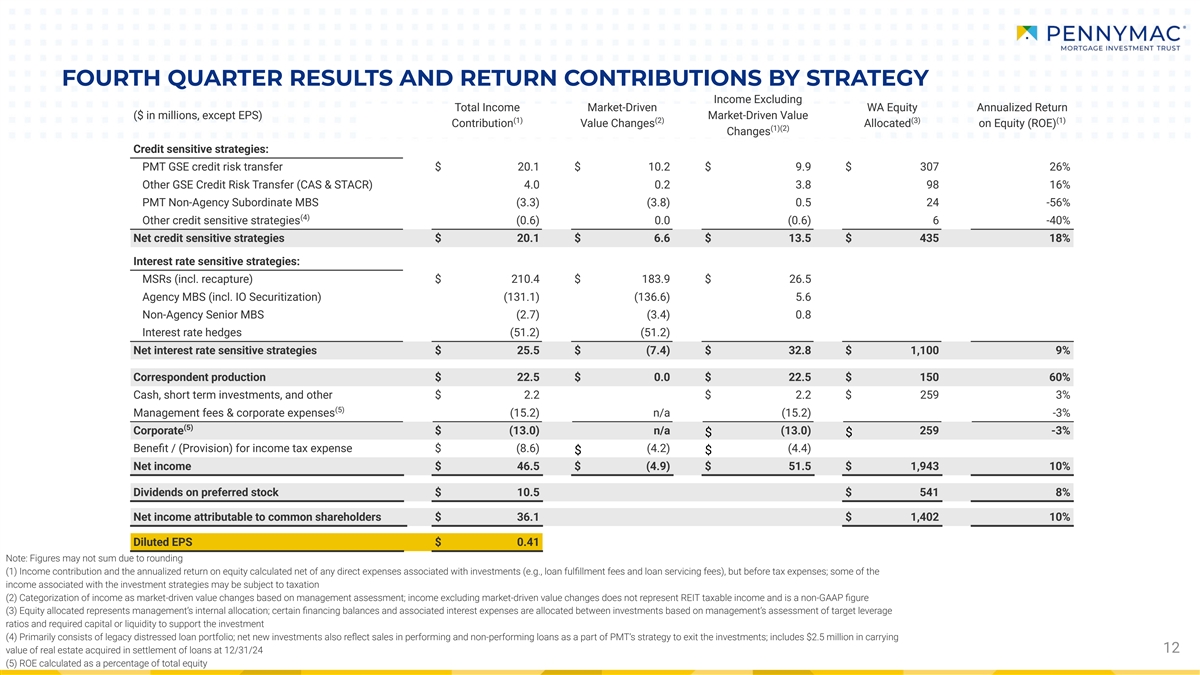
FOURTH QUARTER RESULTS AND RETURN CONTRIBUTIONS BY STRATEGY Income
Excluding Total Income Market-Driven WA Equity Annualized Return ($ in millions, except EPS) Market-Driven Value (1) (2) (3) (1) Contribution Value Changes Allocated on Equity (ROE) (1)(2) Changes Credit sensitive strategies: PMT GSE credit risk
transfer $ 20.1 $ 10.2 $ 9.9 $ 307 26% Other GSE Credit Risk Transfer (CAS & STACR) 4.0 0.2 3.8 98 16% PMT Non-Agency Subordinate MBS (3.3) (3.8) 0.5 24 -56% (4) Other credit sensitive strategies (0.6) 0.0 (0.6) 6 -40% Net credit sensitive
strategies $ 20.1 $ 6.6 $ 13.5 $ 435 18% Interest rate sensitive strategies: MSRs (incl. recapture) $ 210.4 $ 183.9 $ 26.5 Agency MBS (incl. IO Securitization) (131.1) (136.6) 5.6 Non-Agency Senior MBS (2.7) (3.4) 0.8 Interest rate hedges (51.2)
(51.2) Net interest rate sensitive strategies $ 25.5 $ (7.4) $ 32.8 $ 1,100 9% Correspondent production $ 22.5 $ 0.0 $ 22.5 $ 150 60% Cash, short term investments, and other $ 2.2 $ 2.2 $ 259 3% (5) Management fees & corporate expenses (15.2)
n/a (15.2) -3% (5) Corporate $ (13.0) n/a (13.0) 259 -3% $ $ Benefit / (Provision) for income tax expense $ (8.6) (4.2) (4.4) $ $ Net income $ 46.5 $ (4.9) $ 51.5 $ 1,943 10% Dividends on preferred stock $ 10.5 $ 541 8% Net income attributable
to common shareholders $ 36.1 $ 1,402 10% Diluted EPS $ 0.41 Note: Figures may not sum due to rounding (1) Income contribution and the annualized return on equity calculated net of any direct expenses associated with investments (e.g., loan
fulfillment fees and loan servicing fees), but before tax expenses; some of the income associated with the investment strategies may be subject to taxation (2) Categorization of income as market-driven value changes based on management
assessment; income excluding market-driven value changes does not represent REIT taxable income and is a non-GAAP figure (3) Equity allocated represents management’s internal allocation; certain financing balances and associated
interest expenses are allocated between investments based on management’s assessment of target leverage ratios and required capital or liquidity to support the investment (4) Primarily consists of legacy distressed loan portfolio; net new
investments also reflect sales in performing and non-performing loans as a part of PMT’s strategy to exit the investments; includes $2.5 million in carrying 12 value of real estate acquired in settlement of loans at 12/31/24 (5) ROE
calculated as a percentage of total equity
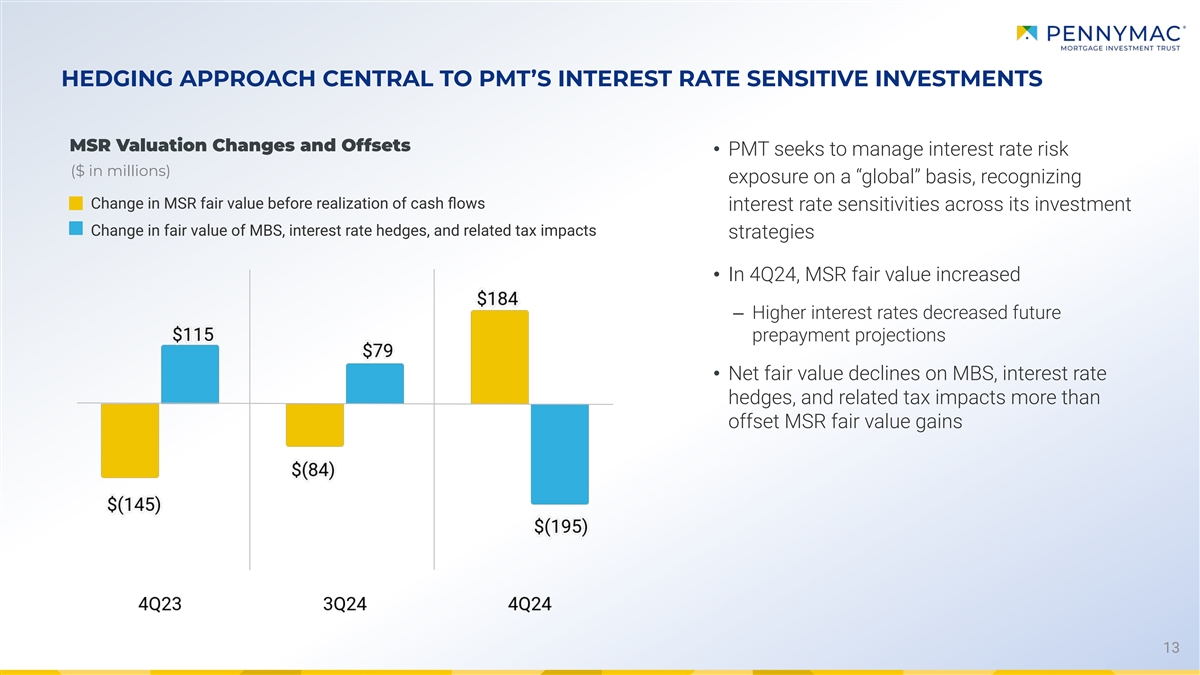
HEDGING APPROACH CENTRAL TO PMT’S INTEREST RATE SENSITIVE
INVESTMENTS MSR Valuation Changes and Offsets • PMT seeks to manage interest rate risk ($ in millions) exposure on a “global” basis, recognizing Change in MSR fair value before realization of cash flows interest rate
sensitivities across its investment Change in fair value of MBS, interest rate hedges, and related tax impacts strategies • In 4Q24, MSR fair value increased ‒ Higher interest rates decreased future prepayment projections • Net
fair value declines on MBS, interest rate hedges, and related tax impacts more than offset MSR fair value gains 13
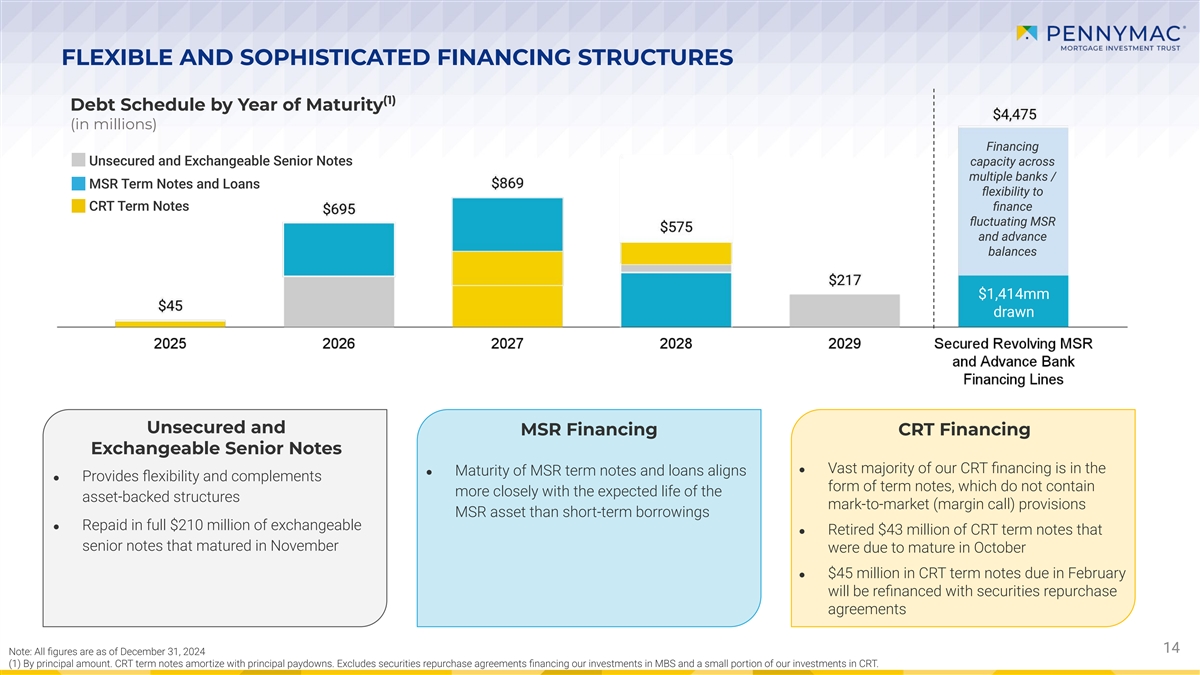
FLEXIBLE AND SOPHISTICATED FINANCING STRUCTURES (1) Debt Schedule by
Year of Maturity (in millions) Financing Unsecured and Exchangeable Senior Notes capacity across multiple banks / MSR Term Notes and Loans flexibility to CRT Term Notes finance fluctuating MSR and advance balances $1,414mm drawn
Unsecured and MSR Financing CRT Financing Exchangeable Senior Notes ● Vast majority of our CRT financing is in the ● Maturity of MSR term notes and loans aligns ● Provides flexibility and complements form of term notes,
which do not contain more closely with the expected life of the asset-backed structures mark-to-market (margin call) provisions MSR asset than short-term borrowings ● Repaid in full $210 million of exchangeable ● Retired $43 million of
CRT term notes that senior notes that matured in November were due to mature in October ● $45 million in CRT term notes due in February will be refinanced with securities repurchase agreements 14 14 Note: All figures are as of
December 31, 2024 (1) By principal amount. CRT term notes amortize with principal paydowns. Excludes securities repurchase agreements financing our investments in MBS and a small portion of our investments in CRT.

APPENDIX
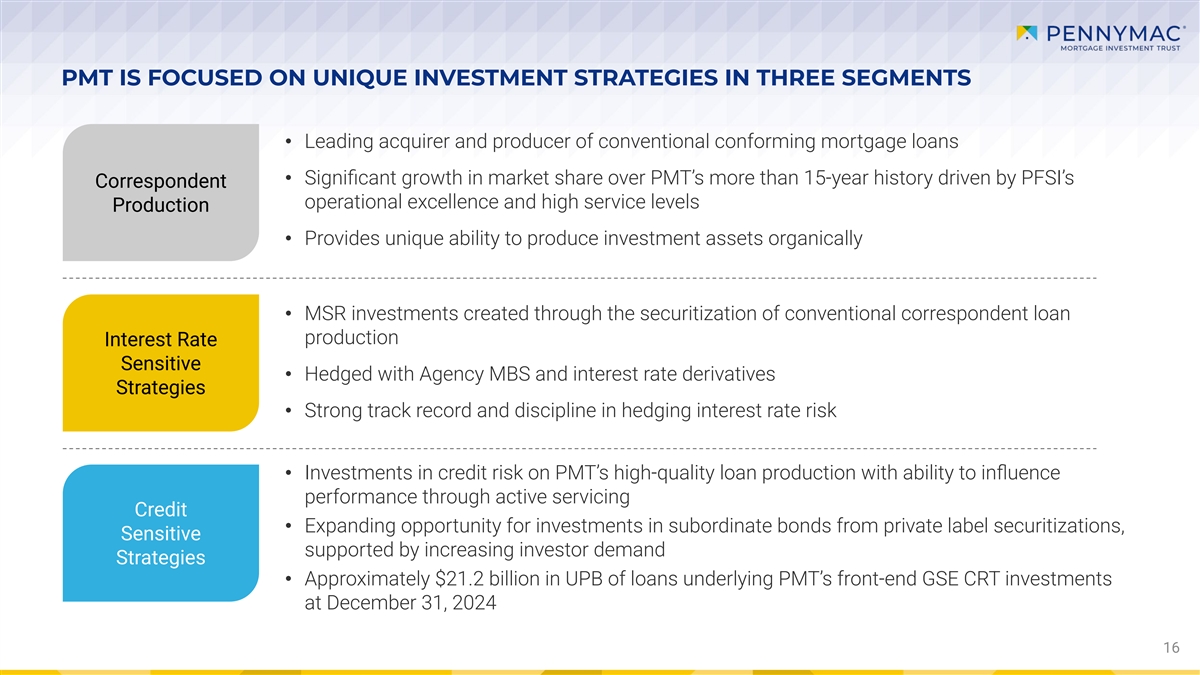
PMT IS FOCUSED ON UNIQUE INVESTMENT STRATEGIES IN THREE SEGMENTS
• Leading acquirer and producer of conventional conforming mortgage loans • Significant growth in market share over PMT’s more than 15-year history driven by PFSI’s Correspondent operational excellence and high service
levels Production • Provides unique ability to produce investment assets organically • MSR investments created through the securitization of conventional correspondent loan production Interest Rate Sensitive • Hedged with Agency
MBS and interest rate derivatives Strategies • Strong track record and discipline in hedging interest rate risk • Investments in credit risk on PMT’s high-quality loan production with ability to influence performance through
active servicing Credit • Expanding opportunity for investments in subordinate bonds from private label securitizations, Sensitive supported by increasing investor demand Strategies • Approximately $21.2 billion in UPB of loans
underlying PMT’s front-end GSE CRT investments at December 31, 2024 16
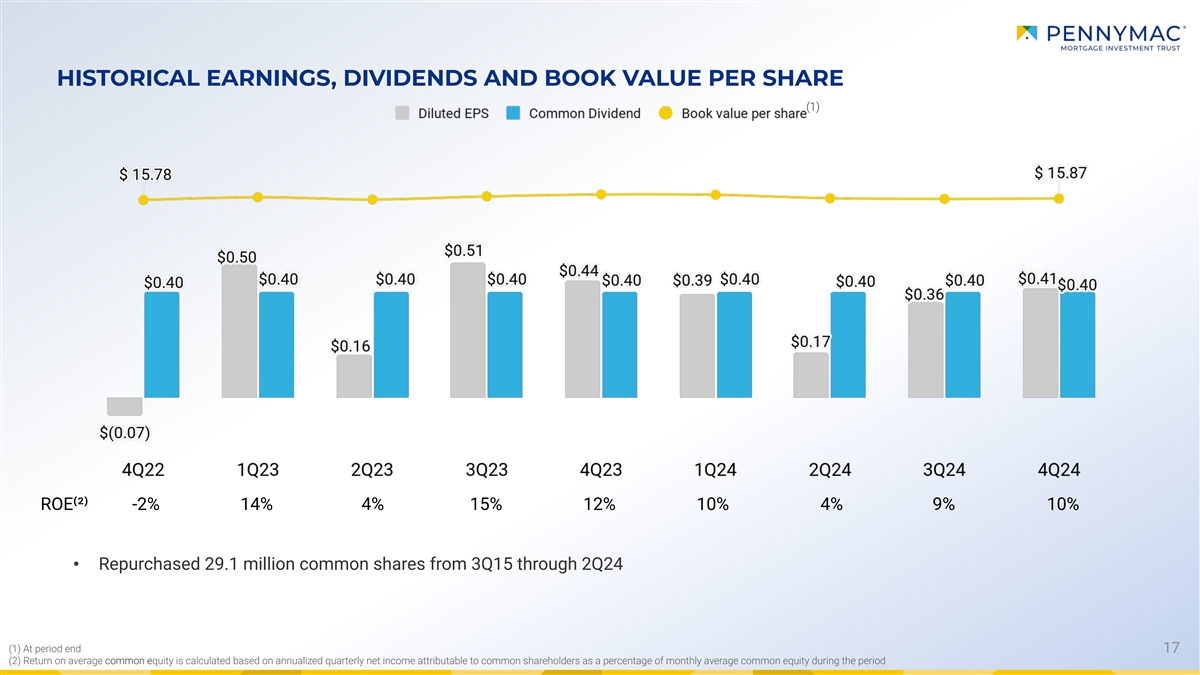
(1) At period end (2) Return on average common equity is calculated
based on annualized quarterly net income attributable to common shareholders as a percentage of monthly average common equity during the period HISTORICAL EARNINGS, DIVIDENDS AND BOOK VALUE PER SHARE (1) ROE⁽²⁾ -2% 14% 4% 15% 12%
10% 4% 9% 10% • Repurchased 29.1 million common shares from 3Q15 through 2Q24 17
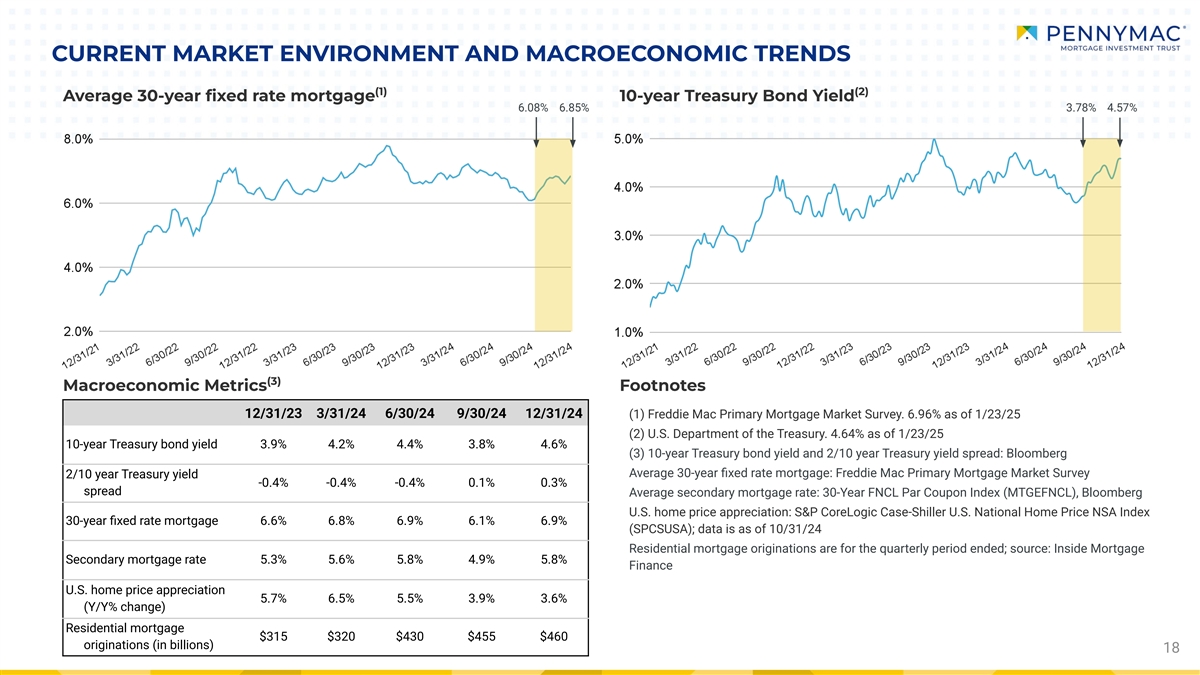
CURRENT MARKET ENVIRONMENT AND MACROECONOMIC TRENDS (1) (2) Average
30-year fixed rate mortgage 10-year Treasury Bond Yield 6.08% 6.85% 3.78% 4.57% (3) Macroeconomic Metrics Footnotes 12/31/23 3/31/24 6/30/24 9/30/24 12/31/24 (1) Freddie Mac Primary Mortgage Market Survey. 6.96% as of 1/23/25 (2) U.S.
Department of the Treasury. 4.64% as of 1/23/25 10-year Treasury bond yield 3.9% 4.2% 4.4% 3.8% 4.6% (3) 10-year Treasury bond yield and 2/10 year Treasury yield spread: Bloomberg Average 30-year fixed rate mortgage: Freddie Mac Primary
Mortgage Market Survey 2/10 year Treasury yield -0.4% -0.4% -0.4% 0.1% 0.3% spread Average secondary mortgage rate: 30-Year FNCL Par Coupon Index (MTGEFNCL), Bloomberg U.S. home price appreciation: S&P CoreLogic Case-Shiller U.S. National Home
Price NSA Index 30-year fixed rate mortgage 6.6% 6.8% 6.9% 6.1% 6.9% (SPCSUSA); data is as of 10/31/24 Residential mortgage originations are for the quarterly period ended; source: Inside Mortgage Secondary mortgage rate 5.3% 5.6% 5.8% 4.9%
5.8% Finance U.S. home price appreciation 5.7% 6.5% 5.5% 3.9% 3.6% (Y/Y% change) Residential mortgage $315 $320 $430 $455 $460 originations (in billions) 18
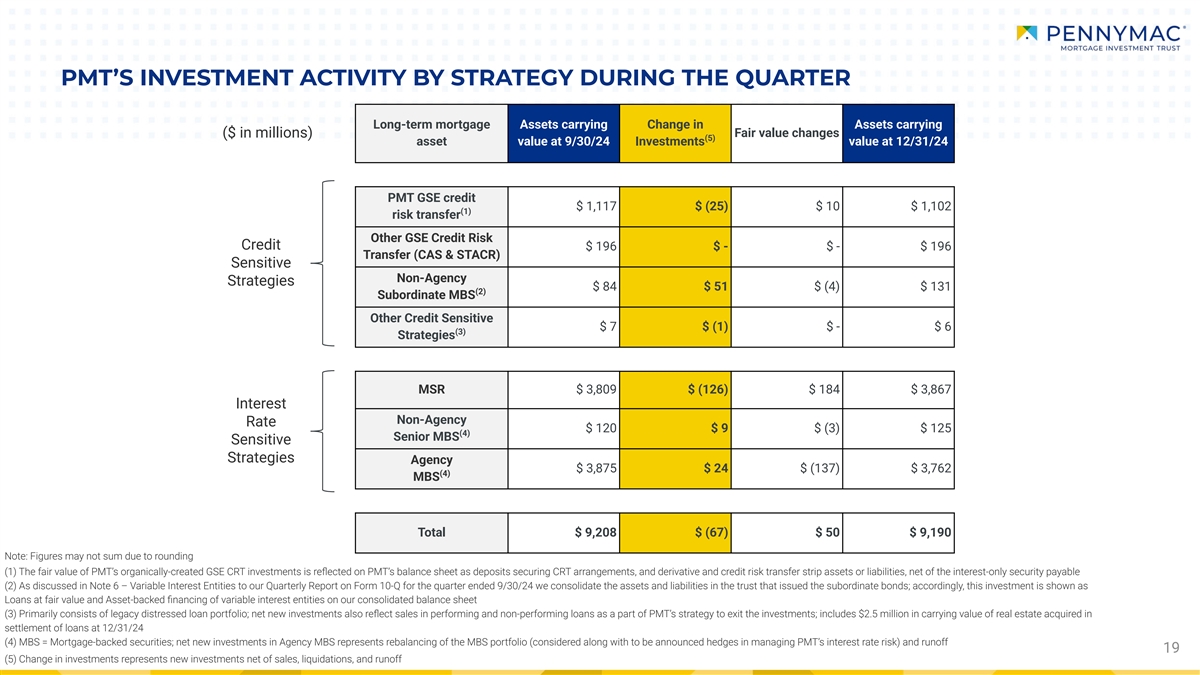
PMT’S INVESTMENT ACTIVITY BY STRATEGY DURING THE QUARTER
Long-term mortgage Assets carrying Change in Assets carrying ($ in millions) Fair value changes (5) asset value at 9/30/24 Investments value at 12/31/24 PMT GSE credit $ 1,117 $ (25) $ 10 $ 1,102 (1) risk transfer Other GSE Credit Risk Credit $ 196
$ - $ - $ 196 Transfer (CAS & STACR) Sensitive Non-Agency Strategies $ 84 $ 51 $ (4) $ 131 (2) Subordinate MBS Other Credit Sensitive $ 7 $ (1) $ - $ 6 (3) Strategies MSR $ 3,809 $ (126) $ 184 $ 3,867 Interest Non-Agency Rate $ 120 $ 9 $ (3) $
125 (4) Senior MBS Sensitive Strategies Agency $ 3,875 $ 24 $ (137) $ 3,762 (4) MBS Total $ 9,208 $ (67) $ 50 $ 9,190 Note: Figures may not sum due to rounding (1) The fair value of PMT’s organically-created GSE CRT investments is
reflected on PMT’s balance sheet as deposits securing CRT arrangements, and derivative and credit risk transfer strip assets or liabilities, net of the interest-only security payable (2) As discussed in Note 6 – Variable Interest
Entities to our Quarterly Report on Form 10-Q for the quarter ended 9/30/24 we consolidate the assets and liabilities in the trust that issued the subordinate bonds; accordingly, this investment is shown as Loans at fair value and Asset-backed
financing of variable interest entities on our consolidated balance sheet (3) Primarily consists of legacy distressed loan portfolio; net new investments also reflect sales in performing and non-performing loans as a part of PMT’s
strategy to exit the investments; includes $2.5 million in carrying value of real estate acquired in settlement of loans at 12/31/24 (4) MBS = Mortgage-backed securities; net new investments in Agency MBS represents rebalancing of the MBS portfolio
(considered along with to be announced hedges in managing PMT’s interest rate risk) and runoff 19 (5) Change in investments represents new investments net of sales, liquidations, and runoff
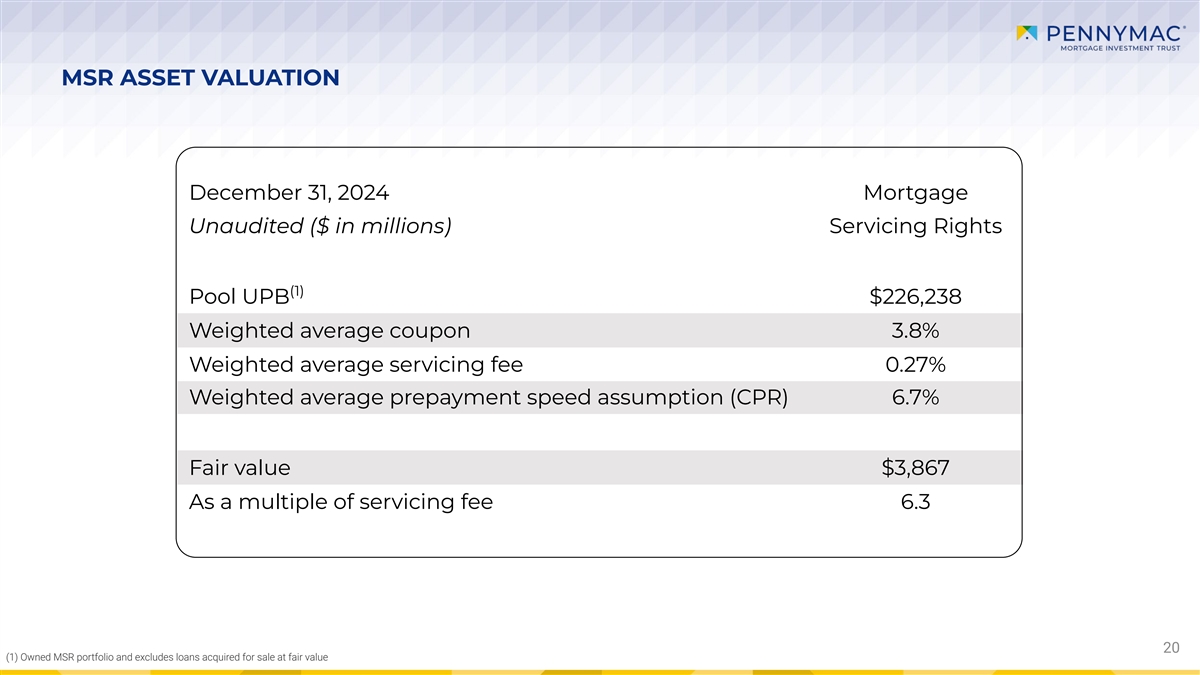
MSR ASSET VALUATION December 31, 2024 Mortgage Unaudited ($ in
millions) Servicing Rights (1) Pool UPB $226,238 Weighted average coupon 3.8% Weighted average servicing fee 0.27% Weighted average prepayment speed assumption (CPR) 6.7% Fair value $3,867 As a multiple of servicing fee 6.3 20 (1) Owned MSR
portfolio and excludes loans acquired for sale at fair value
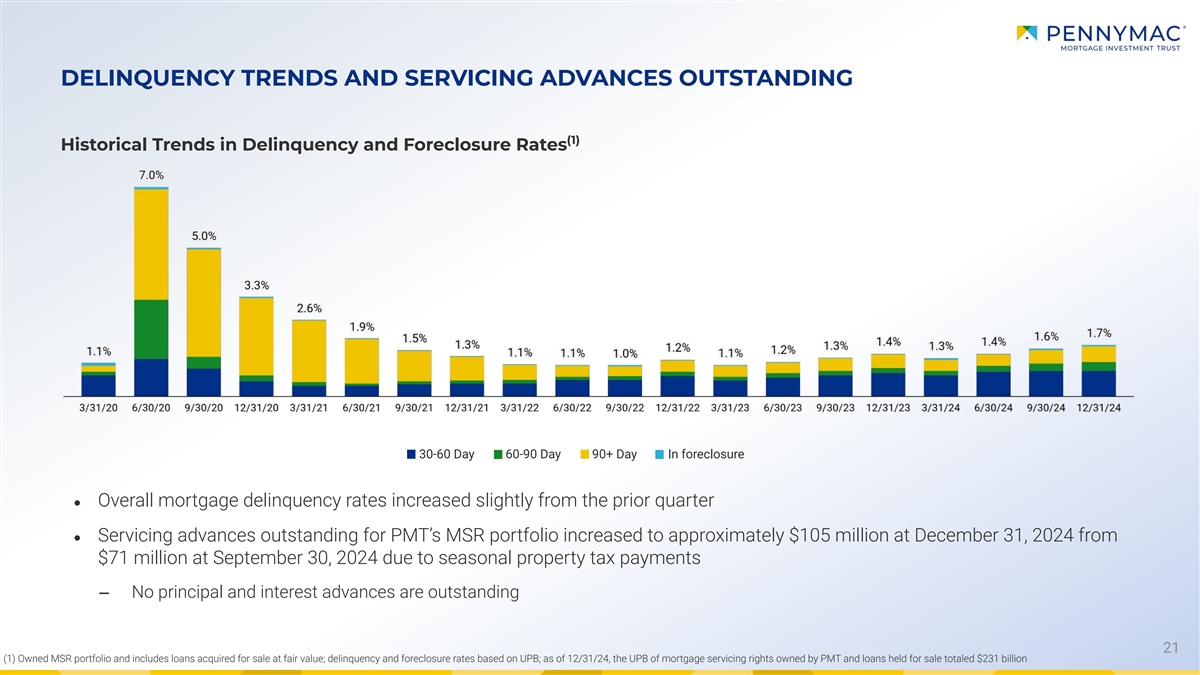
DELINQUENCY TRENDS AND SERVICING ADVANCES OUTSTANDING (1) Historical
Trends in Delinquency and Foreclosure Rates 30-60 Day 60-90 Day 90+ Day In foreclosure ● Overall mortgage delinquency rates increased slightly from the prior quarter ● Servicing advances outstanding for PMT’s MSR portfolio
increased to approximately $105 million at December 31, 2024 from $71 million at September 30, 2024 due to seasonal property tax payments ‒ No principal and interest advances are outstanding 21 (1) Owned MSR portfolio and includes loans
acquired for sale at fair value; delinquency and foreclosure rates based on UPB; as of 12/31/24, the UPB of mortgage servicing rights owned by PMT and loans held for sale totaled $231 billion
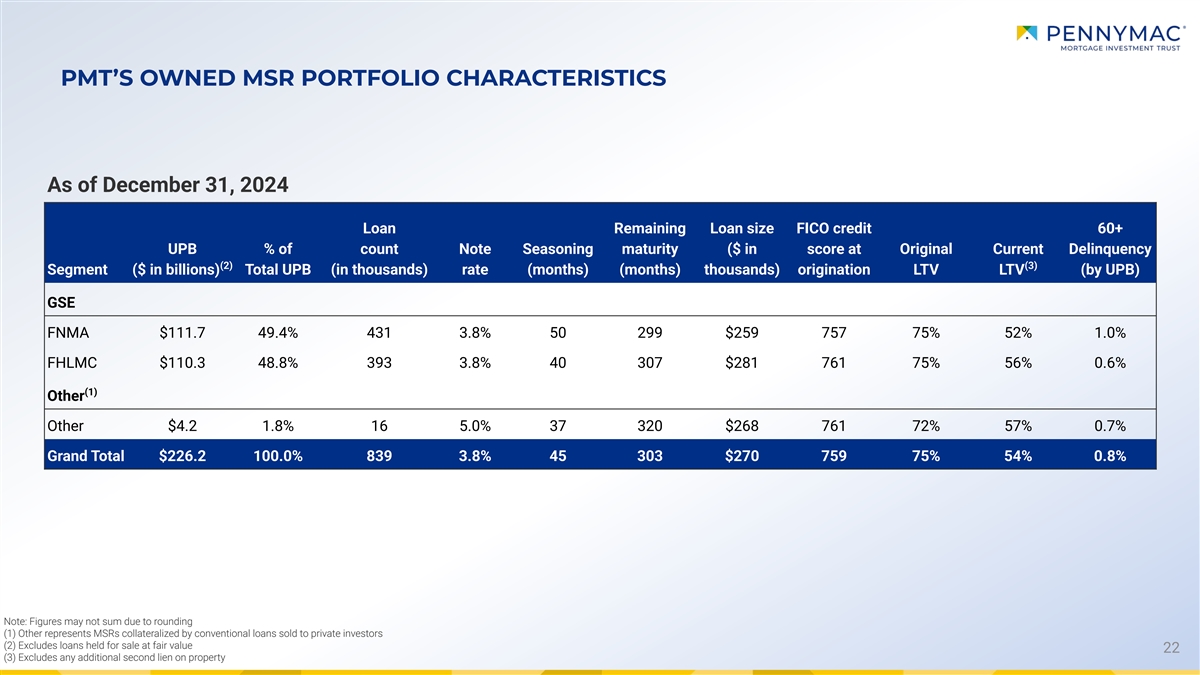
PMT’S OWNED MSR PORTFOLIO CHARACTERISTICS As of December 31, 2024
Loan Remaining Loan size FICO credit 60+ UPB % of count Note Seasoning maturity ($ in score at Original Current Delinquency (2) (3) Segment ($ in billions) Total UPB (in thousands) rate (months) (months) thousands) origination LTV LTV (by UPB) GSE
FNMA $111.7 49.4% 431 3.8% 50 299 $259 757 75% 52% 1.0% FHLMC $110.3 48.8% 393 3.8% 40 307 $281 761 75% 56% 0.6% (1) Other Other $4.2 1.8% 16 5.0% 37 320 $268 761 72% 57% 0.7% Grand Total $226.2 100.0% 839 3.8% 45 303 $270 759 75% 54% 0.8% Note:
Figures may not sum due to rounding (1) Other represents MSRs collateralized by conventional loans sold to private investors (2) Excludes loans held for sale at fair value 22 (3) Excludes any additional second lien on property
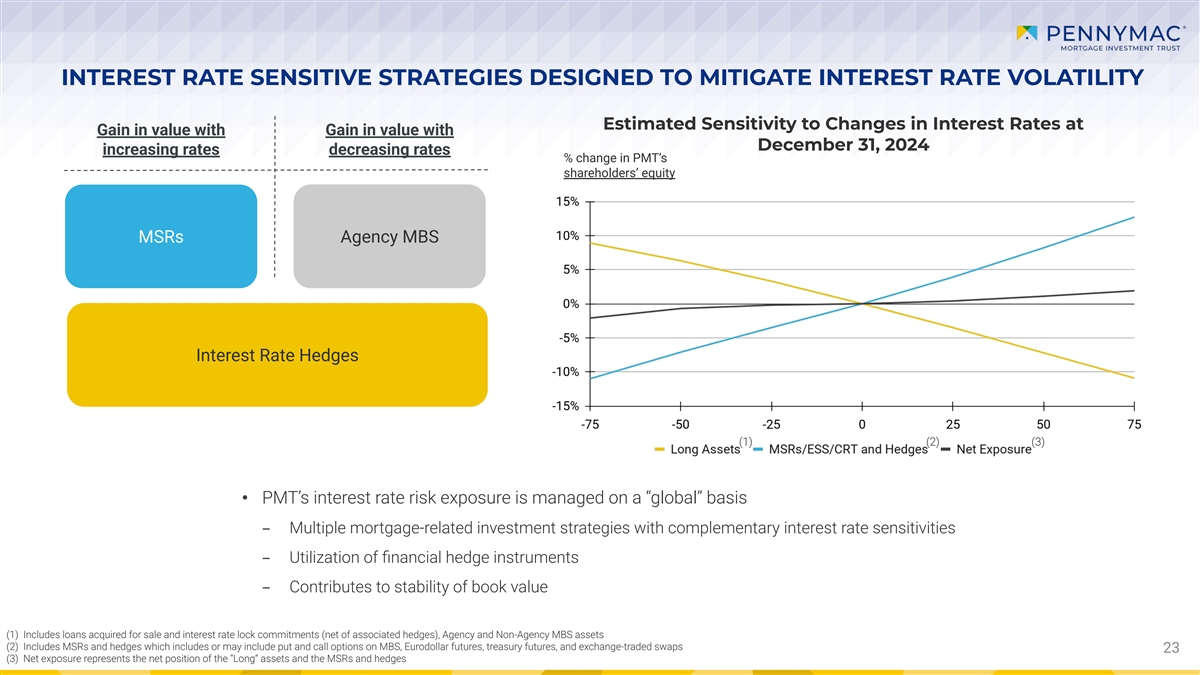
INTEREST RATE SENSITIVE STRATEGIES DESIGNED TO MITIGATE INTEREST RATE
VOLATILITY Estimated Sensitivity to Changes in Interest Rates at Gain in value with Gain in value with December 31, 2024 increasing rates decreasing rates % change in PMT’s shareholders’ equity MSRs Agency MBS Interest Rate Hedges (1)
(2) (3) • PMT’s interest rate risk exposure is managed on a “global” basis – Multiple mortgage-related investment strategies with complementary interest rate sensitivities – Utilization of financial hedge
instruments – Contributes to stability of book value (1) Includes loans acquired for sale and interest rate lock commitments (net of associated hedges), Agency and Non-Agency MBS assets (2) Includes MSRs and hedges which includes or may
include put and call options on MBS, Eurodollar futures, treasury futures, and exchange-traded swaps 23 (3) Net exposure represents the net position of the “Long” assets and the MSRs and hedges
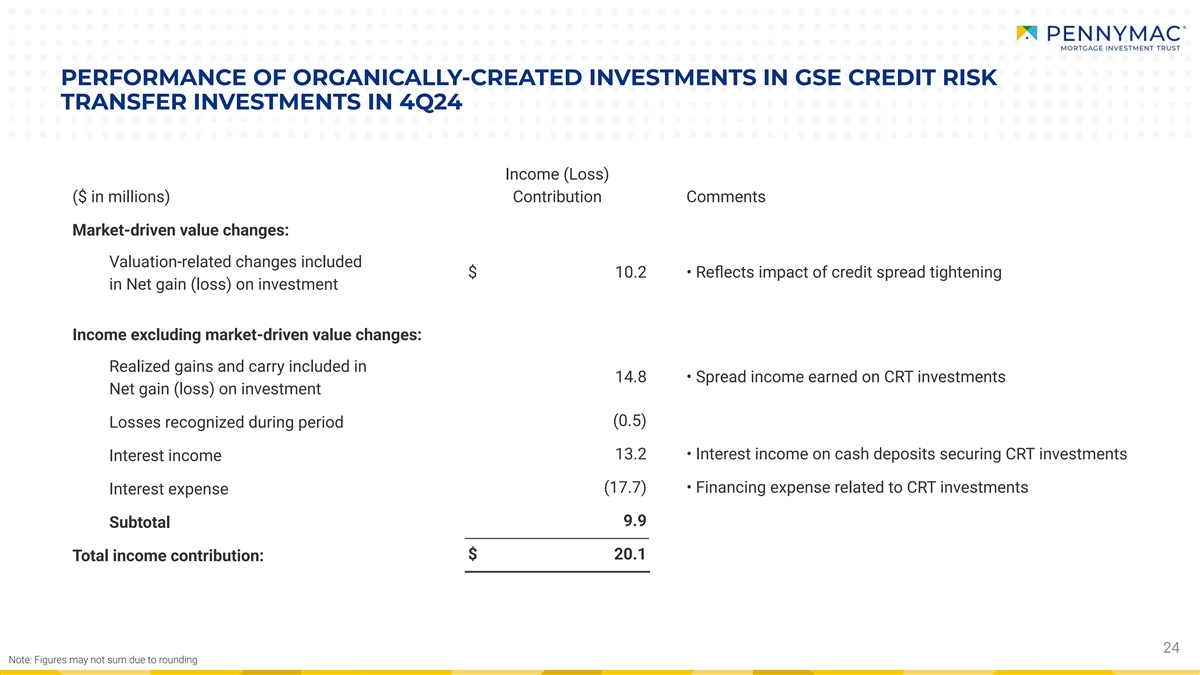
PERFORMANCE OF ORGANICALLY-CREATED INVESTMENTS IN GSE CREDIT RISK
TRANSFER INVESTMENTS IN 4Q24 Income (Loss) ($ in millions) Contribution Comments Market-driven value changes: Valuation-related changes included $ 10.2 • Reflects impact of credit spread tightening in Net gain (loss) on investment Income
excluding market-driven value changes: Realized gains and carry included in 14.8 • Spread income earned on CRT investments Net gain (loss) on investment (0.5) Losses recognized during period 13.2 • Interest income on cash deposits
securing CRT investments Interest income (17.7) • Financing expense related to CRT investments Interest expense 9.9 Subtotal $ 20.1 Total income contribution: 24 Note: Figures may not sum due to rounding
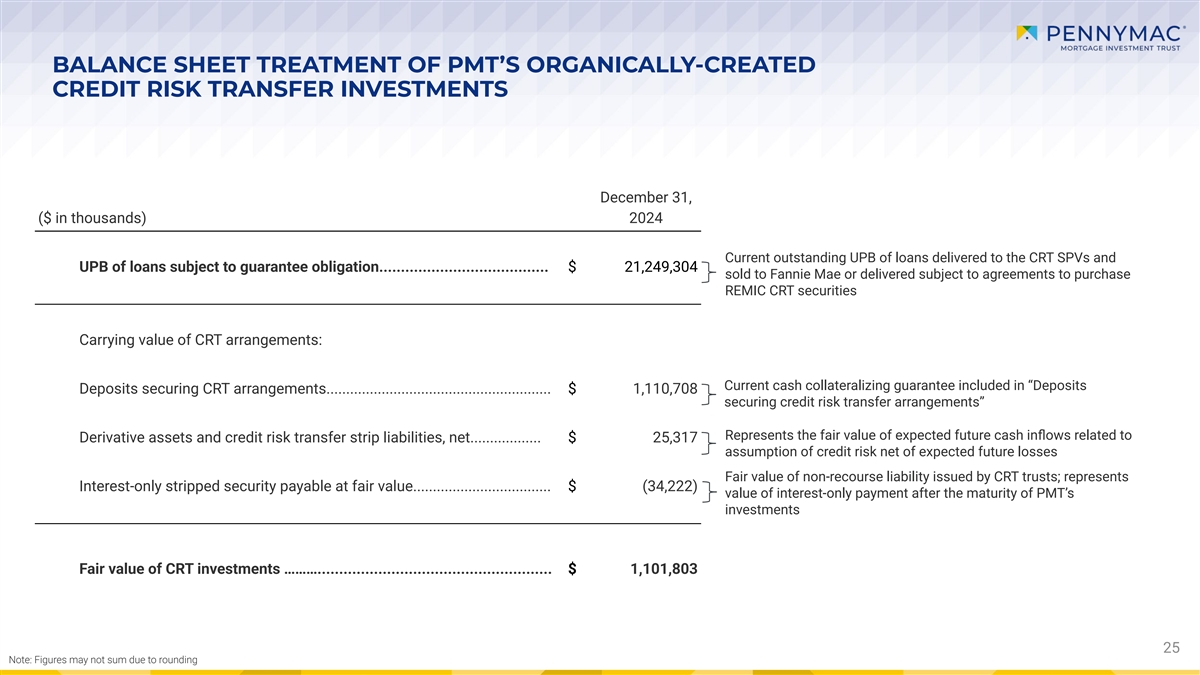
BALANCE SHEET TREATMENT OF PMT’S ORGANICALLY-CREATED CREDIT RISK
TRANSFER INVESTMENTS December 31, ($ in thousands) 2024 Current outstanding UPB of loans delivered to the CRT SPVs and UPB of loans subject to guarantee obligation....................................... $ 21,249,304 sold to Fannie Mae or delivered
subject to agreements to purchase REMIC CRT securities Carrying value of CRT arrangements: Current cash collateralizing guarantee included in “Deposits Deposits securing CRT arrangements.........................................................
$ 1,110,708 securing credit risk transfer arrangements” Represents the fair value of expected future cash inflows related to Derivative assets and credit risk transfer strip liabilities, net.................. $ 25,317 assumption of
credit risk net of expected future losses Fair value of non-recourse liability issued by CRT trusts; represents Interest-only stripped security payable at fair value................................... $ (34,222) value of interest-only payment after
the maturity of PMT’s investments Fair value of CRT investments ………...................................................... $ 1,101,803 25 Note: Figures may not sum due to rounding
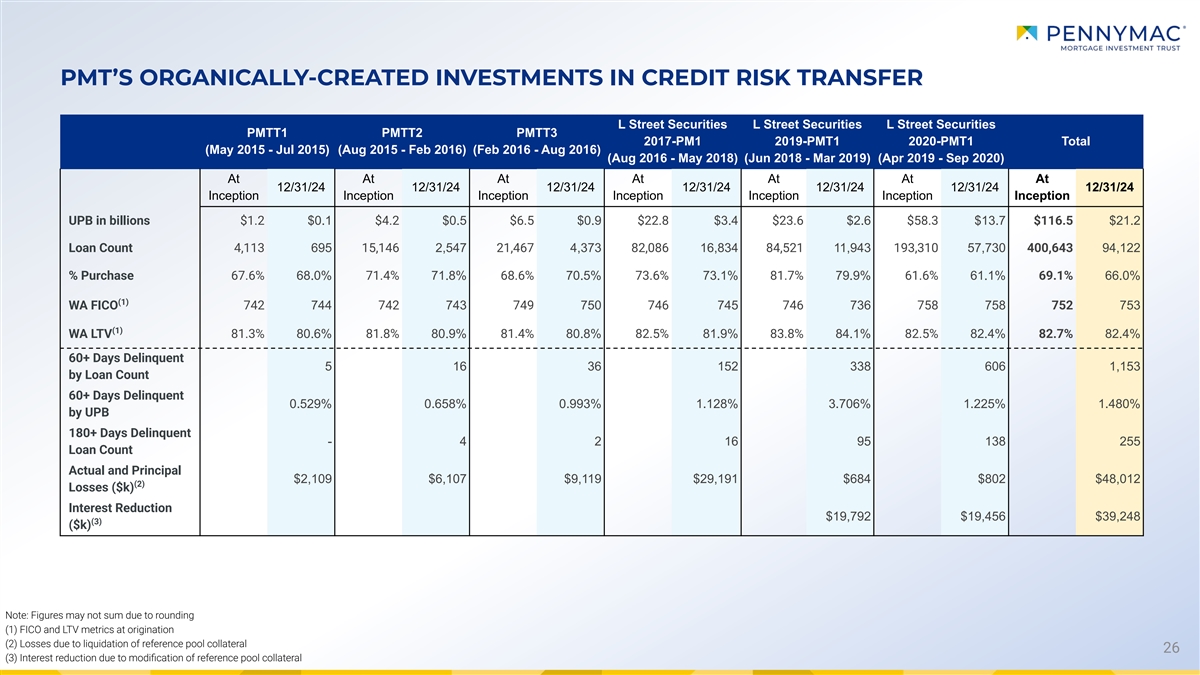
PMT’S ORGANICALLY-CREATED INVESTMENTS IN CREDIT RISK TRANSFER L
Street Securities L Street Securities L Street Securities PMTT1 PMTT2 PMTT3 2017-PM1 2019-PMT1 2020-PMT1 Total (May 2015 - Jul 2015) (Aug 2015 - Feb 2016) (Feb 2016 - Aug 2016) (Aug 2016 - May 2018) (Jun 2018 - Mar 2019) (Apr 2019 - Sep 2020) At At
At At At At At 12/31/24 12/31/24 12/31/24 12/31/24 12/31/24 12/31/24 12/31/24 Inception Inception Inception Inception Inception Inception Inception UPB in billions $1.2 $0.1 $4.2 $0.5 $6.5 $0.9 $22.8 $3.4 $23.6 $2.6 $58.3 $13.7 $116.5 $21.2 Loan
Count 4,113 695 15,146 2,547 21,467 4,373 82,086 16,834 84,521 11,943 193,310 57,730 400,643 94,122 % Purchase 67.6% 68.0% 71.4% 71.8% 68.6% 70.5% 73.6% 73.1% 81.7% 79.9% 61.6% 61.1% 69.1% 66.0% (1) WA FICO 742 744 742 743 749 750 746 745 746 736
758 758 752 753 (1) WA LTV 81.3% 80.6% 81.8% 80.9% 81.4% 80.8% 82.5% 81.9% 83.8% 84.1% 82.5% 82.4% 82.7% 82.4% 60+ Days Delinquent 5 16 36 152 338 606 1,153 by Loan Count 60+ Days Delinquent 0.529% 0.658% 0.993% 1.128% 3.706% 1.225% 1.480% by UPB
180+ Days Delinquent - 4 2 16 95 138 255 Loan Count Actual and Principal $2,109 $6,107 $9,119 $29,191 $684 $802 $48,012 (2) Losses ($k) Interest Reduction $19,792 $19,456 $39,248 (3) ($k) Note: Figures may not sum due to rounding (1) FICO and LTV
metrics at origination (2) Losses due to liquidation of reference pool collateral 26 (3) Interest reduction due to modification of reference pool collateral
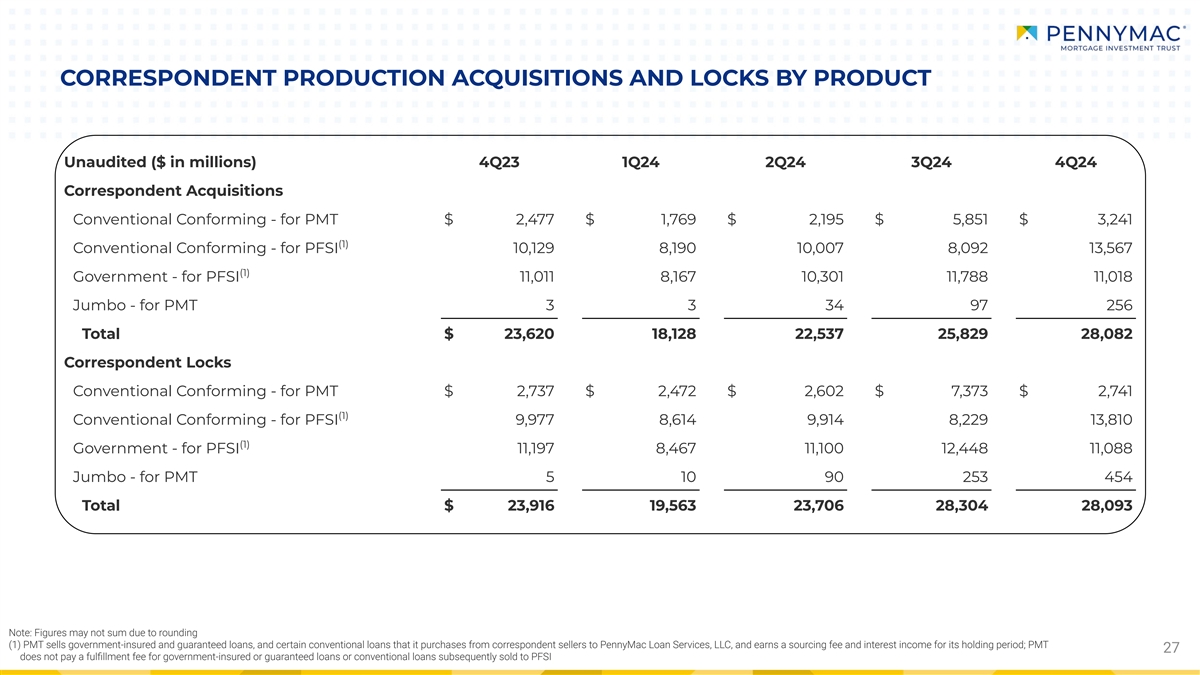
CORRESPONDENT PRODUCTION ACQUISITIONS AND LOCKS BY PRODUCT Unaudited ($
in millions) 4Q23 1Q24 2Q24 3Q24 4Q24 Correspondent Acquisitions Conventional Conforming - for PMT $ 2,477 $ 1,769 $ 2,195 $ 5,851 $ 3,241 (1) Conventional Conforming - for PFSI 10,129 8,190 10,007 8,092 13,567 (1) Government - for PFSI 11,011 8,167
10,301 11,788 11,018 Jumbo - for PMT 3 3 34 97 256 Total $ 23,620 18,128 22,537 25,829 28,082 Correspondent Locks Conventional Conforming - for PMT $ 2,737 $ 2,472 $ 2,602 $ 7,373 $ 2,741 (1) Conventional Conforming - for PFSI 9,977 8,614 9,914
8,229 13,810 (1) Government - for PFSI 11,197 8,467 11,100 12,448 11,088 Jumbo - for PMT 5 10 90 253 454 Total $ 23,916 19,563 23,706 28,304 28,093 Note: Figures may not sum due to rounding (1) PMT sells government-insured and guaranteed loans, and
certain conventional loans that it purchases from correspondent sellers to PennyMac Loan Services, LLC, and earns a sourcing fee and interest income for its holding period; PMT 27 does not pay a fulfillment fee for government-insured or
guaranteed loans or conventional loans subsequently sold to PFSI

28
v3.24.4
Document and Entity Information
|
Jan. 30, 2025 |
| Document And Entity Information [Line Items] |
|
| Amendment Flag |
false
|
| Entity Central Index Key |
0001464423
|
| Document Type |
8-K
|
| Document Period End Date |
Jan. 30, 2025
|
| Entity Registrant Name |
PennyMac Mortgage Investment Trust
|
| Entity Incorporation State Country Code |
MD
|
| Entity File Number |
001-34416
|
| Entity Tax Identification Number |
27-0186273
|
| Entity Address, Address Line One |
3043 Townsgate Road
|
| Entity Address, City or Town |
Westlake Village
|
| Entity Address, State or Province |
CA
|
| Entity Address, Postal Zip Code |
91361
|
| City Area Code |
(818)
|
| Local Phone Number |
224-7442
|
| Written Communications |
false
|
| Soliciting Material |
false
|
| Pre Commencement Tender Offer |
false
|
| Pre Commencement Issuer Tender Offer |
false
|
| Entity Emerging Growth Company |
false
|
| Common Stock [Member] |
|
| Document And Entity Information [Line Items] |
|
| Security 12b Title |
Common Shares of Beneficial Interest, $0.01 par value
|
| Trading Symbol |
PMT
|
| Security Exchange Name |
NYSE
|
| Series A Preferred Stock [Member] |
|
| Document And Entity Information [Line Items] |
|
| Security 12b Title |
8.125% Series A Cumulative Redeemable Preferred Shares of Beneficial Interest, $0.01 par value
|
| Trading Symbol |
PMT/PA
|
| Security Exchange Name |
NYSE
|
| Series B Preferred Stock [Member] |
|
| Document And Entity Information [Line Items] |
|
| Security 12b Title |
8.00% Series B Cumulative Redeemable Preferred Shares of Beneficial Interest, $0.01 par value
|
| Trading Symbol |
PMT/PB
|
| Security Exchange Name |
NYSE
|
| Series C Preferred Stock [Member] |
|
| Document And Entity Information [Line Items] |
|
| Security 12b Title |
6.75% Series C Cumulative Redeemable Preferred Shares of Beneficial Interest, $0.01 par value
|
| Trading Symbol |
PMT/PC
|
| Security Exchange Name |
NYSE
|
| Senior Notes [Member] |
|
| Document And Entity Information [Line Items] |
|
| Security 12b Title |
8.50% Senior Note Due 2028
|
| Trading Symbol |
PMTU
|
| Security Exchange Name |
NYSE
|
| X |
- DefinitionBoolean flag that is true when the XBRL content amends previously-filed or accepted submission.
| Name: |
dei_AmendmentFlag |
| Namespace Prefix: |
dei_ |
| Data Type: |
xbrli:booleanItemType |
| Balance Type: |
na |
| Period Type: |
duration |
|
| X |
- DefinitionFor the EDGAR submission types of Form 8-K: the date of the report, the date of the earliest event reported; for the EDGAR submission types of Form N-1A: the filing date; for all other submission types: the end of the reporting or transition period. The format of the date is YYYY-MM-DD.
| Name: |
dei_DocumentPeriodEndDate |
| Namespace Prefix: |
dei_ |
| Data Type: |
xbrli:dateItemType |
| Balance Type: |
na |
| Period Type: |
duration |
|
| X |
- DefinitionThe type of document being provided (such as 10-K, 10-Q, 485BPOS, etc). The document type is limited to the same value as the supporting SEC submission type, or the word 'Other'.
| Name: |
dei_DocumentType |
| Namespace Prefix: |
dei_ |
| Data Type: |
dei:submissionTypeItemType |
| Balance Type: |
na |
| Period Type: |
duration |
|
| X |
- DefinitionAddress Line 1 such as Attn, Building Name, Street Name
| Name: |
dei_EntityAddressAddressLine1 |
| Namespace Prefix: |
dei_ |
| Data Type: |
xbrli:normalizedStringItemType |
| Balance Type: |
na |
| Period Type: |
duration |
|
| X |
- Definition
+ References
+ Details
| Name: |
dei_EntityAddressCityOrTown |
| Namespace Prefix: |
dei_ |
| Data Type: |
xbrli:normalizedStringItemType |
| Balance Type: |
na |
| Period Type: |
duration |
|
| X |
- DefinitionCode for the postal or zip code
| Name: |
dei_EntityAddressPostalZipCode |
| Namespace Prefix: |
dei_ |
| Data Type: |
xbrli:normalizedStringItemType |
| Balance Type: |
na |
| Period Type: |
duration |
|
| X |
- DefinitionName of the state or province.
| Name: |
dei_EntityAddressStateOrProvince |
| Namespace Prefix: |
dei_ |
| Data Type: |
dei:stateOrProvinceItemType |
| Balance Type: |
na |
| Period Type: |
duration |
|
| X |
- DefinitionA unique 10-digit SEC-issued value to identify entities that have filed disclosures with the SEC. It is commonly abbreviated as CIK. Reference 1: http://www.xbrl.org/2003/role/presentationRef
-Publisher SEC
-Name Exchange Act
-Number 240
-Section 12
-Subsection b-2
| Name: |
dei_EntityCentralIndexKey |
| Namespace Prefix: |
dei_ |
| Data Type: |
dei:centralIndexKeyItemType |
| Balance Type: |
na |
| Period Type: |
duration |
|
| X |
- DefinitionIndicate if registrant meets the emerging growth company criteria. Reference 1: http://www.xbrl.org/2003/role/presentationRef
-Publisher SEC
-Name Exchange Act
-Number 240
-Section 12
-Subsection b-2
| Name: |
dei_EntityEmergingGrowthCompany |
| Namespace Prefix: |
dei_ |
| Data Type: |
xbrli:booleanItemType |
| Balance Type: |
na |
| Period Type: |
duration |
|
| X |
- DefinitionCommission file number. The field allows up to 17 characters. The prefix may contain 1-3 digits, the sequence number may contain 1-8 digits, the optional suffix may contain 1-4 characters, and the fields are separated with a hyphen.
| Name: |
dei_EntityFileNumber |
| Namespace Prefix: |
dei_ |
| Data Type: |
dei:fileNumberItemType |
| Balance Type: |
na |
| Period Type: |
duration |
|
| X |
- DefinitionTwo-character EDGAR code representing the state or country of incorporation.
| Name: |
dei_EntityIncorporationStateCountryCode |
| Namespace Prefix: |
dei_ |
| Data Type: |
dei:edgarStateCountryItemType |
| Balance Type: |
na |
| Period Type: |
duration |
|
| X |
- DefinitionThe exact name of the entity filing the report as specified in its charter, which is required by forms filed with the SEC. Reference 1: http://www.xbrl.org/2003/role/presentationRef
-Publisher SEC
-Name Exchange Act
-Number 240
-Section 12
-Subsection b-2
| Name: |
dei_EntityRegistrantName |
| Namespace Prefix: |
dei_ |
| Data Type: |
xbrli:normalizedStringItemType |
| Balance Type: |
na |
| Period Type: |
duration |
|
| X |
- DefinitionThe Tax Identification Number (TIN), also known as an Employer Identification Number (EIN), is a unique 9-digit value assigned by the IRS. Reference 1: http://www.xbrl.org/2003/role/presentationRef
-Publisher SEC
-Name Exchange Act
-Number 240
-Section 12
-Subsection b-2
| Name: |
dei_EntityTaxIdentificationNumber |
| Namespace Prefix: |
dei_ |
| Data Type: |
dei:employerIdItemType |
| Balance Type: |
na |
| Period Type: |
duration |
|
| X |
- DefinitionLocal phone number for entity.
| Name: |
dei_LocalPhoneNumber |
| Namespace Prefix: |
dei_ |
| Data Type: |
xbrli:normalizedStringItemType |
| Balance Type: |
na |
| Period Type: |
duration |
|
| X |
- DefinitionBoolean flag that is true when the Form 8-K filing is intended to satisfy the filing obligation of the registrant as pre-commencement communications pursuant to Rule 13e-4(c) under the Exchange Act. Reference 1: http://www.xbrl.org/2003/role/presentationRef
-Publisher SEC
-Name Exchange Act
-Number 240
-Section 13e
-Subsection 4c
| Name: |
dei_PreCommencementIssuerTenderOffer |
| Namespace Prefix: |
dei_ |
| Data Type: |
xbrli:booleanItemType |
| Balance Type: |
na |
| Period Type: |
duration |
|
| X |
- DefinitionBoolean flag that is true when the Form 8-K filing is intended to satisfy the filing obligation of the registrant as pre-commencement communications pursuant to Rule 14d-2(b) under the Exchange Act. Reference 1: http://www.xbrl.org/2003/role/presentationRef
-Publisher SEC
-Name Exchange Act
-Number 240
-Section 14d
-Subsection 2b
| Name: |
dei_PreCommencementTenderOffer |
| Namespace Prefix: |
dei_ |
| Data Type: |
xbrli:booleanItemType |
| Balance Type: |
na |
| Period Type: |
duration |
|
| X |
- DefinitionTitle of a 12(b) registered security. Reference 1: http://www.xbrl.org/2003/role/presentationRef
-Publisher SEC
-Name Exchange Act
-Number 240
-Section 12
-Subsection b
| Name: |
dei_Security12bTitle |
| Namespace Prefix: |
dei_ |
| Data Type: |
dei:securityTitleItemType |
| Balance Type: |
na |
| Period Type: |
duration |
|
| X |
- DefinitionName of the Exchange on which a security is registered. Reference 1: http://www.xbrl.org/2003/role/presentationRef
-Publisher SEC
-Name Exchange Act
-Number 240
-Section 12
-Subsection d1-1
| Name: |
dei_SecurityExchangeName |
| Namespace Prefix: |
dei_ |
| Data Type: |
dei:edgarExchangeCodeItemType |
| Balance Type: |
na |
| Period Type: |
duration |
|
| X |
- DefinitionBoolean flag that is true when the Form 8-K filing is intended to satisfy the filing obligation of the registrant as soliciting material pursuant to Rule 14a-12 under the Exchange Act. Reference 1: http://www.xbrl.org/2003/role/presentationRef
-Publisher SEC
-Name Exchange Act
-Number 240
-Section 14a
-Subsection 12
| Name: |
dei_SolicitingMaterial |
| Namespace Prefix: |
dei_ |
| Data Type: |
xbrli:booleanItemType |
| Balance Type: |
na |
| Period Type: |
duration |
|
| X |
- DefinitionTrading symbol of an instrument as listed on an exchange.
| Name: |
dei_TradingSymbol |
| Namespace Prefix: |
dei_ |
| Data Type: |
dei:tradingSymbolItemType |
| Balance Type: |
na |
| Period Type: |
duration |
|
| X |
- DefinitionBoolean flag that is true when the Form 8-K filing is intended to satisfy the filing obligation of the registrant as written communications pursuant to Rule 425 under the Securities Act. Reference 1: http://www.xbrl.org/2003/role/presentationRef
-Publisher SEC
-Name Securities Act
-Number 230
-Section 425
| Name: |
dei_WrittenCommunications |
| Namespace Prefix: |
dei_ |
| Data Type: |
xbrli:booleanItemType |
| Balance Type: |
na |
| Period Type: |
duration |
|
| X |
- Details
| Name: |
us-gaap_StatementClassOfStockAxis=us-gaap_CommonStockMember |
| Namespace Prefix: |
|
| Data Type: |
na |
| Balance Type: |
|
| Period Type: |
|
|
| X |
- Details
| Name: |
us-gaap_StatementClassOfStockAxis=us-gaap_SeriesAPreferredStockMember |
| Namespace Prefix: |
|
| Data Type: |
na |
| Balance Type: |
|
| Period Type: |
|
|
| X |
- Details
| Name: |
us-gaap_StatementClassOfStockAxis=us-gaap_SeriesBPreferredStockMember |
| Namespace Prefix: |
|
| Data Type: |
na |
| Balance Type: |
|
| Period Type: |
|
|
| X |
- Details
| Name: |
us-gaap_StatementClassOfStockAxis=us-gaap_SeriesCPreferredStockMember |
| Namespace Prefix: |
|
| Data Type: |
na |
| Balance Type: |
|
| Period Type: |
|
|
| X |
- Details
| Name: |
us-gaap_StatementClassOfStockAxis=us-gaap_SeniorNotesMember |
| Namespace Prefix: |
|
| Data Type: |
na |
| Balance Type: |
|
| Period Type: |
|
|
PennyMac Mortgage Invest... (NYSE:PMTU)
Historical Stock Chart
From Jan 2025 to Feb 2025

PennyMac Mortgage Invest... (NYSE:PMTU)
Historical Stock Chart
From Feb 2024 to Feb 2025

