0001746119
false
FY
No
0001746119
2022-08-01
2023-07-31
0001746119
2023-01-31
0001746119
2023-07-31
0001746119
2022-07-31
0001746119
us-gaap:RelatedPartyMember
2023-07-31
0001746119
us-gaap:RelatedPartyMember
2022-07-31
0001746119
MUGH:ThirdPartyMember
2023-07-31
0001746119
MUGH:ThirdPartyMember
2022-07-31
0001746119
2021-08-01
2022-07-31
0001746119
us-gaap:CommonStockMember
2021-07-31
0001746119
us-gaap:AdditionalPaidInCapitalMember
2021-07-31
0001746119
us-gaap:AccumulatedOtherComprehensiveIncomeMember
2021-07-31
0001746119
us-gaap:RetainedEarningsMember
2021-07-31
0001746119
2021-07-31
0001746119
us-gaap:CommonStockMember
2022-07-31
0001746119
us-gaap:AdditionalPaidInCapitalMember
2022-07-31
0001746119
us-gaap:AccumulatedOtherComprehensiveIncomeMember
2022-07-31
0001746119
us-gaap:RetainedEarningsMember
2022-07-31
0001746119
us-gaap:CommonStockMember
2021-08-01
2022-07-31
0001746119
us-gaap:AdditionalPaidInCapitalMember
2021-08-01
2022-07-31
0001746119
us-gaap:AccumulatedOtherComprehensiveIncomeMember
2021-08-01
2022-07-31
0001746119
us-gaap:RetainedEarningsMember
2021-08-01
2022-07-31
0001746119
us-gaap:CommonStockMember
2022-08-01
2023-07-31
0001746119
us-gaap:AdditionalPaidInCapitalMember
2022-08-01
2023-07-31
0001746119
us-gaap:AccumulatedOtherComprehensiveIncomeMember
2022-08-01
2023-07-31
0001746119
us-gaap:RetainedEarningsMember
2022-08-01
2023-07-31
0001746119
us-gaap:CommonStockMember
2023-07-31
0001746119
us-gaap:AdditionalPaidInCapitalMember
2023-07-31
0001746119
us-gaap:AccumulatedOtherComprehensiveIncomeMember
2023-07-31
0001746119
us-gaap:RetainedEarningsMember
2023-07-31
0001746119
MUGH:MUWorldwideGroupLimitedMember
2018-06-28
2018-06-29
0001746119
MUGH:CovidNineteenMember
2019-08-01
2020-07-31
0001746119
MUGH:CovidNineteenMember
2021-04-07
2021-04-08
0001746119
MUGH:MUWorldwideGroupLimitedMember
2022-08-01
2023-07-31
0001746119
MUGH:MUWorldwideGroupLimitedMember
2023-07-31
0001746119
MUGH:MUGlobalHoldingLimitedMember
2022-08-01
2023-07-31
0001746119
MUGH:MUGlobalHoldingLimitedMember
2023-07-31
0001746119
MUGH:MUGlobalHealthManagementShanghaiLimitedMember
2022-08-01
2023-07-31
0001746119
MUGH:MUGlobalHealthManagementShanghaiLimitedMember
2023-07-31
0001746119
MUGH:LeasableEquipmentMember
2023-07-31
0001746119
us-gaap:ComputerEquipmentMember
2023-07-31
0001746119
MUGH:OutletEquipmentMember
2023-07-31
0001746119
MUGH:OutletDesignFeeAndEquipmentMember
2023-07-31
0001746119
MUGH:ApplicationDevelopmentFeeMember
2023-07-31
0001746119
MUGH:YearEndRMBUSDollarExchangeRateMember
2023-07-31
0001746119
MUGH:YearEndRMBUSDollarExchangeRateMember
2022-07-31
0001746119
MUGH:YearAverageRMBUSDollarExchangeRateMember
2023-07-31
0001746119
MUGH:YearAverageRMBUSDollarExchangeRateMember
2022-07-31
0001746119
MUGH:YearEndHKUSDollarExchangeRateMember
2023-07-31
0001746119
MUGH:YearEndHKUSDollarExchangeRateMember
2022-07-31
0001746119
MUGH:YearAverageHKUSDollarExchangeRateMember
2023-07-31
0001746119
MUGH:YearAverageHKUSDollarExchangeRateMember
2022-07-31
0001746119
MUGH:YearEndTWDUSDollarExchangeRateMember
2023-07-31
0001746119
MUGH:YearEndTWDUSDollarExchangeRateMember
2022-07-31
0001746119
MUGH:YearAverageTWDUSDollarExchangeRateMember
2023-07-31
0001746119
MUGH:YearAverageTWDUSDollarExchangeRateMember
2022-07-31
0001746119
MUGH:MsNiuYenYenMember
2018-06-04
2018-06-04
0001746119
MUGH:MsNiuYenYenMember
2018-06-04
0001746119
MUGH:MsNiuYenYenMember
2018-07-06
2018-07-06
0001746119
MUGH:ServerIntlCoLtdMember
2018-07-06
2018-07-06
0001746119
MUGH:MsNiuYenYenMember
2018-07-06
0001746119
MUGH:ServerIntlCoLtdMember
MUGH:MsNiuYenYenMember
2018-07-06
2018-07-06
0001746119
MUGH:ChangChunYingMember
2018-07-07
2018-07-07
0001746119
MUGH:ChangSuFenMember
2018-07-07
2018-07-07
0001746119
MUGH:ChangSuFenMember
2018-07-07
0001746119
MUGH:ChangChunYingAndChangSuFenMember
2018-07-07
2018-07-07
0001746119
MUGH:GreenProAsiaStrategicSPCMember
2018-07-09
2018-07-09
0001746119
MUGH:GreenProVentureCapitalLimitedMember
2018-07-09
2018-07-09
0001746119
MUGH:GreenProVentureCapitalLimitedMember
2018-07-09
0001746119
MUGH:ThreeNonUSResidentsMember
2018-07-09
2018-07-10
0001746119
MUGH:ThreeNonUSResidentsMember
2018-07-10
0001746119
MUGH:EightNonUSResidentsMember
2018-07-09
2018-07-10
0001746119
MUGH:TwoNonUSResidentsMember
2018-07-11
2018-07-11
0001746119
MUGH:TwoNonUSResidentsMember
2018-07-11
0001746119
MUGH:TenNonUSResidentsMember
2018-07-25
2018-07-25
0001746119
MUGH:TenNonUSResidentsMember
2018-07-25
0001746119
MUGH:OneNonUSResidentsMember
2018-07-26
2018-07-26
0001746119
MUGH:OneNonUSResidentsMember
2018-07-26
0001746119
MUGH:DezignFormatPteLtdandChengYoungChienMember
2018-07-31
2018-07-31
0001746119
MUGH:DezignFormatPteLtdandChengYoungChienMember
2018-07-31
0001746119
MUGH:SixteenNonUSResidentsMember
2018-08-01
2018-12-13
0001746119
MUGH:FourtyFiveAccreditedInvestorsMember
2019-05-07
2019-05-07
0001746119
MUGH:FourtyFiveAccreditedInvestorsMember
2019-05-07
0001746119
MUGH:ThirtySixNonUSResidentsMember
us-gaap:IPOMember
2019-05-14
2019-07-31
0001746119
MUGH:ThirtySixNonUSResidentsMember
us-gaap:IPOMember
2019-07-31
0001746119
MUGH:ThreeNonUSResidentsMember
2020-08-01
2021-07-31
0001746119
MUGH:TwentyNonUSResidentsMember
2020-08-01
2021-07-31
0001746119
MUGH:TwoNonUSResidentsMember
2021-08-01
2022-07-31
0001746119
MUGH:ThreeNonUSResidentsMember
2021-08-01
2022-07-31
0001746119
MUGH:ThreeNonUSResidentsMember
2022-08-01
2023-07-31
0001746119
us-gaap:ComputerEquipmentMember
2022-07-31
0001746119
us-gaap:OfficeEquipmentMember
2023-07-31
0001746119
us-gaap:OfficeEquipmentMember
2022-07-31
0001746119
MUGH:LeasableEquipmentMember
2022-07-31
0001746119
MUGH:OutletDesignFeeAndEquipmentMember
2022-07-31
0001746119
MUGH:ApplicationDevelopmentFeeMember
2022-07-31
0001746119
MUGH:LeasableEquipmentMember
2022-08-01
2023-07-31
0001746119
us-gaap:AccountingStandardsUpdate201602Member
2021-11-06
0001746119
MUGH:TienMuInternationalCoLtdMember
2023-07-31
0001746119
MUGH:TienMuInternationalCoLtdMember
2022-07-31
0001746119
MUGH:HongTingNetworkTechnologyXiamenLimitedMember
2023-07-31
0001746119
MUGH:HongTingNetworkTechnologyXiamenLimitedMember
2022-07-31
0001746119
MUGH:ShangHaiShiBaEnterpriseManagementCentreMember
2023-07-31
0001746119
MUGH:ShangHaiShiBaEnterpriseManagementCentreMember
2022-07-31
0001746119
MUGH:HsiehChangChungMember
2023-07-31
0001746119
MUGH:HsiehChangChungMember
2022-07-31
0001746119
country:SC
2022-08-01
2023-07-31
0001746119
country:SC
2021-08-01
2022-07-31
0001746119
country:HK
2022-08-01
2023-07-31
0001746119
country:HK
2021-08-01
2022-07-31
0001746119
country:CN
2022-08-01
2023-07-31
0001746119
country:CN
2021-08-01
2022-07-31
0001746119
country:HK
2022-08-01
2023-07-31
0001746119
country:CN
2022-08-01
2023-07-31
0001746119
MUGH:CustomerAMember
us-gaap:SalesRevenueNetMember
us-gaap:CustomerConcentrationRiskMember
2022-08-01
2023-07-31
0001746119
MUGH:CustomerAMember
us-gaap:SalesRevenueNetMember
us-gaap:CustomerConcentrationRiskMember
2021-08-01
2022-07-31
0001746119
MUGH:CustomerAMember
us-gaap:AccountsReceivableMember
us-gaap:CustomerConcentrationRiskMember
2023-07-31
0001746119
MUGH:CustomerAMember
us-gaap:AccountsReceivableMember
us-gaap:CustomerConcentrationRiskMember
2022-07-31
0001746119
MUGH:CustomerBMember
us-gaap:SalesRevenueNetMember
us-gaap:CustomerConcentrationRiskMember
2022-08-01
2023-07-31
0001746119
MUGH:CustomerBMember
us-gaap:SalesRevenueNetMember
us-gaap:CustomerConcentrationRiskMember
2021-08-01
2022-07-31
0001746119
MUGH:CustomerBMember
us-gaap:AccountsReceivableMember
us-gaap:CustomerConcentrationRiskMember
2023-07-31
0001746119
MUGH:CustomerBMember
us-gaap:AccountsReceivableMember
us-gaap:CustomerConcentrationRiskMember
2022-07-31
0001746119
MUGH:CustomerCMember
us-gaap:SalesRevenueNetMember
us-gaap:CustomerConcentrationRiskMember
2022-08-01
2023-07-31
0001746119
MUGH:CustomerCMember
us-gaap:SalesRevenueNetMember
us-gaap:CustomerConcentrationRiskMember
2021-08-01
2022-07-31
0001746119
MUGH:CustomerCMember
us-gaap:AccountsReceivableMember
us-gaap:CustomerConcentrationRiskMember
2023-07-31
0001746119
MUGH:CustomerCMember
us-gaap:AccountsReceivableMember
us-gaap:CustomerConcentrationRiskMember
2022-07-31
0001746119
MUGH:CustomersMember
us-gaap:SalesRevenueNetMember
us-gaap:CustomerConcentrationRiskMember
2022-08-01
2023-07-31
0001746119
MUGH:CustomersMember
us-gaap:SalesRevenueNetMember
us-gaap:CustomerConcentrationRiskMember
2021-08-01
2022-07-31
0001746119
MUGH:CustomersMember
us-gaap:AccountsReceivableMember
us-gaap:CustomerConcentrationRiskMember
2023-07-31
0001746119
MUGH:CustomersMember
us-gaap:AccountsReceivableMember
us-gaap:CustomerConcentrationRiskMember
2022-07-31
0001746119
MUGH:VendorAMember
MUGH:PurchasesMember
MUGH:VendorConcentrationRiskMember
2022-08-01
2023-07-31
0001746119
MUGH:VendorAMember
MUGH:PurchasesMember
MUGH:VendorConcentrationRiskMember
2021-08-01
2022-07-31
0001746119
MUGH:VendorAMember
us-gaap:AccountsPayableMember
MUGH:VendorConcentrationRiskMember
2023-07-31
0001746119
MUGH:VendorAMember
us-gaap:AccountsPayableMember
MUGH:VendorConcentrationRiskMember
2022-07-31
0001746119
MUGH:VendorMember
MUGH:PurchasesMember
MUGH:VendorConcentrationRiskMember
2022-08-01
2023-07-31
0001746119
MUGH:VendorMember
MUGH:PurchasesMember
MUGH:VendorConcentrationRiskMember
2021-08-01
2022-07-31
0001746119
MUGH:VendorMember
us-gaap:AccountsPayableMember
MUGH:VendorConcentrationRiskMember
2023-07-31
0001746119
MUGH:VendorMember
us-gaap:AccountsPayableMember
MUGH:VendorConcentrationRiskMember
2022-07-31
0001746119
MUGH:CustomerMember
us-gaap:PropertyPlantAndEquipmentMember
us-gaap:CustomerConcentrationRiskMember
2021-08-01
2022-07-31
0001746119
MUGH:RentalAgreementMember
2021-11-05
2021-11-06
0001746119
MUGH:RentalAgreementMember
2021-11-06
0001746119
2021-11-05
2021-11-06
0001746119
2022-10-16
2022-10-18
0001746119
MUGH:RelatedPartyAMember
2022-08-01
2023-07-31
0001746119
MUGH:RelatedPartyAMember
2021-08-01
2022-07-31
0001746119
MUGH:RelatedPartyBMember
2022-08-01
2023-07-31
0001746119
MUGH:RelatedPartyBMember
2021-08-01
2022-07-31
0001746119
us-gaap:CorporateMember
MUGH:NVMember
2022-08-01
2023-07-31
0001746119
us-gaap:CorporateMember
country:SC
2022-08-01
2023-07-31
0001746119
us-gaap:CorporateMember
country:HK
2022-08-01
2023-07-31
0001746119
us-gaap:CorporateMember
country:CN
2022-08-01
2023-07-31
0001746119
us-gaap:CorporateMember
2022-08-01
2023-07-31
0001746119
us-gaap:CorporateMember
MUGH:NVMember
2023-07-31
0001746119
us-gaap:CorporateMember
country:SC
2023-07-31
0001746119
us-gaap:CorporateMember
country:HK
2023-07-31
0001746119
us-gaap:CorporateMember
country:CN
2023-07-31
0001746119
us-gaap:CorporateMember
2023-07-31
0001746119
us-gaap:CorporateMember
MUGH:NVMember
2021-08-01
2022-07-31
0001746119
us-gaap:CorporateMember
country:SC
2021-08-01
2022-07-31
0001746119
us-gaap:CorporateMember
country:HK
2021-08-01
2022-07-31
0001746119
us-gaap:CorporateMember
country:CN
2021-08-01
2022-07-31
0001746119
us-gaap:CorporateMember
2021-08-01
2022-07-31
0001746119
us-gaap:CorporateMember
MUGH:NVMember
2022-07-31
0001746119
us-gaap:CorporateMember
country:SC
2022-07-31
0001746119
us-gaap:CorporateMember
country:HK
2022-07-31
0001746119
us-gaap:CorporateMember
country:CN
2022-07-31
0001746119
us-gaap:CorporateMember
2022-07-31
iso4217:USD
xbrli:shares
iso4217:USD
xbrli:shares
xbrli:pure
iso4217:JPY
iso4217:CNY
UNITED
STATES
SECURITIES
AND EXCHANGE COMMISSION
Washington,
D.C. 20549
FORM
10-K
| ☒ |
ANNUAL
REPORT PURSUANT TO SECTION 13 OR 15(d) OF THE SECURITIES EXCHANGE ACT OF 1934 |
For
The Fiscal Year Ended July 31, 2023
or
| ☐ |
TRANSITION
REPORT PURSUANT TO SECTION 13 OR 15(d) OF THE SECURITIES EXCHANGE ACT OF 1934 |
For
the transition period from _______________ to _______________
Commission
File Number 333-228847
MU
Global Holding Limited
(Exact
name of registrant issuer as specified in its charter)
| Nevada |
|
30-1089215 |
(State
or other jurisdiction of
incorporation
or organization) |
|
(I.R.S.
Employer
Identification
No.) |
Rm.
5, 7F., No. 296, Sec. 4, Xinyi Rd., Da’an Dist.,
Taipei
City 106427, Taiwan (R.O.C.)
(Address
of principal executive offices, including zip code)
Registrant’s
phone number, including area code +886905153139
Securities
registered pursuant to Section 12(b) of the Securities Exchange Act: None
Securities
registered pursuant to Section 12(g) of the Securities Exchange Act: None
Indicate
by check mark if the registrant is a well-known seasoned issuer, as defined in Rule 405 of the Securities Act.
Yes
☐ No ☒
Indicate
by check mark if the registrant is not required to file reports pursuant to Section 13 or Section 15(d) of the Act.
Yes
☐ No ☒
Indicate
by check mark whether the registrant (1) has filed all reports required to be filed by Section 13 or 15(d) of the Securities Exchange
Act of 1934 during the preceding 12 months (or for such shorter period that the registrant was required to file such reports), and (2)
has been subject to such filing requirements for the past 90 days.
Yes
☒ No ☐
Indicate
by check mark whether the registrant has submitted electronically every Interactive Data File required to be submitted and posted pursuant
to Rule 405 of Regulation S-T (section 232.405 of this chapter) during the preceding 12 months (or for such shorter period that the registrant
was required to submit and post such files).
YES
☐ NO ☒
Indicate
by check mark if disclosure of delinquent filers pursuant to Item 405 of Regulation S-K (§ 229.405 of this chapter) is not contained
herein, and will not be contained, to the best of registrant’s knowledge, in definitive proxy or information statements incorporated
by reference in Part III of this Form 10-K or any amendment to this Form 10-K. ☐
Indicate
by check mark whether the registrant is a large accelerated filer, an accelerated filer, a non-accelerated filer, or a smaller reporting
company, or an emerging growth company. See the definitions of “large accelerated filer,” “accelerated filer”,
“smaller reporting company” and “emerging growth company” in Rule 12b-2 of the Exchange Act.
Large
Accelerated Filer ☐ Accelerated Filer ☐ Non-accelerated Filer ☐ Smaller reporting company ☒ Emerging growth company
☒
If
an emerging growth company, indicate by check mark if the registrant has elected not to use the extended transition period for complying
with any new or revised financial accounting standards provided pursuant to Section 13(a) of the Exchange Act.
If securities are
registered pursuant to Section 12(b) of the Act, indicate by check mark whether the financial statements of the registrant included
in the filing reflect the correction of an error to previously issued financial statements. ☐
Indicate by check mark
whether any of those error corrections are restatements that required a recovery analysis of incentive-based compensation received
by any of the registrant’s executive officers during the relevant recovery period pursuant to §240.10D-1(b). ☐
Indicate
by check mark whether the registrant is a shell company (as defined in Rule 12b-2 of the Exchange Act).
Yes
☐ No ☒
Securities
registered pursuant to Section 12(b) of the Act:
| Title
of each class |
|
Trading
Symbol(s) |
|
Name
of each exchange on which registered |
| Common
Stock |
|
MUGH |
|
The
OTC Market – Pink Sheets |
The
aggregate market value of the Company’s common stock held by non-affiliates computed by reference to the closing bid price of the
Company’s common stock, as of the last business day of the registrant’s most recently completed second fiscal quarter:
Not
Applicable
APPLICABLE
ONLY TO ISSUERS INVOLVED IN BANKRUPTCY
PROCEEDINGS
DURING THE PRECEDING FIVE YEARS:
Indicate
by check mark whether the registrant has filed all documents and reports required to be filed by Sections 12, 13 or 15(d) of the Securities
Exchange Act of 1934 subsequent to the distribution of securities under a plan confirmed by a court.
Not
Applicable
APPLICABLE
ONLY TO CORPORATE REGISTRANTS
Indicate
the number of shares outstanding of each of the issuer’s classes of common stock, as of the latest practicable date.
| Class |
|
Outstanding
at July 31, 2023 |
| Common
Stock, $.0001 par value |
|
59,434,838 |
MU
Global Holding Limited
FORM
10-K
For
the Fiscal Year Ended July 31, 2023
Index
CAUTIONARY
NOTE REGARDING FORWARD-LOOKING STATEMENTS
This
Annual Report on Form 10-K contains forward-looking statements. These forward-looking statements are not historical facts but rather
are based on current expectations, estimates and projections. We may use words such as “anticipate,” “expect,”
“intend,” “plan,” “believe,” “foresee,” “estimate” and variations of these
words and similar expressions to identify forward-looking statements. These statements are not guarantees of future performance and are
subject to certain risks, uncertainties and other factors, some of which are beyond our control, are difficult to predict and could cause
actual results to differ materially from those expressed or forecasted. These risks and uncertainties include the following:
| |
● |
The
availability and adequacy of our cash flow to meet our requirements; |
| |
|
|
| |
● |
Economic,
competitive, demographic, business and other conditions in our local and regional markets; |
| |
|
|
| |
● |
Changes
or developments in laws, regulations or taxes in our industry; |
| |
|
|
| |
● |
Actions
taken or omitted to be taken by third parties including our suppliers and competitors, as well as legislative, regulatory, judicial
and other governmental authorities; |
| |
|
|
| |
● |
Competition
in our industry; |
| |
|
|
| |
● |
The
loss of or failure to obtain any license or permit necessary or desirable in the operation of our business; |
| |
|
|
| |
● |
Changes
in our business strategy, capital improvements or development plans; |
| |
|
|
| |
● |
The
availability of additional capital to support capital improvements and development; and |
| |
|
|
| |
● |
Other
risks identified in this report and in our other filings with the Securities and Exchange Commission or the SEC. |
This
report should be read completely and with the understanding that actual future results may be materially different from what we expect.
The forward looking statements included in this report are made as of the date of this report and should be evaluated with consideration
of any changes occurring after the date of this Report. We will not update forward-looking statements even though our situation may change
in the future and we assume no obligation to update any forward-looking statements, whether as a result of new information, future events
or otherwise.
Use
of Defined Terms
Except
as otherwise indicated by the context, references in this Report to:
| |
● |
The
“Company,” “we,” “us,” or “our,” “MU Global” are references to MU Global
Holding Limited, a Nevada corporation. |
| |
|
|
| |
● |
“Common
Stock” refers to the common stock, par value $.0001, of the Company; |
| |
|
|
| |
● |
“U.S.
dollar,” “$” and “US$” refer to the legal currency of the United States; |
| |
|
|
| |
● |
“Securities
Act” refers to the Securities Act of 1933, as amended; and |
| |
|
|
| |
● |
“Exchange
Act” refers to the Securities Exchange Act of 1934, as amended. |
PART
I
ITEM
1. BUSINESS
Corporate
History
MU
Global Holding Limited, a Nevada corporation (“the company”) was incorporated under the laws of the State of Nevada on June
4, 2018.
MU
Global Holding Limited, the US Company, operates through its wholly owned subsidiary, MU Worldwide Group Limited, a Seychelles Company;
which operates through its wholly owned subsidiary, MU Global Holding Limited, a Hong Kong Company; which operates through its wholly
owned subsidiary, MU Global Health Management (Shanghai) Limited, a Shanghai Company.
MU
Global Holding Limited is an early-stage wellness and beauty supply services company, which intends to offer customers a wide range of
trusted non-surgical spa services and quality spa care products. All of the previous entities share the same exact business plan with
the goal of developing and providing wellness and beauty services to our future clients. We aim to promote improved overall health and
beauty in our clients through a holistic detoxification method.
The
Company, through its subsidiaries, mainly supplies high quality spa services and spa care products. Details of the Company’s subsidiaries:
| | |
Company name | |
Place and date of incorporation | |
Particulars of issued capital | |
Principal activities | |
Proportional of ownership interest and voting power held | |
| | |
| |
| |
| |
| |
| |
| 1. | |
MU Worldwide Group Limited | |
Seychelles,
June 7, 2018 | |
100 shares of ordinary share of US$1 each | |
Investment holding | |
100 | % |
| 2. | |
MU Global Holding Limited | |
Hong Kong,
January 30, 2018 | |
1 share of ordinary share of HK$1 each | |
Providing SPA and Wellness service in Hong Kong | |
100 | % |
| 3. | |
MU Global Health Management (Shanghai) Limited | |
Shanghai,
August 16, 2018 | |
RMB 7,405,866 | |
Providing SPA and Wellness service in China | |
100 | % |
Business
Overview
MU
Global is a beauty and wellness company, providing SPA and wellness service and also SPA related products to the customers. The services
provided are designed to improve the overall health system and body function.
Since
our establishment, the Company has been focusing to expand in the Chinese market, with other country also under consideration as target
destinations. As an emerging industry in China, the beauty and wellness industry is still in the early stage there is a huge potential
for the industry to growth significantly.
In
year 2020, COVID-19 crisis has resulted the sales of the global beauty and wellness industry weak due to consumers have had limited access
to retail outlets and supply chain bottlenecks have reduced product availability. In China, the industry’s sales fell up to 80
percent compared with 2019. Nevertheless, based on Mckinsey and Company research report on April 8, 2021, shows that consumers care deeply
about wellness—and that their interest is growing and the global wellness market is estimated at more than US$1.5 trillion, with
annual growth of 5 to 10 percent. A rise in both consumer interest and purchasing power presents tremendous opportunities for companies,
particularly as spending on personal wellness rebounds after stagnating or even declining during the COVID-19 crisis.
China
has large territory, population, diverse ethnicity and cultural background. As such, it has resulted in different consumer orientations
in different cities and townships across the country, therefore, it is particularly challenging to tackle the consumer market with a
single business model.
The
advance in technological development and rise in use of technology in marketing has also intensified the competition, probing the Company
to develop the business models that allow quick penetration and huge coverage of different markets, and also being able to cope with
the swift changes in the consumer market. Thus, the Company is focusing on three key areas as part of the Company’s early development
in the Chinese market.
The
first and most key focus is to enter the regional market through the adoption of franchisee and agent model, which the other parties
are familiar and have deep understanding in the local market, hence its operating strategy is effective and best suited the targeted
region.
Second,
the key strategy is to ensure rapid development of the Omni channel marketing plan which targets to lease out at least ten thousand Stone
Spa Bed (Hot Stone Bath equipment), reducing the time cost for the development of project, and most importantly, working on to spur sales
and revenue growth.
Lastly,
the essential requirement for business success in the Chinese market is to ensure and maintain a clear and transparent business model,
which would result in effective collaboration between the company and its agent/franchisee, and consequently leads to efficient market
operation and a win-win situation between the two parties.
Currently,
the Company operates in the Chinese market with three business models:
| 1. |
Tripartite
co-operation and profit sharing model (deployment of stone spa bed & franchise) |
| |
|
| 2. |
Large-scale
chain agent model (deployment of stone spa bed) |
| |
|
| 3.
|
Direct-
service store model |
Our
Service
DAY
MORE STONE THERAPHY
1.
Bedrock Bathing/ Hot Stone Bath


Bedrock
Bathing is a method of keeping the body in shape that involves bathers lying down on a heated slab of rocks embedded on a spa treatment
bed without using hot water wearing indoor clothing. The original name for this hot stone bathing is ‘Ganban’yoku’,
and it is originated from Japan as the term for a popular form of hot stone or bedrock spa. It is also referred to as “stone-bathing”,
but there is no actual bathing or water involved.
It
is our belief that the effects of bedrock bathing are numerous and both aesthetic and metabolic. Furthermore, the rocks selected for
this treatment are believed to provide many health benefits when they are heated. The five stones we intend to use are: Black Silica
Stone, Radium Stone, Far Infrared Stone, Negative Ion Stone and Beitou Stone. The average time taken for each therapy is approximately
30 minutes.
The
Company believes that bedrock bathing treatments will assist in the elimination of suboptimal health conditions caused by polluted environments,
unhealthy dietary intake, and unhealthy lifestyles. The detoxification process will improve general bodily function and immune system,
promote blood circulation, and yield visible skin improvement. The treatment is also believed to improve basal metabolism, resulting
in more efficient energy utilization within the body, hence sustainable weight loss to a desirable level. Prolonged proper treatments
have also been linked to miscellaneous anti-aging benefits.
Our
pricing strategy offers great flexibility to our customers to opt for the service they desire which is also within their budget. In order
to ensure flexibility, the Company has divided the service into three different tiers, each with different pricing strategy: Flagship,
Luxury and Refined. Under the three tiers model, Flagship branch and will be the top tier and will target high-end segment with premium
pricing packages. Luxury branch is designed to attract middle class individuals. Refined branch on the other side, will aim to attract
customer with lower budget, but would still like to enjoy the service.
The
Company started offering bedrock bathing services in the Shanghai outlet in January 2019. Different service packages are designed for
each tier of service, which include option for subscription-based treatments, and pay per services. The packages offer customers either
the option of purchasing our treatments at a discounted price if they purchase in bundle, or they can pay for the service every time
they use at normal price. The bundle comprises of 3 different number of visits per bundle i.e., 10 times visit package, 20 times visit
package, and 30 times visit package. We have also implemented a member database for our bedrock bathing centre. Customers can join our
membership at an attracting fee to enjoy the services provided at member price. In addition to that, the Company also allows customers
to purchase the services package via online and WeChat.
2.
Quartz Therapy

Chakras
is within and parts of the human body that connects with the environment. If chakra is blocked or overactive, we lose balance of our
physical and mental balance and in turn, it affects the physical and mental well-being.
Quarts
have the therapeutic effect of enabling Chakras to regain its balance. Thus, the therapy has the benefit of body cleansing, restoring
good health and also spirit.
Our
Product
NVB
Scent Diffuser


The
negative oxygen ions essential oil diffuser distributes cold-sprayed essential oil particle to balance oxygen and negative ions in the
air. The negative ions eliminate particles, and it’s called the vitamin in the air. The essential oil diffuser can purify air quality,
and provide a natural aroma that relax the body. The essential oil diffuser has integrated the technology of “Never BAC anti-bacterial”
that provides the effect of purification, anti-bacterial, second-hand smoke elimination, and deodorization.
Mini
Water Purifier

The
mini water purifier integrates advanced pressurization technology and filtering materials, which allow instant purification of water
and the removal of excess chlorine in water. The multi-layer filtration process of the purifier ensures water conservation and also stabilizes
water pressure at the same time. Most importantly, the purifier can effectively remove heavy metals and impurity associated with old
pipelines.
Trademarks
The
Company owned several trademarks registered under its subsidiaries in respective jurisdictions of which the subsidiaries operate in.
Currently, the Company is also applying for trademarks in other jurisdictions it intends to expand its operation into.
| Category |
|
Registration
Number |
|
Trade
Marks Logo |
|
Ownership |
|
Country |
|
Effective
Date and Duration |
| Trademark |
|
304770982 |
|

[Class
35] |
|
MU
Global Holding Limited |
|
Hong
Kong |
|
July
12, 2019
For
10
Years |
| Trademark |
|
304770991 |
|

[Class
11,44] |
|
MU
Global Holding Limited |
|
Hong
Kong |
|
June
20, 2019
For
10 Years |
| |
|
|
|
|
|
|
|
|
|
|
| Trademark |
|
14311788 |
|
 |
|
MU
Global Health Management |
|
China |
|
May
14, 2015
For
10 Years |
| |
|
|
|
|
|
|
|
|
|
|
| |
|
|
|
[Class
3] |
|
|
|
|
|
|
| |
|
|
|
|
|
|
|
|
|
|
| Trademark |
|
14311839 |
|
 |
|
MU
Global Health Management |
|
China |
|
May
14, 2015
For 10 Years |
| |
|
|
|
|
|
|
|
|
|
|
| |
|
|
|
[Class
3] |
|
|
|
|
|
|
| Trademark |
|
34828880 |
|
 |
|
MU
Global Health Management |
|
China |
|
July
14, 2019
For 10 Years |
| |
|
|
|
|
|
|
|
|
|
|
| |
|
|
|
[Class
32] |
|
|
|
|
|
|
| |
|
|
|
|
|
|
|
|
|
|
| Trademark |
|
35094440 |
|
 |
|
MU
Global Health Management |
|
China |
|
July
28, 2019
For 10 Years |
| |
|
|
|
|
|
|
|
|
|
|
| |
|
|
|
[Class
35] |
|
|
|
|
|
|
| |
|
|
|
|
|
|
|
|
|
|
| Trademark |
|
34814157 |
|
 |
|
MU
Global Health Management |
|
China |
|
July
21, 2019
For 10 Years |
| |
|
|
|
|
|
|
|
|
|
|
| |
|
|
|
[Class
35] |
|
|
|
|
|
|
| |
|
|
|
|
|
|
|
|
|
|
| Trademark |
|
34821472 |
|
 |
|
MU
Global Health Management |
|
China |
|
July
14, 2019
For 10 Years |
| |
|
|
|
|
|
|
|
|
|
|
| |
|
|
|
[Class
44] |
|
|
|
|
|
|
| |
|
|
|
|
|
|
|
|
|
|
| Trademark |
|
34810654 |
|
 |
|
MU
Global Health Management |
|
China |
|
July
21, 2019
For 10 Years |
| |
|
|
|
|
|
|
|
|
|
|
| |
|
|
|
[Class
10] |
|
|
|
|
|
|
| Trademark |
|
38223024 |
|
 |
|
MU
Global Health Management |
|
China |
|
February
7, 2020
For
10 Years |
| |
|
|
|
|
|
|
|
|
|
|
| |
|
|
|
[Class
10] |
|
|
|
|
|
|
| |
|
|
|
|
|
|
|
|
|
|
| Trademark |
|
38234836 |
|
 |
|
MU
Global Health Management |
|
China |
|
January
14, 2020
For
10 years |
| |
|
|
|
|
|
|
|
|
|
|
| |
|
|
|
[Class
20] |
|
|
|
|
|
|
| |
|
|
|
|
|
|
|
|
|
|
| Trademark |
|
38229731 |
|
 |
|
MU
Global Health Management |
|
China |
|
January
14, 2020
For
10 years |
| |
|
|
|
|
|
|
|
|
|
|
| |
|
|
|
[Class
20] |
|
|
|
|
|
|
| |
|
|
|
|
|
|
|
|
|
|
| Trademark |
|
38246309 |
|
 |
|
MU
Global Health Management |
|
China |
|
February
21, 2020
For
10 years |
| |
|
|
|
|
|
|
|
|
|
|
| |
|
|
|
[Class
35] |
|
|
|
|
|
|
| |
|
|
|
|
|
|
|
|
|
|
| Trademark |
|
38238457 |
|
 |
|
MU
Global Health Management |
|
China |
|
January
14, 2020
For
10 years |
| |
|
|
|
|
|
|
|
|
|
|
| |
|
|
|
[Class
44] |
|
|
|
|
|
|
| |
|
|
|
|
|
|
|
|
|
|
| Trademark |
|
38244932 |
|
 |
|
MU
Global Health Management |
|
China |
|
January
14, 2020
For
10 years |
| |
|
|
|
|
|
|
|
|
|
|
| |
|
|
|
[Class
03] |
|
|
|
|
|
|
| Trademark |
|
40201907290T |
|
 |
|
MU
Global Holding Limited |
|
Singapore |
|
April
4, 2019
For
10 years |
| |
|
|
|
|
|
|
|
|
|
|
| |
|
|
|
[Class
03] |
|
|
|
|
|
|
| |
|
|
|
|
|
|
|
|
|
|
| Trademark |
|
1440029207 |
|
|
|
MU
Global Holding Limited |
|
Saudi
Arabia |
|
July
31, 2019 to April 11, 2029 |
| |
|
|
|
|
|
|
|
|
|
|
| |
|
|
|
[Class
44] |
|
|
|
|
|
|
| |
|
|
|
|
|
|
|
|
|
|
| Trademark |
|
1440029205 |
|
 |
|
MU
Global Holding Limited |
|
Saudi
Arabia |
|
July
30, 2019 to April 10, 2029 |
| |
|
|
|
|
|
|
|
|
|
|
| |
|
|
|
[Class
11] |
|
|
|
|
|
|
| |
|
|
|
|
|
|
|
|
|
|
| Trademark |
|
1440029204 |
|
 |
|
MU
Global Holding Limited |
|
Saudi
Arabia |
|
July
30, 2019 to April 10, 2029 |
| |
|
|
|
|
|
|
|
|
|
|
| |
|
|
|
[Class
03] |
|
|
|
|
|
|
| |
|
|
|
|
|
|
|
|
|
|
| Trademark |
|
314481 |
|
|
|
MU
Global Holding Limited |
|
United
Arab Emirates |
|
July
25, 2019
For
10 years |
| |
|
|
|
|
|
|
|
|
|
|
| |
|
|
|
[Class
44] |
|
|
|
|
|
|
| |
|
|
|
|
|
|
|
|
|
|
| Trademark |
|
314479 |
|
|
|
MU
Global Holding Limited |
|
United
Arab Emirates |
|
July
25, 2019
For
10 years |
| |
|
|
|
|
|
|
|
|
|
|
| |
|
|
|
[Class
11] |
|
|
|
|
|
|
| |
|
|
|
|
|
|
|
|
|
|
| Trademark |
|
314480 |
|
|
|
MU
Global Holding Limited |
|
United
Arab Emirates |
|
July
25, 2019
For
10 years |
| |
|
|
|
|
|
|
|
|
|
|
| |
|
|
|
[Class
35] |
|
|
|
|
|
|
| |
|
|
|
|
|
|
|
|
|
|
| Trademark |
|
304770982 |
|
 |
|
MU
Global Holding Limited |
|
Hong
Kong |
|
December
14, 2018
For
10 years |
Patent
On
September 4, 2019, our subsidiary, MU Global Health Management (Shanghai) Limited made 5 patent applications to China National Intellectual
Property Administration (CNIPA) in regards to stone spa bed thermostatic control setting. On May 5, 2020, CNIPA officially granted one
patent to MU Global Health Management (Shanghai) Limited for a duration period of 10 years, with an effective date from September 4,
2019. In the year ended July 31, 2021, CNIPA officially granted another four patents to MU Global Health Management (Shanghai) Limited
for a duration period of 10 years, with an effective date from September 4, 2019. On June 22 2021, Intellectual Property Office of Singapore
officially granted one invention patent to MU Global Holding Limited (HK) for a duration period of 20 years, with an effective date from
September 11, 2019.
| Category |
|
Registration
Number |
|
Thermostatic
Control Setting Plan |
|
Ownership |
|
Country |
|
Effective
Date and Duration |
| |
|
|
|
|
|
|
|
|
|
|
| Patent |
|
ZL
2019 2 1458259.5 |
|
 |
|
MU
Global Health Management |
|
China |
|
May
5, 2020
For
10
Years |
| Patent |
|
ZL
2019 2 1474367.1 |
|
 |
|
MU
Global Health Management |
|
China |
|
August
21, 2020
For
10
Years |
| Patent |
|
ZL
2019 2 1462066. 7 |
|
 |
|
MU
Global Health Management |
|
China |
|
August
28, 2020
For
10
Years |
| Patent |
|
ZL
2019 2 1458272.0 |
|
 |
|
MU
Global Health Management |
|
China |
|
September
29, 2020
For
10
Years |
| Patent |
|
ZL
2019 2 1458071.0 |
|
 |
|
MU
Global Health Management |
|
China |
|
December
15, 2020
For
10
Years |
| Patent |
|
10201908402Q |
|
 |
|
MU
Global Holding Limited (HK) |
|
Singapore |
|
June
22, 2021
For
20
Years (from September 11, 2019) |
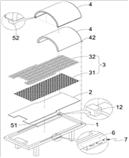
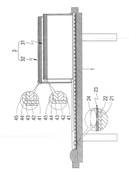
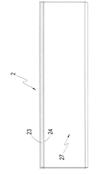
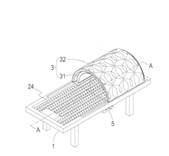
The
setting displays a concept of thermostatic control for a stone spa bed, which includes a bed, a bed heating element, an energy part,
a cover cabin, cover cabin’s opening/closing assembly, a thermostatic control device, and a thermostatic temperature adjustment
device. Once the thermostatic temperature adjustment device sets the default temperature, the user can activate the bed heating element
after lying down on the stone spa bed. Following the closure of the cover cabin, the bed heating element will start heating from the
default temperature to the user’s ideal degree of temperature. Once the session completes, the thermostatic control device will
reduce the heating efficiency to the default temperature in order to maintain the heat for the next session, which can largely reduce
the heating time and electricity cost-saving.
Future
Plan
Marketing
Campaign and Publicity Enhancement
Under
the group’s marketing development plan, the Company will implement actively the major projects launched by the group, including
Omni channel marketing project and nationwide franchised program, which the Company aims to attract at least 1,000 franchised stores.
Since
the opening of outlet shop in Shanghai, the shop has initiated the Omni-channel marketing projects, aiming to penetrate the market, and
it has built a stronghold with the franchised stores and agents in multiple provinces across the country, including Shanghai, Zhejiang,
Jiangsu, Sichuan, Shandong, Shanxi, Henan and Guangdong province. The initial expansion of operation is based on the business model of
profit sharing, and through this model, the Company has managed to expand the Hot Stone Bath therapy service into different health and
wellness service provider outlets in different cities. The outlets span across different sub-segment of the health and wellness industry,
which include beauty centre, post-maternity care centre, as well as high-end beauty salon. The Company targets to achieve the Omni-channel
marketing projects by 2021, and the nationwide franchised program is expected to be achieved by 2023.
Intelligent
Marketing
The
IT team in China has recently completed the development of “Intelligent Health Evaluation Application System” to provide
support for the operation of Hot Stone Bath Therapy. Customers are now able to compare their health indicator through the mobile application
and body fat measure device. The Company aims to build its own health indicator, recommend a personalized Hot Stone Bath therapy to the
customers through the use of big data computation and analysis. By providing personalized service package, the Company believes it can
effectively lead the consumers in making consuming decision, and consequently, the system will be upgraded to be a community marketing
tool aiming to increase new customers flow and also retain existing customers.
Product
Research and Development
While
the Company is seeking to expand the access to the China market, it is also actively promoting the research and development of products
and technology. In addition to the introduction of new products, under the ongoing smart technology trend led by China, the business
model of beauty and health industry has also experienced rapid changes in the emerging environment. Responding to changes in the business
model in this industry, the information and intelligent technology has thus become the core competency in successfully managing large-scale
change industries.
In
MU Global, the Company has numerous experts in information technology, thus equipping the company with the capability to support the
business technology required in this fast-changing business environment, providing the essential tool to manage a large-scale chain remotely,
and also lay the foundation for the success of the Omni-channel marketing project. As such, the Company will continuously strengthen
the capability of information and intelligent technology as it will be the top priority of the Company’s future development plan.
International
Expansion
Currently,
we are actively engaging and negotiating with different parties in the Gulf countries (UAE, Bahrain, Saudi Arabia, Oman, Qatar, and Kuwait).
The Company plans to enter the Middle-East market through the model of national agency and establish a long-term partnership with the
local counterpart to develop and promote the Omni channel marketing project. At the same time, the Company has already established the
national agency network in Malaysia and Singapore, and we are aiming to further expand to other countries in the Association of Southeast
Asian Nations (ASEAN).
Human
Resources and Talent Development
Taking
into consideration of aforementioned development, the Company is well aware that with existing man power is far from sufficient to materialization
of future plan, thus investment in human resources and talent development is inevitable, including but it will not be limited to internal
administrative and operation personnel, but also sales and marketing, accounting and finance, as well as top management personnel.
Competition
The
beauty and wellness industry are highly competitive and fragmented, we might be in disadvantage competing with competitor who has greater
reserve or has higher access to capital than the Company do to deploy in operations, capital expenditure, and marketing activities. We
hope to maintain a competitive advantage by utilizing the knowledge and expertise of the Company in the industry and our beyond satisfactory
customer service.
Customers
For
the year ended July 31, 2023, the Company has generated revenue amounted to $146,252 from customers under the ordinary course of business.
The revenue mainly represented income from wellness and beauty services provided to customers,
sales of products and sharing of revenue from leasable equipment with business alliance and franchisee.
Employees
As
of July 31, 2023, the Company has a total 3 employees. At the moment, the Company has adopted accountability system, hence management
personnel have flexible working hours.
Our
sole director and Chief Executive Officer cum Chief Financial Officer, Niu Yen-Yen currently work full-time and fully committed to the
operation of the company.
We
do not presently have pension, health, annuity, insurance, stock options, profit sharing, or similar benefit plans; however, we may adopt
plans in the future. There are presently no personal benefits available to our Officers, Directors or employees.
Government
Regulation
At
present, we are subject to the laws and regulations of the jurisdictions in which we operate, which may include business licensing requirements,
income taxes and payroll taxes. In general, the development and operation of our business is not subject to special regulatory and supervisory
requirements.
ITEM
1A. RISK FACTORS
We
are a smaller reporting company as defined by Rule 12b-2 of the Securities Exchange Act of 1934 and are not required to provide the information
under this item.
ITEM
1B. UNRESOLVED STAFF COMMENTS
We
are a smaller reporting company as defined by Rule 12b-2 of the Securities Exchange Act of 1934 and are not required to provide the information
under this item.
ITEM
2. PROPERTIES
We
had a physical office in Shanghai with address of Room 1510, Building 5, Ark Times Square, 3148 Chengliu Middle Road, Jiading District,
Shanghai. This location has been rented by MU Global Health Management (Shanghai) Limited for a 12-month period from November 6, 2021
to November 5, 2022, for an initial deposit of RMB 7,000 and additional tri-monthly payments in the amount of RMB 3,500 per month over
the course of the lease. The Company has an option to renew after the end of the agreement. On October 18, 2022, the Company has renewed
the tenancy agreement for 12 months with tri-monthly payments in the amount of RMB 3,500 per month over the course of the lease from
November 6, 2022 to November 5, 2023. On August 7, 2023, the Company has further renewed the tenancy agreement for 12 months with tri-monthly
payments in the amount of RMB 3,500 per month over the course of the lease from November 6, 2023 to November 5, 2024, with an option
to renew after the end of the agreement.
ITEM
3. LEGAL PROCEEDINGS
From
time to time, we may become involved in various lawsuits and legal proceedings which arise in the ordinary course of business. Litigation
is subject to inherent uncertainties, and an adverse result in these or other matters may arise from time to time that may harm our business.
There are currently no pending legal proceedings or claims that we believe will have a material adverse effect on our business, financial
condition or operating results. None of our directors, officers or affiliates is involved in a proceeding adverse to our business or
has a material interest adverse to our business.
ITEM
4. MINE SAFETY DISCLOSURES
Not
applicable.
PART
II
ITEM
5. MARKET FOR REGISTRANT’S COMMON EQUITY, RELATED STOCKHOLDER MATTERS AND ISSUER PURCHASES OF EQUITY SECURITIES
Holders
As
of July 31, 2023, we had 59,434,838 shares of our Common Stock par value, $.0001 issued and outstanding. There were 163 beneficial owners
of our Common Stock.
Transfer
Agent and Registrar
The
transfer agent for our capital stock is VStock Transfer, LLC, with an address at 18, Lafayette Place, Woodmere, New York 11598 and telephone
number is +1 (212) 828-8436.
Penny
Stock Regulations
The
Securities and Exchange Commission has adopted regulations which generally define “penny stock” to be an equity security
that has a market price of less than $5.00 per share. Our Common Stock, when and if a trading market develops, may fall within the definition
of penny stock and be subject to rules that impose additional sales practice requirements on broker-dealers who sell such securities
to persons other than established customers and accredited investors (generally those with assets in excess of $1,000,000, or annual
incomes exceeding $200,000 individually, or $300,000, together with their spouse).
For
transactions covered by these rules, the broker-dealer must make a special suitability determination for the purchase of such securities
and have received the purchaser’s prior written consent to the transaction. Additionally, for any transaction, other than exempt
transactions, involving a penny stock, the rules require the delivery, prior to the transaction, of a risk disclosure document mandated
by the Securities and Exchange Commission relating to the penny stock market. The broker-dealer also must disclose the commissions payable
to both the broker-dealer and the registered representative, current quotations for the securities and, if the broker-dealer is the sole
market-maker, the broker-dealer must disclose this fact and the broker-dealer’s presumed control over the market. Finally, monthly
statements must be sent disclosing recent price information for the penny stock held in the account and information on the limited market
in penny stocks. Consequently, the “penny stock” rules may restrict the ability of broker-dealers to sell our Common Stock
and may affect the ability of investors to sell their Common Stock in the secondary market.
In
addition to the “penny stock” rules promulgated by the Securities and Exchange Commission, the Financial Industry Regulatory
Authority (“FINRA”) has adopted rules that require that in recommending an investment to a customer, a broker-dealer must
have reasonable grounds for believing that the investment is suitable for that customer. Prior to recommending speculative low-priced
securities to their non-institutional customers, broker-dealers must make reasonable efforts to obtain information about the customer’s
financial status, tax status, investment objectives and other information. Under interpretations of these rules, FINRA believes that
there is a high probability that speculative low-priced securities will not be suitable for at least some customers. The FINRA requirements
make it more difficult for broker-dealers to recommend that their customers buy our common stock, which may limit the investors’
ability to buy and sell our stock.
Dividend
Policy
Any
future determination as to the declaration and payment of dividends on shares of our Common Stock will be made at the discretion of our
board of directors out of funds legally available for such purpose. We are under no obligations or restrictions to declare or pay dividends
on our shares of Common Stock. In addition, we currently have no plans to pay such dividends. Our board of directors currently intends
to retain all earnings for use in the business for the foreseeable future.
Equity
Compensation Plan Information
Currently,
there is no equity compensation plan in place.
Unregistered
Sales of Equity Securities
Currently,
there is no unregistered sales of equity securities.
Purchases
of Equity Securities by the Registrant and Affiliated Purchasers
We
have not repurchased any shares of our common stock during the fiscal year ended July 31, 2023.
ITEM
6. SELECTED FINANCIAL DATA
We
are a smaller reporting company as defined by Rule 12b-2 of the Securities Exchange Act of 1934 and are not required to provide the information
under this item.
ITEM
7. MANAGEMENT’S DISCUSSION AND ANALYSIS OF FINANCIAL CONDITION AND RESULTS OF OPERATIONS
The
following discussion of our financial condition and results of operations should be read in conjunction with our audited consolidated
financial statements and the notes to those financial statements appearing elsewhere in this Report.
Certain
statements in this Report constitute forward-looking statements. These forward-looking statements include statements, which involve risks
and uncertainties, regarding, among other things, (a) our projected sales, profitability, and cash flows, (b) our growth strategy, (c)
anticipated trends in our industry, (d) our future financing plans, and (e) our anticipated needs for, and use of, working capital. They
are generally identifiable by use of the words “may,” “will,” “should,” “anticipate,”
“estimate,” “plan,” “potential,” “project,” “continuing,” “ongoing,”
“expects,” “management believes,” “we believe,” “we intend,” or the negative of these
words or other variations on these words or comparable terminology. In light of these risks and uncertainties, there can be no assurance
that the forward-looking statements contained in this filing will in fact occur. You should not place undue reliance on these forward-looking
statements.
The
forward-looking statements speak only as of the date on which they are made, and, except to the extent required by federal securities
laws, we undertake no obligation to update any forward-looking statements to reflect events or circumstances after the date on which
the statements are made or to reflect the occurrence of unanticipated events.
Overview
MU
Global Holding Limited, the US Company, operates through its wholly owned subsidiary, MU Worldwide Group Limited, a Seychelles Company;
which operates through its wholly owned subsidiary, MU Global Holding Limited, a Hong Kong Company; which operates through its wholly
owned subsidiary, MU Global Health Management (Shanghai) Limited, a Shanghai Company. The US, Seychelles and Hong Kong Companies act
solely for holding purposes whereas all current and future operations in China are planned to be carried out via MU Global Health Management
(Shanghai) Limited, the Shanghai Company. The purpose of the Hong Kong Company is to function as the current regional hub of the Company.
At
present, we have a physical office in Shanghai with address of Room 1510, Building 5, Ark Times Square, 3148 Chengliu Middle Road, Jiading
District, Shanghai. In the future, we do not have definitive plans for which markets intend to expand to, but we base our operations
in Shanghai, as we prepare for future unidentified expansion efforts.
All
of the previous entities share the same exact business plan with the goal of developing and providing wellness and beauty services to
our future clients. We aim to promote improved overall health and beauty in our clients through a holistic detoxification method. We
will, at least initially, primarily focus our efforts on attracting customers in China. We have intentions, but no definitive plans or
timelines, to expand to Singapore, Malaysia, Hong Kong, and Middle Eastern countries in the coming years, and subsequently we intend
to make efforts to expand throughout Asia. We anticipate spending a substantial amount in marketing and advertising in the coming year.
Results
of Operations
Revenue
The
Company generated revenue of $146,252 and $46,702 for the year ended July 31, 2023 and 2022. The revenue represented income
from wellness and beauty services provided to customers, sales of products and sharing of revenue from leasable equipment with business
alliance and franchisee.
Cost
of Revenue and Gross Margin
For
the year ended July 31, 2023 and 2022, cost incurred in providing wellness and beauty services and
selling of essential oil amounted to $123,088 and $21,891 respectively. The Company generated gross profit of $23,164 and $24,811
for the year ended July 31, 2023 and 2022.
Selling
and Marketing Expenses
Selling
and distribution expenses for the year ended July 31, 2023 and 2022 amounted to $1,531 and $3,470 respectively, comprising advertisement
expenses on WeChat, mobile apps and market public research.
General
and Administrative Expenses
General
and administrative expenses for the year ended July 31, 2023 and 2022 amounted to $163,311 and $428,710 respectively, comprising salary,
allowances, professional fees, consultancy fee for IT and system management, office and outlet operation expenses.
Other
Income
The
Company recorded an amount of $72,851 and $50,036 as other income for the year ended July 31, 2023 and 2022 respectively, being interest
income, foreign exchange gain, gain on disposal, gain on remeasurement of long-term liabilities and waiver of debts.
Net
Loss
Net
loss for the year ended July 31, 2023 and 2022 amounted to $68,827 and $357,333 respectively. The decrease in net loss of $288,506 due
to management have carried out strict control in expenses to reduce the general and administrative expenses incurred during the year
ended July 31, 2023.
Liquidity
and Capital Resources
As
of July 31, 2023 and 2022, we had working capital of shortage of $382,433 and $339,398, consisting of cash and cash equivalents of $4,425
and $2,909 respectively. During the year ended July 31, 2023 and 2022, we had negative operating cash flows due to revenue is insufficient
to cover the general and administrative expenses.
We
depend substantially on financing activities to provide us with the liquidity and capital resources we need to meet our working capital
requirements and to make capital investments in connection with ongoing operations. During the year ended July 31, 2023, the Company
had met these requirements primarily from the financial support from director and third party company.
Cash
Used in Operating Activities
For
the year ended July 31, 2023 and 2022, net cash used in operating activities was $63,517 and $4,169 respectively. The cash used in operating
activities was mainly for payment of general and administrative expenses.
Cash
Generated from/(Used in) Financing Activities
For
the year ended July 31, 2023 and 2022, net cash generated from and used in financing activities was $46,210 and $14,961 respectively. The
financing cash flow performance primarily reflects loan from director, related company and third party.
Cash
Generated from/(Used in) Investing Activities
For
the year ended July 31, 2023 and 2022, net cash generated from and used in investing activities was $16,930 and $312 respectively. The investing
cash flow performance primarily reflects the purchase of plant, equipment and trademarks and the disposal of plant and equipment.
Credit
Facilities
We
do not have any credit facilities or other access to bank credit.
Critical
Accounting Policies and Estimates
Use
of estimates
Management
uses estimates and assumptions in preparing these financial statements in accordance with US GAAP. Those estimates and assumptions affect
the reported amounts of assets and liabilities, the disclosure of contingent assets and liabilities in the balance sheets, and the reported
revenue and expenses during the periods reported. Actual results may differ from these estimates.
Cash
and cash equivalents
Cash
and cash equivalents are carried at cost and represent cash on hand, demand deposits placed with banks or other financial institutions
and all highly liquid investments with an original maturity of three months or less as of the purchase date of such investments.
Revenue
recognition
Financial
Accounting Standards Board, or FASB, issued ASC 606. The standard is a comprehensive new revenue recognition model that requires revenue
to be recognized in a manner to depict the transfer of goods or services to a customer at an amount that reflects the consideration expected
to be received in exchange for those goods or services.
Revenue
is measured at the fair value of the consideration received or receivable, net of discounts and taxes applicable to the revenue. The
Company derives its revenue from provision of wellness and beauty services to customers via Company owned outlets, franchised outlets
or distribution of our product to third party wellness and beauty salon.
Cost
of revenues
Cost
of revenue includes the cost of services and product incurred to provide wellness and beauty services and purchase of products.
Cash
and cash equivalents
Cash
and cash equivalents are carried at cost and represent cash on hand, demand deposits placed with banks or other financial institutions
and all highly liquid investments with an original maturity of three months or less as of the purchase date of such investments.
Inventories
Inventories
consisting of products available for sell, are stated at the lower of cost or market value. Cost of inventory is determined using the
first-in, first-out (FIFO) method. Inventory reserve is recorded to write down the cost of inventory to the estimated market value due
to slow-moving merchandise and damaged goods, which is dependent upon factors such as historical and forecasted consumer demand, and
promotional environment. The Company takes ownership, risks and rewards of the products purchased. Write downs are recorded in cost of
revenues in the Consolidated Statements of Operations and Comprehensive Loss.
Property,
plant and equipment
Property,
plant and equipment are stated at cost less accumulated depreciation and accumulated impairment losses, if any. Depreciation is calculated
on the straight-line basis over the following expected useful lives from the date on which they become fully operational:
| Classification |
|
Estimated
useful life |
| Leasable
equipment |
|
5
years |
| Computer
hardware and software |
|
3
years |
| Office
equipment |
|
3
years |
| Outlet
design fee and equipment |
|
3
years |
| Application
development fee |
|
3
years |
Expenditures
for maintenance and repairs are expensed as incurred. The gain or loss on the disposal of property, plant and equipment is the difference
between the net sale proceeds and the carrying amount of the relevant assets and is recognized in the Consolidated Statements of Operations
and Comprehensive Loss.
Impairment
of long-live assets
Long-lived
assets primarily include trademark of the Company. In accordance with the provision of ASC Topic 360, Impairment or Disposal of Long-Lived
Assets, the Company generally conducts its annual impairment evaluation to its long-lived assets, usually in the fourth quarter of
each fiscal year, or more frequently if indicators of impairment exist, such as significant sustained change in the business climate.
The recoverability of long-lived assets is measured at the lowest level group. If the total of the expected undiscounted future net cash
flows is less than the carrying amount of the asset, a loss is recognized for the difference between the fair value and carrying amount
of the asset.
Leases
The
Company recognizes lease payments for its short-term lease on a straight-line basis over the lease term in accordance with ASC 842.
The
right-of-use asset is initially measured at cost, which comprises the initial amount of the lease liability adjusted for lease payments
made at or before the lease commencement date, plus any initial direct costs incurred less any lease incentives received. Costs associated
with operating lease assets are recognized on a straight-line basis within operating expenses over the term of the lease.
In
determining the present value of the unpaid lease payments, ASC 842 requires a lessee to discount its unpaid lease payments using the
interest rate implicit in the lease or, if that rate cannot be readily determined, its incremental borrowing rate. As most of the Company
leases do not provide an implicit rate, the Company uses its incremental borrowing rate as the discount rate for the lease. The Company
incremental borrowing rate is estimated to approximate the interest rate on a collateralized basis with similar terms and payments.
Income
taxes
Income
taxes are determined in accordance with the provisions of ASC Topic 740, “Income Taxes” (“ASC Topic 740”).
Under this method, deferred tax assets and liabilities are recognized for the future tax consequences attributable to differences between
the financial statement carrying amounts of existing assets and liabilities and their respective tax basis. Deferred tax assets and liabilities
are measured using enacted income tax rates expected to apply to taxable income in the periods in which those temporary differences are
expected to be recovered or settled. Any effect on deferred tax assets and liabilities of a change in tax rates is recognized in income
in the period that includes the enactment date.
ASC
740 prescribes a comprehensive model for how companies should recognize, measure, present, and disclose in their financial statements
uncertain tax positions taken or expected to be taken on a tax return. Under ASC 740, tax positions must initially be recognized in the
financial statements when it is more likely than not the position will be sustained upon examination by the tax authorities. Such tax
positions must initially and subsequently be measured as the largest amount of tax benefit that has a greater than 50% likelihood of
being realized upon ultimate settlement with the tax authority assuming full knowledge of the position and relevant facts.
The
Company conducts major businesses in China and is subject to tax in this jurisdiction. As a result of its business activities, the Company
will file tax returns that are subject to examination by the foreign tax authority.
Going
concern
The
accompanying financial statements have been prepared using the going concern basis of accounting, which contemplates the realization
of assets and the satisfaction of liabilities in the normal course of business.
For
the year ended July 31, 2023, the Company has generated revenue of $146,252 and continuously incurred a net loss of $68,827. As of July
31, 2023, the Company suffered an accumulated deficit of $2,458,008, capital deficiency of $583,975 and negative operating cash flow
of $63,517. The Company’s ability to continue as a going concern is dependent upon improving the profitability and the continuing
financial support from its shareholders and director. Management believes the existing shareholders, director or external financing will
provide the additional cash to meet the Company’s obligations as they become due.
These
and other factors raise substantial doubt about the Company’s ability to continue as a going concern. These financial statements
do not include any adjustments to reflect the possible future effects on the recoverability and classification of assets or the amounts
and classification of liabilities that may result in the Company not being able to continue as a going concern.
Net
loss per share
The
Company calculates net loss per share in accordance with ASC Topic 260 “Earnings Per Share”. Basic loss per share is computed
by dividing the net loss by the weighted average number of common shares outstanding during the period. Diluted loss per share is computed
similar to basic loss per share except that the denominator is increased to include the number of additional common shares that would
have been outstanding if the potential common stock equivalents had been issued and if the additional common shares were dilutive.
Foreign
currencies translation
Transactions
denominated in currencies other than the functional currency are translated into the functional currency at the exchange rates prevailing
at the dates of the transaction. Monetary assets and liabilities denominated in currencies other than the functional currency are translated
into the functional currency using the applicable exchange rates at the balance sheet dates. The resulting exchange differences are recorded
in the Consolidated Statements of Operations and Comprehensive Loss.
The
functional currency of the parent Company is United States dollar and the functional currency of the subsidiaries MU Worldwide Group
Limited (Seychelles) and MU Global Holding Limited (Hong Kong) is United States dollar. MU Global Health Management (Shanghai) Limited
is in Renminbi.
The
reporting currency of the Company and its subsidiary is United States Dollars (“US$”) and the accompanying financial statements
have been expressed in US$.
In
general, for consolidation purposes, assets and liabilities of its subsidiary whose functional currency is not US$ are translated into
US$, in accordance with ASC Topic 830-30, “Translation of Financial Statement”, using the exchange rate on the balance sheet
date. Revenues and expenses are translated at average rates prevailing during the period. The gains and losses resulting from translation
of financial statements of foreign subsidiary are recorded as a separate component of accumulated other comprehensive loss within the
statements of shareholders’ equity.
Translation
of amounts from RMB, TWD and HK$ into US$1 has been made at the following exchange rates for the respective periods:
| | |
As of and for the year ended July 31, | |
| | |
2023 | | |
2022 | |
| | |
| | |
| |
| Year-end RMB : US$1 exchange rate | |
| 7.136 | | |
| 6.744 | |
| Year-average RMB : US$1 exchange rate | |
| 6.989 | | |
| 6.476 | |
| Year-end HK$ : US$1 exchange rate | |
| 7.799 | | |
| 7.850 | |
| Year-average HK$ : US$1 exchange rate | |
| 7.835 | | |
| 7.811 | |
| Year-end TWD : US$1 exchange rate | |
| 31.461 | | |
| 30.044 | |
| Year-average TWD : US$1 exchange rate | |
| 30.805 | | |
| 28.500 | |
Related
parties
Parties,
which can be a corporation or individual, are considered to be related if the Company has the ability, directly or indirectly, to control
the other party or exercise significant influence over the other party in making financial and operating decisions. Companies are also
considered to be related if they are subject to common control or common significant influence.
Fair
value of financial instruments:
The
carrying value of the Company’s financial instruments: cash and cash equivalents, accounts payable and accrued liabilities, and
amount due to a director approximate at their fair values because of the short-term nature of these financial instruments.
The
Company also follows the guidance of the ASC Topic 820-10, “Fair Value Measurements and Disclosures” (“ASC 820-10”),
with respect to financial assets and liabilities that are measured at fair value. ASC 820-10 establishes a three-tier fair value hierarchy
that prioritizes the inputs used in measuring fair value as follows:
| |
Level
1: Observable inputs such as quoted prices in active markets; |
| |
|
| |
Level
2: Inputs, other than the quoted prices in active markets, that are observable either directly or indirectly; and |
| |
|
| |
Level
3: Unobservable inputs in which there is little or no market data, which require the reporting entity to develop its own assumptions. |
Recently
Adopted Accounting Standards
In
June 2016, the FASB issued Accounting Standards Update No. 2016-13, Financial Instruments – Credit Losses (Topics 326): Measurement
of Credit Losses on Financial Instruments, which introduced the expected credit losses methodology for the measurement of credit losses
on financial assets measured at amortized cost basis, replacing the previous incurred loss methodology. In November 2019, the FASB issued
ASU 2019-10 highlighted the adoption timeline. For smaller reporting entities, Topic 326 is effective for annual periods beginning after
December 15, 2022, including interim period within those fiscal years, of which is effective for the Company on January 1, 2023.
Credit
loss rate is determined by historical collection based on aging schedule, adjusted for current conditions using reasonable and supportable
forecast. Based on the aging categorization and the adjusted loss per category, an allowance for credit losses is calculated by multiplying
the adjusted loss rate with the amortized cost in the respective age category.
Recent
accounting pronouncements
The
Company has implemented all new accounting pronouncements that are in effect. These pronouncements did not have any material impact on
the financial statements unless otherwise disclosed, and the Company does not believe that there are any other new accounting pronouncements
that have been issued that might have a material impact on its financial position or results of operations.
Off-Balance
Sheet Arrangements
The
Company has no off-balance sheet arrangements
ITEM
7A. QUANTITATIVE AND QUALITATIVE DISCLOSURES ABOUT MARKET RISK
We
are a smaller reporting company as defined by Rule 12b-2 of the Securities Exchange Act of 1934 and are not required to provide the information
under this item.
ITEM
8. FINANCIAL STATEMENTS AND SUPPLEMENTARY DATA
The
financial statements required by this item are located in PART IV of this Annual Report.
ITEM
9. CHANGES IN AND DISAGREEMENTS WITH ACCOUNTANTS ON ACCOUNTING AND FINANCIAL DISCLOSURE
None.
ITEM
9A. CONTROLS AND PROCEDURES
Disclosures
Control and Procedures
Our
management is responsible for establishing and maintaining adequate internal control over financial reporting. Internal control over
financial reporting is defined in Rule 13a-15(f) or 15d-15(f) promulgated under the Exchange Act as a process designed by, or under the
supervision of, the company’s principal executive and principal financial officers and effected by the company’s board of
directors, management and other personnel, to provide reasonable assurance regarding the reliability of financial reporting and the preparation
of financial statements for external purposes in accordance with accounting principles generally accepted in the United States of America
and includes those policies and procedures that:
| |
● |
Pertain
to the maintenance of records that in reasonable detail accurately and fairly reflect the transactions and dispositions of the assets
of the company; |
| |
|
|
| |
● |
Provide
reasonable assurance that transactions are recorded as necessary to permit preparation of financial statements in accordance with
accounting principles generally accepted in the United States of America and that receipts and expenditures of the company are being
made only in accordance with authorizations of management and directors of the company; and |
| |
|
|
| |
● |
Provide
reasonable assurance regarding prevention or timely detection of unauthorized acquisition, use or disposition of the company’s
assets that could have a material effect on the financial statements. |
Because
of its inherent limitations, internal control over financial reporting may not prevent or detect misstatements. Projections of any evaluation
of effectiveness to future periods are subject to the risk that controls may become inadequate because of changes in conditions, or that
the degree of compliance with the policies or procedures may deteriorate. All internal control systems, no matter how well designed,
have inherent limitations. Therefore, even those systems determined to be effective can provide only reasonable assurance with respect
to financial statement preparation and presentation. Because of the inherent limitations of internal control, there is a risk that material
misstatements may not be prevented or detected on a timely basis by internal control over financial reporting. However, these inherent
limitations are known features of the financial reporting process. Therefore, it is possible to design into the process safeguards to
reduce, though not eliminate, this risk.
As
of July 31, 2023, the management assessed the effectiveness of our internal control over financial reporting based on the criteria for
effective internal control over financial reporting established in Internal Control—Integrated Framework issued by the Committee
of Sponsoring Organizations of the Treadway Commission (“COSO”) and SEC guidance on conducting such assessments. Based on
such evaluation, the management concluded that during the year covered by this Report, internal controls and procedures overall were
not effective. This was due to the deficiencies existed in the design or operation of our internal controls over financial reporting
that adversely affected our internal controls and that may be considered to be material weaknesses.
Identified
Material Weakness
A
material weakness in internal control over financial reporting is a control deficiency, or combination of control deficiencies, that
results in more than a remote likelihood that a material misstatement of the financial statements will not be prevented or detected.
Management
identified the following material weakness during its assessment of internal controls over financial reporting as of July 31, 2023.
We
do not have adequate segregation of duties and effective risk assessment – Lack of segregation of duties and effective risk
assessment may cause the Company to face the likelihood of fraud or theft, due to poor oversight, governance and review to detect errors.
Accordingly,
the Company concluded that these control deficiencies resulted in a reasonable possibility that a material misstatement of the annual
or interim financial statements will not be prevented or detected on a timely basis by the company’s internal controls.
As
a result of the material weaknesses described above, the management has concluded that the Company did not maintain effective internal
control over financial reporting as of July 31, 2023 based on the criteria established in Internal Control—Integrated Framework
issued by COSO.
Management’s
Remediation Initiatives
In
an effort to remediate the identified material weaknesses and other deficiencies and enhance our internal controls, we have initiated,
or plan to initiate, the following series of measures:
| 1. |
We
plan to create a position to segregate duties consistent with control objectives and will increase our personnel resources and technical
accounting expertise within the accounting function. The accounting personnel is responsible for reviewing the financing activities,
facilitating the approval of the financing, recording the information regarding the financing, and submitting SEC filing related
documents to our legal counsel in order to comply with the filing requirements of SEC. |
| |
|
| 2. |
We
intend to add staff members to our management team to make sure that information required to be disclosed in our reports filed and
submitted under the Exchange Act is recorded, processed, summarized and reported as and when required and will the staff members
will have segregated responsibilities with regard to these responsibilities. |
We
anticipate that these initiatives will be at least partially, if not fully, implemented by the end of fiscal year 2023.
Changes
in internal controls over financial reporting
There
was no change in our internal controls over financial reporting that occurred during the year covered by this Report, which has materially
affected, or is reasonably likely to materially affect, our internal controls over financial reporting:
This
annual report does not include an attestation report of the Company’s registered independent public accounting firm regarding internal
control over financial reporting. Management’s report was not subject to attestation by the Company’s registered independent
public accounting firm pursuant to rules of the Securities and Exchange Commission that permit the Company to provide only management’s
report in this Annual Report on Form 10-K.
ITEM
9B. OTHER INFORMATION
None.
PART
III
ITEM
10. DIRECTORS, EXECUTIVE OFFICERS AND CORPORATE GOVERNANCE
Our
executive officer’s and director’s and their respective ages as of the date hereof are as follows:
| NAME | |
AGE | |
POSITION |
| Niu Yen-Yen1 | |
50 | |
Chief Executive Officer, Chief Financial Officer, President, Secretary, Treasurer, Director |
| Hsieh Chang-Chung2 | |
63 | |
Chief Financial Officer |
1On
November 1, 2022, Ms. Niu Yen Yen appointed as Chief Financial Officer of the Company.
2On
November 1, 2022, Mr. Hsieh Chang-Chung resigned
as Chief Financial Officer of the Company.
Set
forth below is a brief description of the background and business experience of our executive officer and director for the past five
years.
Niu
Yen-Yen - President, Chief Executive Officer, Chief Financial Officer, Secretary, Treasurer, Director
In
2014, Ms. Niu Yen-Yen received Master of Business Administration program from Aalto University Executive Education, Taiwan. From 1997
to 2006, Ms. Niu Yen-Yen served as the Business Development Director at Serax International Limited in Hong Kong, a multilevel marketing
business.
Ms.
Niu serves as Chief Executive Officer of Yu Qing International Co., Ltd. in Taiwan since 2006 and continues to hold this position at
present. In 2006, when she first started this company, she became an agent to perfume brands such as, Calvin Klein, Clive Christian,
Dior, Versace, Chanel, Hermes, Kenzo, Bvlgari, Jimmy Choo etc. In 2010, Ms. Niu has held over 500 sales events all over famous shopping
malls and hotels. In 2012, she developed a retail brand called “Idol Beauty”. It provides various beauty care, organic skin
care and cosmetic products. In 2013, she set up “Day More” as the first stone spa brand in Taiwan. In the same year, she
worked with Horien Biochemical Technology Co., Ltd. to develop and apply patent beauty care products such as Antirincle and Biofresh.
In
2016, Ms. Niu opened a new business called Mu Chuan International Company Limited, a multilevel marketing business. In 2017, Ms. Niu
established a cross-border e-commerce business, https://www.magicgo99.com, in order to reach consumers globally.
On
November 1, 2022, Ms. Niu Yen Yen appointed as Chief Financial Officer of the Company.
Ms.
Niu Yen-Yen’s experience in corporate management and business development has led the Board of Directors to reach the conclusion
that she should serve as President, Chief Executive Officer, Chief Financial Officer and
Director of the Company.
Hsieh
Chang-Chung - Chief Financial Officer
In
1985, Mr. Hsieh Chang-Chung received Master of Business Administration from Chung Yuan Christian University, Taiwan. From 1989 to 1992,
Mr. Hsieh worked as the Special Assistant to the Chairman of Fu-I Industrial Group, a listed company in Taipei Stock Exchange. He served
as the Co-Founder and Executive Vice President of Quanton Optronics Inc. from November 1992 to December 1993. Mr. Hsieh had also served
as the Controller of UTC Co., Ltd from 1994 to 1995. From 1995 to 1998, Mr. Hsieh served as the Chief Staff of the CEO Office in EMI.
Ltd., which is a listed company in Taipei Stock Exchange. He also served as the Vice President of Far Eastern VC Investment Co., Ltd
from 1997 to 2006.
From
1999 to 2008, Mr. Hsieh served as the Chief Financial Officer and Senior Vice President of Eastern Multimedia Co., Ltd. (which was renamed
to Kbro Co., Ltd. in 2006) in Taiwan. He then served as the Vice President and Chief Investment Officer of Head Office in Eastern Media
International Group (EMI) from 2008 to 2016. From 2016 to 2019, Mr. Hsieh has served as the Senior Consultant of Eastern Media International
Group (EMI) in Taiwan.
Mr.
Hsieh Chang-Chung’s corporate and financial experience has led the Board of Directors to reach the conclusion that he should serve
as the Chief Financial Officer of the Company.
On
November 1, 2022, Mr. Hsieh Chang-Chung resigned
as Chief Financial Officer of the Company.
Corporate
Governance
The
Company promotes accountability for adherence to honest and ethical conduct; endeavors to provide full, fair, accurate, timely and understandable
disclosure in reports and documents that the Company files with the Securities and Exchange Commission (the “SEC”) and in
other public communications made by the Company; and strives to be compliant with applicable governmental laws, rules and regulations.
The Company has not formally adopted a written code of business conduct and ethics that governs the Company’s employees, officers
and Directors as the Company is not required to do so.
In
lieu of an Audit Committee, the Company’s Board of Directors is responsible for reviewing and making recommendations concerning
the selection of external auditors, reviewing the scope, results and effectiveness of the annual audit of the Company’s financial
statements and other services provided by the Company’s independent public accountants. The Board of Directors, Chief Executive
Officer and Chief Financial Officer of the Company review the Company’s internal accounting controls, practices and policies.
Committees
of the Board
Our
Company currently does not have nominating, compensation, or audit committees or committees performing similar functions nor does our
Company have a written nominating, compensation or audit committee charter. Our Director(s) believes that it is not necessary to have
such committees, at this time, because the Director(s) can adequately perform the functions of such committees.
Audit
Committee Financial Expert
Our
Board of Directors has determined that we do not have a board member that qualifies as an “audit committee financial expert”
as defined in Item 407(D)(5) of Regulation S-K, nor do we have a Board member that qualifies as “independent” as the term
is used in Item 7(d)(3)(iv)(B) of Schedule 14A under the Securities Exchange Act of 1934, as amended, and as defined by Rule 4200(a)(14)
of the FINRA Rules.
We
believe that our Director(s) are capable of analyzing and evaluating our financial statements and understanding internal controls and
procedures for financial reporting. The Director(s) of our Company does not believe that it is necessary to have an audit committee because
management believes that the Board of Directors can adequately perform the functions of an audit committee. In addition, we believe that
retaining an independent Director who would qualify as an “audit committee financial expert” would be overly costly and burdensome
and is not warranted in our circumstances given the stage of our development and the fact that we have not generated any positive cash
flows from operations to date.
Involvement
in Certain Legal Proceedings
Our
Directors and our Executive officers have not been involved in any of the following events during the past ten years:
| 1. |
bankruptcy
petition filed by or against any business of which such person was a general partner or executive officer either at the time of the
bankruptcy or within two years prior to that time; |
| 2. |
any
conviction in a criminal proceeding or being subject to a pending criminal proceeding (excluding traffic violations and other minor
offenses); |
| 3. |
being
subject to any order, judgment, or decree, not subsequently reversed, suspended or vacated, of any court of competent jurisdiction,
permanently or temporarily enjoining, barring, suspending or otherwise limiting his/her involvement in any type of business, securities
or banking activities; or |
| 4. |
being
found by a court of competent jurisdiction (in a civil action), the Commission or the Commodity Futures Trading Commission to have
violated a federal or state securities or commodities law, and the judgment has not been reversed, suspended, or vacated. |
| 5. |
Such
person was found by a court of competent jurisdiction in a civil action or by the Commission to have violated any Federal or State
securities law, and the judgment in such civil action or finding by the Commission has not been subsequently reversed, suspended,
or vacated; |
| 6. |
Such
person was found by a court of competent jurisdiction in a civil action or by the Commodity Futures Trading Commission to have violated
any Federal commodities law, and the judgment in such civil action or finding by the Commodity Futures Trading Commission has not
been subsequently reversed, suspended or vacated; |
| 7. |
Such
person was the subject of, or a party to, any Federal or State judicial or administrative order, judgment, decree, or finding, not
subsequently reversed, suspended or vacated, relating to an alleged violation of:(i) Any Federal or State securities or commodities
law or regulation; or(ii) Any law or regulation respecting financial institutions or insurance companies including, but not limited
to, a temporary or permanent injunction, order of disgorgement or restitution, civil money penalty or temporary or permanent cease-and-desist
order, or removal or prohibition order; or(iii) Any law or regulation prohibiting mail or wire fraud or fraud in connection with
any business entity; or |
| 8. |
Such
person was the subject of, or a party to, any sanction or order, not subsequently reversed, suspended or vacated, of any self-regulatory
organization (as defined in Section 3(a)(26) of the Exchange Act (15 U.S.C. 78c(a)(26))), any registered entity (as defined in Section
1(a)(29) of the Commodity Exchange Act (7 U.S.C. 1(a)(29))), or any equivalent exchange, association, entity or organization that
has disciplinary authority over its members or persons associated with a member. |
Independence
of Directors
We
are not required to have independent members of our Board of Directors, and do not anticipate having independent Directors until such
time as we are required to do so.
Code
of Ethics
We
have not adopted a formal Code of Ethics. The Board of Directors has evaluated the business of the Company and the number of employees
and determined that since the business is operated by a small number of persons, general rules of fiduciary duty and federal and state
criminal, business conduct and securities laws are adequate ethical guidelines. In the event our operations, employees and/or Directors
expand in the future, we may take actions to adopt a formal Code of Ethics.
Shareholder
Proposals
Our
Company does not have any defined policy or procedural requirements for shareholders to submit recommendations or nominations for Directors.
The Board of Directors believes that, given the stage of our development, a specific nominating policy would be premature and of little
assistance until our business operations develop to a more advanced level. Our Company does not currently have any specific or minimum
criteria for the election of nominees to the Board of Directors and we do not have any specific process or procedure for evaluating such
nominees. The Board of Directors will assess all candidates, whether submitted by management or shareholders, and make recommendations
for election or appointment.
A
shareholder who wishes to communicate with our Board of Directors may do so by directing a written request addressed to our President,
at the address appearing on the first page of this Information Statement.
ITEM
11. EXECUTIVE COMPENSATION
The
following table sets forth information concerning the compensation of our Chief Executive Officer, and the executive officers who served
at the end of the year July 31, 2023, for services rendered in all capacities to us.
Summary
Compensation Table:
| Name and Principal Position | |
Year | |
Salary ($) | | |
Bonus ($) | | |
Stock Awards ($) | | |
Option Awards ($) | | |
Non-Equity Incentive Plan Compensation ($) | | |
Nonqualified Deferred Compensation Earnings ($) | | |
All Other Compensation ($) | | |
Total ($) | |
| Niu Yen Yen, Chief Executive Officer, Chief Financial Officer, | |
For the year ended July 31, 2023 | |
| - | | |
| - | | |
| - | | |
| - | | |
| - | | |
| - | | |
| - | | |
| - | |
President, Secretary, Treasurer, Director
(1) | |
For the year ended July 31, 2022 | |
| - | | |
| - | | |
| - | | |
| - | | |
| - | | |
| - | | |
| - | | |
| - | |
| | |
| |
| | | |
| | | |
| | | |
| | | |
| | | |
| | | |
| | | |
| | |
| Hsieh Chang- Chung, | |
For the year ended July 31, 2023 | |
| 8,100 | | |
| - | | |
| - | | |
| - | | |
| - | | |
| - | | |
| - | | |
| 8,100 | |
Chief Financial Officer
(2) | |
For the year ended July 31, 2022 | |
| 32,400 | | |
| - | | |
| - | | |
| - | | |
| - | | |
| - | | |
| - | | |
| 32,400 | |
| (1) | On
November 1, 2022, Ms. Niu Yen Yen appointed as Chief Financial Officer of the Company. |
| (2) | On
November 1, 2022, Mr.
Hsieh Chang-Chung resigned as Chief Financial Officer
of the Company. |
Narrative
Disclosure to Summary Compensation Table
There
are no arrangements or plans in which we provide pension, retirement or similar benefits for directors or executive officers. Our directors
and executive officers may receive stock options at the discretion of our board of directors in the future. We do not have any material
bonus or profit sharing plans pursuant to which cash or non-cash compensation is or may be paid to our directors or executive officers,
except that stock options may be granted at the discretion of our board of directors from time to time. We have no plans or arrangements
in respect of remuneration received or that may be received by our executive officers to compensate such officers in the event of termination
of employment (as a result of resignation, retirement, change of control) or a change of responsibilities following a change of control.
Stock
Option Grants
We
have not granted any stock options to our executive officers since our incorporation.
Employment
Agreements
We
have entered into an employment agreement with the Mr. Hsieh Chang-Chung, our Chief Financial Officer on June 5, 2018. The agreement
will be effective for 5 years and will expire in 2023. Based on the employment contract, Mr. Hsieh will be in charge of the financial
control, capital financing, and merger and acquisition of the Company.
On
November 1, 2022, Mr. Hsieh Chang-Chung resigned
as Chief Financial Officer of the Company.
Compensation
Discussion and Analysis
Director
Compensation
Our
Board of Directors does not currently receive any consideration for their services as members of the Board of Directors. The Board of
Directors reserves the right in the future to award the members of the Board of Directors cash or stock-based consideration for their
services to the Company, which awards, if granted shall be in the sole determination of the Board of Directors.
Executive
Compensation Philosophy
Our
Board of Directors determines the compensation given to our executive officers in their sole determination. Our Board of Directors reserves
the right to pay our executives or any future executives a salary, and/or issue them shares of common stock in consideration for services
rendered and/or to award incentive bonuses which are linked to our performance, as well as to the individual executive officer’s
performance. This package may also include long-term stock-based compensation to certain executives, which is intended to align the performance
of our executives with our long-term business strategies. Additionally, while our Board of Directors has not granted any performance
base stock options to date, the Board of Directors reserves the right to grant such options in the future, if the Board in its sole determination
believes such grants would be in the best interests of the Company.
Incentive
Bonus
The
Board of Directors may grant incentive bonuses to our executive officer and/or future executive officers in its sole discretion, if the
Board of Directors believes such bonuses are in the Company’s best interest, after analyzing our current business objectives and
growth, if any, and the amount of revenue we are able to generate each month, which revenue is a direct result of the actions and ability
of such executives.
Long-term,
Stock Based Compensation
In
order to attract, retain and motivate executive talent necessary to support the Company’s long-term business strategy we may award
our executive and any future executives with long-term, stock-based compensation in the future, at the sole discretion of our Board of
Directors, which we do not currently have any immediate plans to award.
ITEM
12. SECURITY OWNERSHIP OF CERTAIN BENEFICIAL OWNERS AND MANAGEMENT AND RELATED STOCKHOLDER MATTERS
As
of July 31, 2023, the Company has 59,434,838 shares of common stock issued and outstanding, which number of issued and outstanding shares
of common stock have been used throughout this report.
The
following table sets forth, as of July 31, 2023 certain information with regard to the record and beneficial ownership of the Company’s
common stock by (i) each person known to the Company to be the record or beneficial owner of more than 5% of the Company’s common
stock, (ii) each director of the Company, (iii) each of the named executive officers, and (iv) all executive officers and directors of
the Company as a group:
| Name and Address of Beneficial Owner | |
Shares of Common Stock Beneficially Owned | | |
Common Stock Voting Percentage Beneficially Owned | | |
Total Voting Percentage Beneficially Owned | |
| Executive Officers and Directors | |
| | | |
| | | |
| | |
Niu Yen-Yen1,
Chief Executive Officer and Chief Financial Officer, (“Principal Executive Officer”, Principal Financial Officer” and “Principal Accounting Officer”), President, Secretary, Treasurer and Director | |
| 11,514,970 | | |
| 19.37 | % | |
| 19.37 | % |
| Server Int’l Co., Ltd1 | |
| 10,600,000 | | |
| 17.84 | % | |
| 17.84 | % |
Hsieh Chang-Chung,
Chief Financial Officer (“Principal Financial Officer” and “Principal Accounting Officer”) | |
| 700,000 | | |
| 1.18 | % | |
| 1.18 | % |
| All of executive officers and director as a group | |
| 22,814,970 | | |
| 38.39 | % | |
| 38.39 | % |
| | |
| | | |
| | | |
| | |
| 5% or greater shareholders (excluding officers/directors) | |
| | | |
| | | |
| | |
| Chen Chun Hao | |
| 3,500,000 | | |
| 5.89 | % | |
| 5.89 | % |
1On
November 1, 2022, Ms. Niu Yen Yen appointed as Chief Financial Officer of the Company.
2
Server Int’l Co., Ltd is owned and controlled entirely by our Chief Executive Officer cum Chief
Financial Officer, Ms. Niu Yen-Yen.
3On
November 1, 2022, Mr. Hsieh Chang-Chung resigned
as Chief Financial Officer of the Company.
Beneficial
ownership has been determined in accordance with Rule 13d-3 under the Exchange Act. Under this rule, certain shares may be deemed to
be beneficially owned by more than one person (if, for example, persons share the power to vote or the power to dispose of the shares).
In addition, shares are deemed to be beneficially owned by a person if the person has the right to acquire shares (for example, upon
exercise of an option or warrant) within 60 days of the date as of which the information is provided.
In computing the percentage ownership of any person, the amount of shares is deemed to include the amount of shares beneficially owned
by such person by reason of such acquisition rights. As a result, the percentage of outstanding shares of any person as shown in the
following table does not necessarily reflect the person’s actual voting power at any particular date.
| (1) |
Beneficial
ownership is determined in accordance with the rules of the Securities and Exchange Commission and generally includes voting or investment
power with respect to securities. Beneficial ownership also includes shares of stock subject to options and warrants currently exercisable
or exercisable within 60 days of the date of this table. In determining the percent of common stock owned by a person or entity as
of the date of this Report, (a) the numerator is the number of shares of the class beneficially owned by such person or entity, including
shares which may be acquired within 60 days on exercise of warrants or options and conversion of convertible securities, and (b)
the denominator is the sum of (i) the total shares of common stock outstanding on as of the date of this Annual Report (59,434,838
shares), and (ii) the total number of shares that the beneficial owner may acquire upon exercise of the derivative securities. Unless
otherwise stated, each beneficial owner has sole power to vote and dispose of its shares. |
| |
|
| (2) |
Based
on the total issued and outstanding shares of 59,434,838 as of the date of this Annual Report. |
ITEM
13. CERTAIN RELATIONSHIPS AND RELATED TRANSACTIONS, DIRECTOR INDEPENDENCE
On
June 4, 2018, Ms. Niu Yen-Yen was appointed Chief Executive Officer, President, Secretary, Treasurer and sole member of our Board of
Directors.
On
June 4, 2018, our Chief Executive Officer, Ms. Niu Yen-Yen subscribed 100,000 shares of restricted common stock of the Company at par
value of $0.0001 per share. The monies from this transaction, which totaled $10, went to the Company to be used as initial working capital.
On
June 5, 2018, Mr. Hsieh Chang-Chung was appointed Chief Financial Officer.
On
June 29, 2018, we, “the Company” acquired MU Worldwide Group Limited (herein referred as the “Seychelles Company”),
a company incorporated in the Republic of Seychelles. MU Worldwide Group Limited, the Seychelles Company, operates through its subsidiary
MU Global Holding Limited (herein referred as the “Hong Kong Company”), a company incorporated in Hong Kong.
MU
Global Holding Limited, the Hong Kong Company, operates through its wholly owned subsidiary, MU Global Health Management (Shanghai) Limited,
(herein referred as the “Shanghai Company”), a company incorporated in Shanghai, People Republic China.
On
July 6, 2018, Ms. Niu Yen-Yen and Server Int’l Co., Ltd. subscribed 25,000,000 and 11,000,000 restricted shares of common stock,
respectively, of the Company, at par value of $0.0001 per share. The monies from these transactions, which totaled $3,600, went to the
Company to be used as initial working capital. Server Int’l Co., Ltd. is controlled entirely by Ms. Niu Yen-Yen.
On
July 7, 2018, Chang Chun-Ying and Chang Su-Fen subscribed 4,300,000 and 5,000,000 restricted shares of common stock, respectively, of
the Company, at par value of $0.0001 per share. The monies from these transactions, which totaled $930, went to the Company to be used
as initial working capital.
On
July 9, 2018, GreenPro Asia Strategic SPC and GreenPro Venture Capital Limited, subscribed 2,835,000 and 2,165,000 restricted shares
of common stock of the Company, respectively, at par value of $0.0001 per share. The monies from these transactions, which totaled $500,
went to the Company to be used as initial working capital.
Greenpro
Asia Strategic SPC is controlled and managed by GC Investment Management Limited.
Greenpro
Venture Capital Limited is owned by Greenpro Capital Corp. The controlling shareholders of Greenpro Capital Corp. are Lee Chong Kuang
and Loke Che Chan.
On
July 10, 2018, Server Int’l Co., Ltd., which is owned and controlled by our CEO, Ms. Niu Yen-Yen, sold 200,000 shares of restricted
common stock at par value of $0.0001 per share to our Chief Financial Officer, Hsieh Chang-Chung.
From
August 1, 2018 to December 13, 2018, Ms. Niu Yen-Yen, the sole director and CEO of the Company has transferred 1,557,800 shares of common
stock to 16 non-US residents.
From
August 1, 2020 to July 31, 2021, Ms. Niu Yen-Yen had 395,000 common stocks transferred in and had sold 3,364,921 shares of common stock.
From
August 1, 2021 to July 31, 2022, Ms. Niu Yen-Yen had 55,522 shares of common stocks transferred in and had sold 6,800,000 shares of common
stock.
From
August 1, 2022 to July 31, 2023, Ms. Niu Yen-Yen had sold 610,000 shares of common stock.
On
November 1, 2022, Mr. Hsieh Chang-Chung resigned
as Chief Financial Officer of the Company and with immediate effect, Ms. Niu Yen-Yen appointed as
Chief Financial Officer of the Company.
During
the year ended July 31, 2023 and July 31, 2022, the Company paid $ 16,080 and $16,580 to Asia UBS Global Limited for professional services.
Related
Party Transactions
Related
party transactions as of July 31, 2023 and 2022 are as per table below:
| |
|
Year
ended
July 31, 2023 |
|
|
Year
ended
July 31, 2022 |
|
| |
|
|
(Audited) |
|
|
|
(Audited) |
|
| Professional
fee paid: |
|
|
|
|
|
|
|
|
| -
Related party A |
|
$ |
16,080 |
|
|
$ |
16,580 |
|
| |
|
|
|
|
|
|
|
|
| Consultation
fee paid: |
|
|
|
|
|
|
|
|
| -
Related party B |
|
$ |
8,100 |
|
|
$ |
32,400 |
|
| |
|
|
|
|
|
|
|
|
| Total |
|
$ |
24,180 |
|
|
$ |
48,980 |
|
Related
party A is the fellow subsidiaries of a corporate shareholder of the Company. Related party B and C are the shareholders of the Company.
For
the year ended July 31, 2023, the Company incurred professional fees of $16,080 due to related party A. Related party B is consultant
of the Company and has provided consultancy service for business operation.
The
related party transactions are generally transacted in an arm-length basis at the current market value in the normal course of business.
Review,
Approval and Ratification of Related Party Transactions
Given
our small size and limited financial resources, we have not adopted formal policies and procedures for the review, approval or ratification
of transactions, such as those described above, with our executive officer(s), Director(s) and significant stockholders. We intend to
establish formal policies and procedures in the future, once we have sufficient resources and have appointed additional Directors, so
that such transactions will be subject to the review, approval or ratification of our Board of Directors, or an appropriate committee
thereof. On a moving forward basis, our Director(s) will continue to approve any related party transaction.
ITEM
14. PRINCIPAL ACCOUNTING FEES AND SERVICES
Below
is the aggregate amount of fees billed for professional services rendered by our principal accountants with respect to our last two fiscal
years.
| | |
Year ended
July 31, 2023 | | |
Year ended July 31, 2022 | |
| Audit fees | |
$ | 15,000 | | |
$ | 15,000 | |
| Audit related fees | |
| 10,500 | | |
| 10,850 | |
| Tax fees | |
| - | | |
| - | |
| All other fees | |
| - | | |
| - | |
| Total | |
$ | 25,500 | | |
$ | 25,850 | |
The
category of “Audit fees” includes fees for our annual audit, quarterly reviews and services rendered in connection with regulatory
filings with the SEC, such as the issuance of comfort letters and consents.
The
category of “Audit-related fees” includes employee benefit plan audits, internal control reviews and accounting consultation.
All
of the professional services rendered by principal accountants for the audit of our annual financial statements that are normally provided
by the accountant in connection with statutory and regulatory filings or engagements for last two fiscal years were approved by our Board
of Directors.
PART
IV
ITEM
15. EXHIBITS AND FINANCIAL STATEMENT SCHEDULES
(a)
Financial Statements
The
following are filed as part of this report:
Financial
Statements
The
following financial statements of MU Global Holding Limited and Report of Independent Registered Public Accounting Firm are presented
in the “F” pages of this Report:
(b)
Exhibits
The
following exhibits are filed or “furnished” herewith:
*
Filed herewith.
**
As filed in the Registrant’s Registration Statement on Form S-1 Amendment No.3 (File No. 333-228847) on April 30, 2019.
SIGNATURES
Pursuant
to the requirements of the Securities Exchange Act of 1934, the registrant has duly caused this report to be signed on its behalf by
the undersigned, thereunto duly authorized.
| |
MU
GLOBAL HOLDING LIMITED. |
| |
(Name
of Registrant) |
| |
|
| Date:
October 30, 2023 |
By: |
/s/
NIU YEN YEN |
| |
Title: |
Chief
Executive Officer, Chief Financial Officer |
| |
|
President,
Director, Secretary and Treasurer |
| |
|
(Principal
Executive Officer, Principal Financial Officer, Principal Accounting Officer) |
INDEX
TO FINANCIAL STATEMENTS

REPORT
OF INDEPENDENT REGISTERED PUBLIC ACCOUNTING FIRM
The
Board of Directors and Stockholders of
MU
Global Holding Limited
Rm.
5, 7F., No. 296, Sec. 4,
Xinyi
Rd., Da’an Dist.,
Taipei
City 106427,
Taiwan
(R.O.C.)
Opinion on the Financial Statements
We have audited the accompanying consolidated balance
sheets of MU Global Holding Limited and subsidiaries (the ‘Company’) as of July 31, 2023 and 2022, and the related consolidated
statements of operations and comprehensive loss, stockholders’ equity, and cash flows for the each of two years in the year ended
of July 31, 2023 and 2022, and the related notes (collectively referred to as the “financial statements”). In our opinion,
the financial statements present fairly, in all material respects, the financial position of the Company as of July 31, 2023 and 2022,
and the results of its operations and its cash flows for the each of two years in the year ended July 31, 2023 and 2022, in conformity
with accounting principles generally accepted in the United States of America.
Basis for Opinion
These financial statements are the responsibility
of the Company’s management. Our responsibility is to express an opinion on the Company’s financial statements based on our
audits. We are a public accounting firm registered with the Public Company Accounting Oversight Board (United States) (“PCAOB”)
and are required to be independent with respect to the Company in accordance with the U.S. federal securities laws and the applicable
rules and regulations of the Securities and Exchange Commission and the PCAOB.
We conducted our audits in accordance with the standards
of the PCAOB. Those standards require that we plan and perform the audit to obtain reasonable assurance about whether the financial statements
are free of material misstatement, whether due to error or fraud. The Company is not required to have, nor were we engaged to perform,
an audit of its internal control over financial reporting. As part of our audits we are required to obtain an understanding of internal
control over financial reporting but not for the purpose of expressing an opinion on the effectiveness of the Company’s internal
control over financial reporting. Accordingly, we express no such opinion.
Our audits included performing procedures to assess
the risks of material misstatement of the financial statements, whether due to error or fraud, and performing procedures that respond
to those risks. Such procedures included examining, on a test basis, evidence regarding the amounts and disclosures in the financial statements.
Our audits also included evaluating the accounting principles used and significant estimates made by management, as well as evaluating
the overall presentation of the consolidated financial statements. We believe that our audits provide a reasonable basis for our opinion.
Going Concern
The accompanying financial statements have been prepared
assuming that the Company will continue as a going concern. As discussed in Note 2 to the financial statements, for the financial year
ended July 31, 2023, the Company’s losses from operations, accumulated deficit, capital deficiency and negative operating cash flows
raise substantial doubt about its ability to continue as a going concern. Management’s plans regarding those matters also are described
in Note 2. The financial statements do not include any adjustments that might result from the outcome of this uncertainty.
Critical Audit Matters
The critical audit matters
below are matters arising from the current period audit of the financial statements that were communicated or required to be communicated
to those charged with governance and that: (1) relate to accounts or disclosures that are material to the financial statements and (2)
involved our especially challenging, subjective, or complex judgements. The communication of critical audit matters does not alter in
any way our opinion on the financial statements, taken as a whole, and we are not, by communicating the critical audit matters below,
providing separate opinions on the critical audit matters or on the accounts or disclosures to which they relate.
Impairment of property,
plant and equipment and intangible assets
The Group has fully impaired
its property, plant and equipment and intangible assets since July 31, 2022. During the financial year ended July 31, 2023, the additional
intangible assets amounting to USD3,584 was fully impaired.
The Group carries out an
impairment test by comparing the recoverable amount of cash generating unit (“CGU”) based on value in use method and the carrying
amounts.
The impairment test was significant
to our audit due to complexity of the assessment process involving significant judgements and estimation uncertainty in making key assumptions
about future market and economic conditions growth rates, profit margins, discount rate, etc. for value in use of CGU based on the future
discounted cash flows.
Our procedures in relation
to management’s impairment assessments included, amongst others:
| (a) |
Examining management’s cash flows forecast that support the impairment assessment; |
| (b) |
Assessing the reliability of management’s forecast through the review of past trends of actual financial performance against previous forecast results; |
| (c) |
Evaluating the reasonableness and consistency of key assumptions and inputs used in cash flow projection to available external industry sources of data; |
| (d) |
Performing sensitivity analysis to stress test the key assumptions and inputs used in the impairment assessment; and |
| (e) |
Assessing the adequacy and reasonableness of the disclosures in the financial statements. |
| /s/
JP CENTURION & PARTNERS PLT |
|
| JP
CENTURION & PARTNERS PLT (ID: 6723) |
|
We
have served as the Company’s auditor since 2021.
Kuala
Lumpur, Malaysia
October
30, 2023
MU
GLOBAL HOLDING LIMITED
CONSOLIDATED
BALANCE SHEETS
AS
OF JULY 31, 2023 and 2022
(Currency
expressed in United States Dollars (“US$”), except for number of shares)
(Audited)
| | |
| | |
| |
| | |
As of July 31, | |
| | |
2023 | | |
2022 | |
| ASSETS | |
| | |
| |
| NON-CURRENT ASSETS | |
| | | |
| | |
| Property, plant and equipment | |
$ | - | | |
$ | - | |
| Leased asset – Right of use | |
| 6,407 | | |
| 6,267 | |
| | |
| | | |
| | |
| Total non-current assets,
excluding intangible assets | |
| 6,407 | | |
| 6,267 | |
| | |
| | | |
| | |
| INTANGIBLE ASSET | |
| | | |
| | |
| Patent and trademark | |
$ | - | | |
$ | - | |
| | |
| | | |
| | |
| Total non-current assets | |
| 6,407 | | |
| 6,267 | |
| | |
| | | |
| | |
| CURRENT ASSETS | |
| | | |
| | |
| Prepayments and deposits | |
$ | 9,264 | | |
$ | 45,094 | |
| Amount due from related party | |
| 2,112 | | |
| 11,295 | |
| Inventories | |
| 1,333 | | |
| 16,483 | |
| Cash and cash equivalents | |
| 4,425 | | |
| 2,909 | |
| | |
| | | |
| | |
| Total current assets | |
| 17,134 | | |
| 75,781 | |
| | |
| | | |
| | |
| TOTAL ASSETS | |
$ | 23,541 | | |
$ | 82,048 | |
| | |
| | | |
| | |
| LIABILITIES AND STOCKHOLDERS’ EQUITY | |
| | | |
| | |
| NON-CURRENT LIABILITIES | |
| | | |
| | |
| Leased liabilities | |
$ | 976 | | |
$ | 517 | |
| Loan from director | |
| 110,985 | | |
| 122,652 | |
| Loan from third party | |
| 95,988 | | |
| 77,064 | |
| | |
| | | |
| | |
| Total non-current liabilities | |
$ | 207,949 | | |
$ | 200,233 | |
| CURRENT LIABILITIES | |
| | | |
| | |
| Other payables and accrued liabilities | |
| 65,454 | | |
| 65,865 | |
| Amount due to related party | |
| 93,176 | | |
| 85,076 | |
| Deposit from franchisees | |
| 27,774 | | |
| 29,286 | |
| Deposit from customers | |
| 37,135 | | |
| 39,296 | |
| Loan from director | |
| 170,805 | | |
| 146,439 | |
| Loan from related party | |
| - | | |
| 43,175 | |
| Leased liabilities | |
| 5,223 | | |
| 6,042 | |
| | |
| | | |
| | |
| Total current liabilities | |
| 399,567 | | |
| 415,179 | |
| | |
| | | |
| | |
| TOTAL LIABILITIES | |
$ | 607,516 | | |
$ | 615,412 | |
| | |
| | | |
| | |
| STOCKHOLDERS’ EQUITY | |
| | | |
| | |
| Preferred stock, $0.0001 par value, 200,000,000 shares authorized, None issued and outstanding | |
$ | - | | |
$ | - | |
| Common stock, $0.0001 par value, 600,000,000 shares authorized, 59,434,838 shares issued and outstanding as of July 31, 2023 and July 31, 2022 respectively | |
| 5,943 | | |
| 5,943 | |
| Additional paid-in capital | |
| 1,831,111 | | |
| 1,830,300 | |
| Foreign currency adjustment | |
| 36,979 | | |
| 19,574 | |
| Accumulated deficit | |
| (2,458,008 | ) | |
| (2,389,181 | ) |
| | |
| | | |
| | |
| Total stockholders’ equity | |
| (583,975 | ) | |
| (533,364 | ) |
| | |
| | | |
| | |
| TOTAL LIABILITIES AND STOCKHOLDERS’ EQUITY | |
$ | 23,541 | | |
$ | 82,048 | |
See
accompanying notes to consolidated financial statements.
MU
GLOBAL HOLDING LIMITED
CONSOLIDATED
STATEMENTS OF OPERATIONS AND COMPREHENSIVE LOSS
FOR
THE YEARS ENDED JULY 31, 2023 AND 2022
(Currency
expressed in United States Dollars (“US$”), except for number of shares)
(Audited)
| | |
For the year
ended
July 31, 2023 | | |
For the year
ended
July 31, 2022 | |
| REVENUE | |
$ | 146,252 | | |
$ | 46,702 | |
| | |
| | | |
| | |
| COST OF REVENUE | |
| (123,088 | ) | |
| (21,891 | ) |
| | |
| | | |
| | |
| GROSS PROFIT | |
| 23,164 | | |
| 24,811 | |
| | |
| | | |
| | |
| OTHER INCOME | |
| 72,851 | | |
| 50,036 | |
| | |
| | | |
| | |
| SELLING AND MARKETING EXPENSES | |
| (1,531 | ) | |
| (3,470 | ) |
| | |
| | | |
| | |
| GENERAL AND ADMINISTRATIVE EXPENSES | |
| (163,311 | ) | |
| (428,710 | ) |
| | |
| | | |
| | |
| | |
| | | |
| | |
| INCOME TAXES PROVISION | |
| - | | |
| - | |
| | |
| | | |
| | |
| NET LOSS | |
| (68,827 | ) | |
| (357,333 | ) |
| | |
| | | |
| | |
| Other comprehensive loss: | |
| | | |
| | |
| - Foreign exchange translation gain | |
| 17,405 | | |
| 14,876 | |
| | |
| | | |
| | |
| TOTAL COMPREHENSIVE LOSS | |
$ | (51,422 | ) | |
$ | (342,457 | ) |
| | |
| | | |
| | |
| Net loss per share - Basic and diluted | |
| (0.0009 | ) | |
| (0.0058 | ) |
| | |
| | | |
| | |
| Weighted average number of common shares outstanding - Basic and diluted | |
| 59,434,838 | | |
| 59,434,838 | |
See
accompanying notes to consolidated financial statements.
MU
GLOBAL HOLDING LIMITED
CONSOLIDATED
STATEMENTS OF CHANGES IN STOCKHOLDERS’ EQUITY
FOR
THE YEARS ENDED JULY 31, 2023 AND 2022
(Currency
expressed in United States Dollars (“US$”), except for number of shares)
(Audited)
| | |
Number of Shares | | |
Amount | | |
| | |
| | |
| | |
| |
| | |
COMMON
SHARES | | |
ADDITIONAL PAID-IN CAPITAL | | |
ACCUMULATED OTHER COMPREHENSIVE INCOME | | |
ACCUMULATED DEFICIT | | |
TOTAL EQUITY | |
| | |
Number of Shares | | |
Amount | | |
| | |
| | |
| | |
| |
| Balance as of July 31, 2021 | |
| 59,434,838 | | |
$ | 5,943 | | |
$ | 1,830,300 | | |
$ | 4,698 | | |
$ | (2,031,848 | ) | |
$ | (190,907 | ) |
| Net loss for the year | |
| - | | |
| - | | |
| - | | |
| - | | |
| (357,333 | ) | |
| (357,333 | ) |
| Foreign currency translation adjustment | |
| - | | |
| - | | |
| - | | |
| 14,876 | | |
| - | | |
| 14,876 | |
| | |
| | | |
| | | |
| | | |
| | | |
| | | |
| | |
| Balance as of July 31, 2022 | |
| 59,434,838 | | |
$ | 5,943 | | |
$ | 1,830,300 | | |
$ | 19,574 | | |
$ | (2,389,181 | ) | |
$ | (533,364 | ) |
| Balance value | |
| 59,434,838 | | |
$ | 5,943 | | |
$ | 1,830,300 | | |
$ | 19,574 | | |
$ | (2,389,181 | ) | |
$ | (533,364 | ) |
| Net loss for the year | |
| - | | |
| - | | |
| - | | |
| - | | |
| (68,827 | ) | |
| (68,827 | ) |
| Foreign currency translation adjustment | |
| - | | |
| - | | |
| 811 | | |
| 17,405 | | |
| - | | |
| 18,216 | |
| | |
| | | |
| | | |
| | | |
| | | |
| | | |
| | |
| Balance as of July 31, 2023 | |
| 59,434,838 | | |
$ | 5,943 | | |
$ | 1,831,111 | | |
$ | 36,979 | | |
$ | (2,458,008 | ) | |
$ | (583,975 | ) |
| Balance value | |
| 59,434,838 | | |
$ | 5,943 | | |
$ | 1,831,111 | | |
$ | 36,979 | | |
$ | (2,458,008 | ) | |
$ | (583,975 | ) |
See
accompanying notes to consolidated financial statements
MU
GLOBAL HOLDING LIMITED
CONSOLIDATED
STATEMENT OF CASH FLOWS
FOR
THE YEARS ENDED JULY 31, 2023 AND 2022
(Currency
expressed in United States Dollars (“US$”))
(Audited)
| | |
For the year
ended
July 31, 2023 | | |
For the year
ended
July 31, 2022 | |
| CASH FLOWS FROM OPERATING ACTIVITIES: | |
| | | |
| | |
| Net loss | |
$ | (68,827 | ) | |
$ | (357,333 | ) |
| Adjustments to reconcile net loss to net cash used in operating activities: | |
| | | |
| | |
| Depreciation and amortization | |
| 4,837 | | |
| 102,904 | |
| Impairment of fixed assets | |
| (2,780 | ) | |
| 174,973 | |
| Asset written-off | |
| (6 | ) | |
| 100 | |
| Lease interest | |
| 176 | | |
| - | |
| Gain on disposal | |
| (14,144 | ) | |
| (27,539 | ) |
| Gain on re-measurement of extended loan repayment | |
| (15,090 | ) | |
| - | |
| Waiver of debts | |
| (40,109 | ) | |
| - | |
| Interest expense | |
| 9,851 | | |
| 2,641 | |
| Prepayment written-off | |
| 35,915 | | |
| - | |
| Changes in operating assets and liabilities: | |
| | | |
| | |
| Prepayments and deposits | |
| (1,450 | ) | |
| 54,782 | |
| Amount due from related parties | |
| 9,183 | | |
| (868 | ) |
| Inventories | |
| 14,244 | | |
| 20,284 | |
| Other payables and accrued liabilities | |
| 1,978 | | |
| 3,485 | |
| Amount due to related parties | |
| 8,100 | | |
| 31,800 | |
| Leased liabilities | |
| (5,395 | ) | |
| (6,185 | ) |
| Deposit from franchisees | |
| - | | |
| (3,213 | ) |
| Net cash used in operating activities | |
$ | (63,517 | ) | |
$ | (4,169 | ) |
| | |
| | | |
| | |
| CASH FLOWS FROM INVESTING ACTIVITIES: | |
| | | |
| | |
| Proceed on disposal of property, plant and equipment | |
| 20,514 | | |
| 44,340 | |
| Purchase of trademark | |
$ | (3,584 | ) | |
$ | (2,841 | ) |
| Purchase of property, plant and equipment | |
| - | | |
| (41,811 | ) |
| Net cash generated from/(used in) investing activities | |
$ | 16,930 | | |
$ | (312 | ) |
| | |
| | | |
| | |
| CASH FLOWS FROM FINANCING ACTIVITIES: | |
| | | |
| | |
| Loan from director | |
$ | 24,366 | | |
$ | (1,222 | ) |
| Loan from related party | |
| (2,873 | ) | |
| (8,018 | ) |
| Loan from third party | |
| 24,717 | | |
| (5,721 | ) |
| Net cash generated from/(used in) financing activities | |
$ | 46,210 | | |
$ | (14,961 | ) |
| | |
| | | |
| | |
| Effect of foreign exchange translation | |
| 1,893 | | |
| 2,120 | |
| | |
| | | |
| | |
| Net change in cash and cash equivalents | |
| 1,516 | | |
| (17,322 | ) |
| | |
| | | |
| | |
| Cash and cash equivalents, beginning of year | |
$ | 2,909 | | |
$ | 20,231 | |
| | |
| | | |
| | |
| CASH AND CASH EQUIVALENTS, END OF YEAR | |
$ | 4,425 | | |
$ | 2,909 | |
See
accompanying notes to consolidated financial statements.
MU
GLOBAL HOLDING LIMITED
NOTES
TO CONSOLIDATED FINANCIAL STATEMENTS
FOR
THE YEARS ENDED JULY 31, 2023 AND 2022
(Currency
expressed in United States Dollars (“US$”), except for number of shares)
1.
ORGANIZATION AND BUSINESS BACKGROUND
MU
Global Holding Limited is organized as a Nevada limited liability company, incorporated on June 4, 2018. For purposes of consolidated
financial statement presentation, MU Global Holding Limited and its subsidiary are herein referred to as “the Company” or
“we”. The Company business of which planned principal operations are to provide wellness and beauty services to customers
via Company owned outlets, franchised outlets or distribution of our product to third party wellness and beauty salon.
On
June 29, 2018, the Company acquired 100% interest in MU Worldwide Group Limited, a private limited liability company incorporated in
Seychelles and its subsidiary MU Global Holding Limited, a private limited liability company incorporated in Hong Kong. On August 16,
2018, MU Global Holding Limited incorporated a wholly-owned subsidiary in Shanghai, People Republic of China under the name of MU Global
Health Management (Shanghai) Limited.
The
accompanying financial statements have been prepared on a going concern basis, which contemplates the realization of assets and the settlement
of liabilities and commitments in the normal course of business. As reflected in the accompanying financial statements, for the year
ended July 31, 2023, the Company incurred a net loss of $68,827, as of that date, the Company’s current liabilities exceeded its
current assets by $382,433, had an accumulated deficit of $2,458,008, capital deficiency of $583,975 and net operating cash flows of
$63,517 which raise substantial doubt about the Company’s ability to continue as a going concern within one year of the date that
the financial statements are issued. The financial statements do not include any adjustments that might be necessary if the Company is
unable to continue as a going concern.
Details
of the Company’s subsidiaries:
SCHEDULE
OF COMPANY’S SUBSIDIARY
| | |
Company name | |
Place and
date of incorporation | |
Particulars of issued capital | |
Principal
activities | |
Proportional
of ownership interest and voting power held | |
| 1. | |
MU Worldwide Group Limited | |
Seychelles, June 7, 2018 | |
100 shares of ordinary share of US$1 each | |
Investment holding | |
| 100 | % |
| 2. | |
MU Global Holding Limited | |
Hong Kong, January 30, 2018 | |
1 share of ordinary share of HK$1 each | |
Providing SPA and wellness service in Hong Kong | |
| 100 | % |
| 3. | |
MU Global Health Management (Shanghai) Limited | |
Shanghai, August 16, 2018 | |
RMB 7,405,866 | |
Providing SPA and wellness service in China | |
| 100 | % |
MU
GLOBAL HOLDING LIMITED
NOTES
TO CONSOLIDATED FINANCIAL STATEMENTS
FOR
THE YEARS ENDED JULY 31, 2023 AND 2022
(Currency
expressed in United States Dollars (“US$”), except for number of shares)
Business
Overview
MU
Global is a beauty and wellness company, providing SPA and wellness service and also SPA related products to the customers. The services
provided are designed to improve the overall health system and body function.
Since
the establishment, the Company has been focusing to expand in the Chinese market, with other country also under consideration as target
destinations. As an emerging industry in China, the beauty and wellness industry are still in the early stage as there is a huge potential
for the industry to growth significantly. According to a report published by the Chinese State Department, the beauty and wellness industry
of the country is expected reach the market value of China 8 trillion Chinese Yuan by 2020, accounting for 6.5% of the country Gross
Domestic Product (GDP).
In
year 2020, COVID-19 crisis has resulted the sales of the global beauty and wellness industry weak due to consumers have had limited access
to retail outlets and supply chain bottlenecks have reduced product availability. In China, the industry’s February sales fell
up to 80 percent compared with 2019. Nevertheless, based on Mckinsey and Company research report on April 8, 2021, shows that consumers
care deeply about wellness—and that their interest is growing and estimate the global wellness market at more than US$1.5 trillion,
with annual growth of 5 to 10 percent. A rise in both consumer interest and purchasing power presents tremendous opportunities for companies,
particularly as spending on personal wellness rebounds after stagnating or even declining during the COVID-19 crisis
China
has large territory, population, diverse ethnicity and cultural background. As such, it has resulted in different consumer orientations
in different cities and townships across the country, which is particularly challenging to tackle the consumer market with a single business
model.
The
advance in technological development and rise in use of technology in marketing has also intensified the competition, probing the Company
to develop the business models that allow quick penetration and huge coverage of different markets, and also being able to cope with
the swift changes in the consumer market. Thus, the Company is focusing on three key areas as part of the Company’s early development
in the Chinese market.
The
first and most key focus is to enter the regional market through the adoption of franchisee and agent model, which the other parties
are familiar and have deep understanding in the local market, hence its operating strategy is effective and best suited the targeted
region.
Second,
the key strategy is to ensure rapid development of the Omni channel marketing plan which targets to lease out at least ten thousand Stone
Spa Bed (Hot Stone Bath equipment), reducing the time cost for the development of project, and most importantly, working on to spur sales
and revenue growth.
Lastly,
the essential requirement for business success in the Chinese market is to ensure and maintain a clear and transparent business model,
which would result in effective collaboration between the company and its agent/franchisee, and consequently leads to efficient market
operation and a win-win situation between the two parties.
Currently,
the Company operates in the Chinese market with two business models:
| 1. |
Tripartite
co-operation and profit sharing model. |
| |
|
| 2. |
Large-scale
chain agent model |
| |
|
| 3.
|
Direct-
service store model |
2.
SUMMARY OF SIGNIFICANT ACCOUNTING POLICIES
The
accompanying consolidated financial statements reflect the application of certain significant accounting policies as described in this
note and elsewhere in the accompanying consolidated financial statements and notes.
Basis
of presentation
These
accompanying consolidated financial statements have been prepared in accordance with generally accepted accounting principles in the
United States of America (“US GAAP”).
The
Company has adopted its fiscal year-end to be July 31.
Basis
of consolidation
The
consolidated financial statements include the accounts of the Company and its subsidiaries. All inter-company accounts and transactions
have been eliminated upon consolidation.
MU
GLOBAL HOLDING LIMITED
NOTES
TO CONSOLIDATED FINANCIAL STATEMENTS
FOR
THE YEARS ENDED JULY 31, 2023 AND 2022
(Currency
expressed in United States Dollars (“US$”), except for number of shares)
Use
of estimates
Management
uses estimates and assumptions in preparing these financial statements in accordance with US GAAP. Those estimates and assumptions affect
the reported amounts of assets and liabilities, the disclosure of contingent assets and liabilities in the balance sheets, and the reported
revenue and expenses during the periods reported. Actual results may differ from these estimates.
Revenue
recognition
Financial
Accounting Standards Board, or FASB, issued ASC 606. The standard is a comprehensive new revenue recognition model that requires revenue
to be recognized in a manner to depict the transfer of goods or services to a customer at an amount that reflects the consideration expected
to be received in exchange for those goods or services.
Revenue
is measured at the fair value of the consideration received or receivable, net of discounts and taxes applicable to the revenue. The
Company derives its revenue from provision of wellness and beauty services to customers via Company owned outlets, franchised outlets
or distribution of our product to third party wellness and beauty salon.
Cost
of revenue
Cost
of revenue includes the cost of services and product incurred to provide wellness and beauty services and purchase of products.
Cash
and cash equivalents
Cash
and cash equivalents are carried at cost and represent cash on hand, demand deposits placed with banks or other financial institutions
and all highly liquid investments with an original maturity of three months or less as of the purchase date of such investments.
Property,
plant and equipment
Property,
plant and equipment are stated at cost less accumulated depreciation and accumulated impairment losses, if any. Depreciation is calculated
on the straight-line basis over the following expected useful lives from the date on which they become fully operational:
SCHEDULE
OF PROPERTY, PLANT AND EQUIPMENT ESTIMATED LIFE
| Classification |
|
Estimated
useful life |
| Leasable
equipment |
|
5
years |
| Computer
hardware and software |
|
3
years |
| Office
equipment |
|
3
years |
| Outlet
design fee and equipment |
|
3
years |
| Application
development fee |
|
3
years |
Expenditures
for maintenance and repairs are expensed as incurred. The gain or loss on the disposal of property, plant and equipment is the difference
between the net sales proceeds and the carrying amount of the relevant assets and is recognized in the Consolidated Statements of Operations
and Comprehensive Loss.
Impairment
of long-live assets
Long-lived
assets primarily include trademark of the Company. In accordance with the provision of ASC Topic 360, Impairment or Disposal of Long-Lived
Assets, the Company generally conducts its annual impairment evaluation to its long-lived assets, usually in the fourth quarter of
each fiscal year, or more frequently if indicators of impairment exist, such as significant sustained change in the business climate.
The recoverability of long-lived assets is measured at the lowest level group. If the total of the expected undiscounted future net cash
flows is less than the carrying amount of the asset, a loss is recognized for the difference between the fair value and carrying amount
of the asset.
MU
GLOBAL HOLDING LIMITED
NOTES
TO CONSOLIDATED FINANCIAL STATEMENTS
FOR
THE YEARS ENDED JULY 31, 2023 AND 2022
(Currency
expressed in United States Dollars (“US$”), except for number of shares)
Leases
The
Company recognizes lease payments for its short-term lease on a straight-line basis over the lease term in accordance with ASC 842.
The
right-of-use asset is initially measured at cost, which comprises the initial amount of the lease liability adjusted for lease payments
made at or before the lease commencement date, plus any initial direct costs incurred less any lease incentives received. Costs associated
with operating lease assets are recognized on a straight-line basis within operating expenses over the term of the lease.
In
determining the present value of the unpaid lease payments, ASC 842 requires a lessee to discount its unpaid lease payments using the
interest rate implicit in the lease or, if that rate cannot be readily determined, its incremental borrowing rate. As most of the Company
leases do not provide an implicit rate, the Company uses its incremental borrowing rate as the discount rate for the lease. The Company
incremental borrowing rate is estimated to approximate the interest rate on a collateralized basis with similar terms and payments.
Inventories
Inventories
consisting of products available for sell, are stated at the lower of cost or market value. Cost of inventory is determined using the
first-in, first-out (FIFO) method. Inventory reserve is recorded to write down the cost of inventory to the estimated market value due
to slow-moving merchandise and damaged goods, which is dependent upon factors such as historical and forecasted consumer demand, and
promotional environment. The Company takes ownership, risks and rewards of the products purchased. Write downs are recorded in cost of
revenues in the Consolidated Statements of Operations and Comprehensive Loss.
Income
taxes
Income
taxes are determined in accordance with the provisions of ASC Topic 740, “Income Taxes” (“ASC 740”). Under this
method, deferred tax assets and liabilities are recognized for the future tax consequences attributable to differences between the financial
statement carrying amounts of existing assets and liabilities and their respective tax basis. Deferred tax assets and liabilities are
measured using enacted income tax rates expected to apply to taxable income in the periods in which those temporary differences are expected
to be recovered or settled. Any effect on deferred tax assets and liabilities of a change in tax rates is recognized in income in the
period that includes the enactment date.
ASC
740 prescribes a comprehensive model for how companies should recognize, measure, present, and disclose in their financial statements
uncertain tax positions taken or expected to be taken on a tax return. Under ASC 740, tax positions must initially be recognized in the
financial statements when it is more likely than not the position will be sustained upon examination by the tax authorities. Such tax
positions must initially and subsequently be measured as the largest amount of tax benefit that has a greater than 50% likelihood of
being realized upon ultimate settlement with the tax authority assuming full knowledge of the position and relevant facts.
The
Company conducts major businesses in China and is subject to tax in this jurisdiction. As a result of its business activities, the Company
will file tax returns that are subject to examination by the foreign tax authority.
Going
concern
The
accompanying financial statements have been prepared using the going concern basis of accounting, which contemplates the realization
of assets and the satisfaction of liabilities in the normal course of business.
For
the year ended July 31, 2023, the Company has generated revenue of $146,252 and continuously incurred a net loss of $68,827. As of July
31, 2023, the Company suffered an accumulated deficit of $2,458,008, capital deficiency of $583,975 and negative operating cash flows
of $63,517. The Company’s ability to continue as a going concern is dependent upon improving the profitability and the continuing
financial support from its shareholders and director. Management believes the existing shareholders, director or external financing will
provide the additional cash to meet the Company’s obligations as they become due.
These
and other factors raise substantial doubt about the Company’s ability to continue as a going concern. These financial statements
do not include any adjustments to reflect the possible future effects on the recoverability and classification of assets or the amounts
and classification of liabilities that may result in the Company not being able to continue as a going concern.
MU
GLOBAL HOLDING LIMITED
NOTES
TO CONSOLIDATED FINANCIAL STATEMENTS
FOR
THE YEARS ENDED JULY 31, 2023 AND 2022
(Currency
expressed in United States Dollars (“US$”), except for number of shares)
Net
loss per share
The
Company calculates net loss per share in accordance with ASC Topic 260 “Earnings Per Share”. Basic loss per share
is computed by dividing the net loss by the weighted average number of common shares outstanding during the period. Diluted loss per
share is computed similar to basic loss per share except that the denominator is increased to include the number of additional common
shares that would have been outstanding if the potential common stock equivalents had been issued and if the additional common shares
were dilutive.
Foreign
currencies translation
Transactions
denominated in currencies other than the functional currency are translated into the functional currency at the exchange rates prevailing
at the dates of the transaction. Monetary assets and liabilities denominated in currencies other than the functional currency are translated
into the functional currency using the applicable exchange rates at the balance sheet dates. The resulting exchange differences are recorded
in the Consolidated Statements of Operations and Comprehensive loss.
The
functional currency of the parent Company is United States dollar and the functional currency of the subsidiaries MU Worldwide Group
Limited (Seychelles) and MU Global Holding Limited (Hong Kong) is United States dollar. MU Global Health Management (Shanghai) Limited
is in Renminbi.
The
reporting currency of the Company and its subsidiary is United States Dollars (“US$”) and the accompanying financial statements
have been expressed in US$.
In
general, for consolidation purposes, assets and liabilities of its subsidiaries whose functional currency is not US$ are translated into
US$, in accordance with ASC Topic 830-30, “Translation of Financial Statement”, using the exchange rate on the balance
sheet date. Revenues and expenses are translated at average rates prevailing during the period. The gains and losses resulting from translation
of financial statements of foreign subsidiary are recorded as a separate component of accumulated other comprehensive loss within the
statements of stockholders’ equity.
Translation
of amounts from RMB, TWD and HK$ into US$1 has been made at the following exchange rates for the respective periods:
SCHEDULE
OF FOREIGN EXCHANGE RATES TRANSLATION
| | |
As of and for the year ended July 31, | |
| | |
2023 | | |
2022 | |
| Year-end RMB : US$1 exchange rate | |
| 7.136 | | |
| 6.744 | |
| Year-average RMB : US$1 exchange rate | |
| 6.989 | | |
| 6.476 | |
| Year-end HK$ : US$1 exchange rate | |
| 7.799 | | |
| 7.850 | |
| Year-average HK$ : US$1 exchange rate | |
| 7.835 | | |
| 7.811 | |
| Year-end TWD : US$1 exchange rate | |
| 31.461 | | |
| 30.044 | |
| Year-average TWD : US$1 exchange rate | |
| 30.805 | | |
| 28.500 | |
Related
parties
Parties,
which can be a corporation or individual, are considered to be related if the Company has the ability, directly or indirectly, to control
the other party or exercise significant influence over the other party in making financial and operating decisions. Companies are also
considered to be related if they are subject to common control or common significant influence.
MU
GLOBAL HOLDING LIMITED
NOTES
TO CONSOLIDATED FINANCIAL STATEMENTS
FOR
THE YEARS ENDED JULY 31, 2023 AND 2022
(Currency
expressed in United States Dollars (“US$”), except for number of shares)
Fair
value of financial instruments:
The
carrying value of the Company’s financial instruments: cash and cash equivalents, subscription receivables, prepayment and deposits,
accounts payable, and other payables and accrued liabilities approximate at their fair values because of the short-term nature of these
financial instruments.
The
Company also follows the guidance of the ASC Topic 820-10, “Fair Value Measurements and Disclosures” (“ASC 820-10”),
with respect to financial assets and liabilities that are measured at fair value. ASC 820-10 establishes a three-tier fair value hierarchy
that prioritizes the inputs used in measuring fair value as follows:
| |
Level
1: Observable inputs such as quoted prices in active markets; |
| |
|
| |
Level
2: Inputs, other than the quoted prices in active markets, that are observable either directly or indirectly; and |
| |
|
| |
Level
3: Unobservable inputs in which there is little or no market data, which require the reporting entity to develop its own assumptions. |
Recently
Adopted Accounting Standards
In
June 2016, the FASB issued Accounting Standards Update No. 2016-13, Financial Instruments – Credit Losses (Topics 326): Measurement
of Credit Losses on Financial Instruments, which introduced the expected credit losses methodology for the measurement of credit losses
on financial assets measured at amortized cost basis, replacing the previous incurred loss methodology. In November 2019, the FASB issued
ASU 2019-10 highlighted the adoption timeline. For smaller reporting entities, Topic 326 is effective for annual periods beginning after
December 15, 2022, including interim period within those fiscal years, of which is effective for the Company on January 1, 2023.
Credit
loss rate is determined by historical collection based on aging schedule, adjusted for current conditions using reasonable and supportable
forecast. Based on the aging categorization and the adjusted loss per category, an allowance for credit losses is calculated by multiplying
the adjusted loss rate with the amortized cost in the respective age category.
Recent
accounting pronouncements
The
Company has implemented all new accounting pronouncements that are in effect. These pronouncements did not have any material impact on
the financial statements unless otherwise disclosed, and the Company does not believe that there are any other new accounting pronouncements
that have been issued that might have a material impact on its financial position or results of operations.
MU
GLOBAL HOLDING LIMITED
NOTES
TO CONSOLIDATED FINANCIAL STATEMENTS
FOR
THE YEARS ENDED JULY 31, 2023 AND 2022
(Currency
expressed in United States Dollars (“US$”), except for number of shares)
3.
COMMON STOCK
On
June 4, 2018, our Chief Executive Officer, Ms. Niu Yen-Yen subscribed 100,000 shares of restricted common stock of the Company at par
value of $0.0001 per share. The monies from this transaction, which totalled $10, went to the Company to be used as initial working capital.
On
July 6, 2018, Ms. Niu Yen-Yen and Server Int’l Co., Ltd. subscribed 25,000,000 and 11,000,000 restricted shares of common stock,
respectively, of the Company, at par value of $0.0001 per share. The monies from these transactions, which totalled $3,600, went to the
Company to be used as initial working capital. Server Int’l Co., Ltd. is controlled entirely by Ms. Niu Yen-Yen.
On
July 7, 2018, Chang Chun-Ying and Chang Su-Fen subscribed 4,300,000 and 5,000,000 restricted shares of common stock, respectively, of
the Company, at par value of $0.0001 per share. The monies from these transactions, which totalled $930, went to the Company to be used
as initial working capital.
On
July 9, 2018, GreenPro Asia Strategic SPC and GreenPro Venture Capital Limited subscribed 2,835,000 and 2,165,000 restricted shares of
common stock of the Company, respectively, at par value of $0.0001 per share. The monies from these transactions, which totalled $500,
went to the Company to be used as initial working capital.
From
July 9, 2018 to July 10, 2018 the Company issued a total of 2,150,000 shares of restricted common stock to three non-US residents. Shares
were sold at par value, $0.0001 per share. Total proceeds from these shares totalled $215 and went to the Company to be used as initial
working capital.
On
July 10, 2018, Server Int’l Co., Ltd, a Company solely controlled and owned by the CEO, transferred 1,500,000 shares of common
stock to 8 non-US residents.
On
July 11, 2018 the Company issued a total of 710,000 shares of restricted common stock to two non-US residents at a price of $0.03 per
share. Total proceeds from these sales of shares totalled $21,300 and went to the Company to be used as initial working capital.
On
July 25, 2018 the Company issued a total of 995,000 shares of restricted common stock to ten non-US residents at a price of $0.03 per
share. Total proceeds from these sales of shares totalled $29,850 and went to the Company to be used as initial working capital.
On
July 26, 2018 the Company issued 250,000 shares of restricted common stock to one non-US resident at a price of $0.20 per share. Total
proceeds from these sales of shares totalled $50,000 and went to the Company to be used as initial working capital.
On
July 31, 2018 Dezign Format Pte Ltd and Cheng Young-Chien each subscribed 2,000,000 restricted shares of common stock of the Company,
at $0.20 per share, for total consideration of $800,000. Proceeds went to the Company to be used as initial working capital.
From
August 1, 2018 to December 13, 2018, Ms. Niu Yen-Yen, the CEO of the Company, transferred 1,557,800 shares of common stock to 16 non-US
residents.
On
May 7, 2019, the convertible promissory note issued by the Company amounted $779,125 to 45 accredited investors who reside in Taiwan
with the conversion price of $1 per share have been converted to 779,125 shares of common stock of the company after the S-1 registration
statement was declared effective on May 6, 2019.
From
May 14, 2019 to July 31, 2019, the Company issued 150,317 shares of common stock at a price of $1.00 per share through the Initial Public
Offering (IPO) to 36 non-US residents.
From
August 1, 2020 to July 31, 2021, Ms. Niu Yen-Yen, the CEO of the Company, had 395,000 shares of common stock transferred from 3 non-US
residents and had sold 3,364,921 shares of common stock to 20 non-US residents.
From
August 1, 2021 to July 31, 2022, Ms. Niu Yen-Yen, the CEO of the Company, had 55,522 shares of common stock transferred from 2 non-US
residents and had sold 6,800,000 shares of common stock to 3 non-US residents.
From
August 1, 2022 to July 31, 2023, Ms. Niu Yen-Yen had sold 610,000 shares of common stock to 5 non-US residents.
As
of July 31, 2023, the Company has an issued and outstanding common share of 59,434,838.
MU
GLOBAL HOLDING LIMITED
NOTES
TO CONSOLIDATED FINANCIAL STATEMENTS
FOR
THE YEARS ENDED JULY 31, 2023 AND 2022
(Currency
expressed in United States Dollars (“US$”), except for number of shares)
4.
PROPERTY, PLANT AND EQUIPMENT
SCHEDULE OF PROPERTY, PLANT AND EQUIPMENT
| | |
As of
July 31, 2023 | | |
As of
July 31, 2022 | |
| | |
(Audited) | | |
(Audited) | |
| Computer hardware and software | |
$ | 129,301 | | |
$ | 129,301 | |
| Office equipment | |
| 120,569 | | |
| 120,569 | |
| Leasable equipment1 | |
| 216,378 | | |
| 229,405 | |
| Outlet design fee and equipment | |
| 16,763 | | |
| 16,763 | |
| Application development fee | |
| 37,413 | | |
| 37,413 | |
| Total | |
| 520,424 | | |
| 533,451 | |
| Accumulated depreciation2 | |
| (395,140 | ) | |
| (401,797 | ) |
| Impairment | |
| (143,182 | ) | |
| (149,552 | ) |
| Foreign currency translation adjustment | |
| 17,898 | | |
| 17,898 | |
| Property, plant and equipment, net | |
$ | - | | |
| - | |
WRITE
OFF OF PROPERTY, PLANT AND EQUIPMENT
SCHEDULE OF WRITE OFF OF PROPERTY, PLANT AND EQUIPMENT
| | |
| | |
| |
| | |
As of July 31, 2023 (Audited) | | |
As of July 31, 2022 (Audited) | |
| Write off of property and equipment | |
$ | - | | |
$ | 1,686 | |
| Accumulated depreciation | |
| - | | |
| (1,624 | ) |
| Foreign currency translation adjustment | |
| - | | |
| 38 | |
| Total write off of property and equipment | |
$ | - | | |
$ | 100 | |
DISPOSAL
OF PROPERTY, PLANT AND EQUIPMENT
SCHEDULE OF DISPOSAL OF PROPERTY, PLANT AND EQUIPMENT
| | |
| | |
| |
| | |
As of July 31, 2023 (Audited) | | |
As of July 31, 2022 (Audited) | |
| Proceed from disposal of property, plant and equipment | |
$ | 20,514 | | |
$ | 44,340 | |
| Disposal of equipment at cost | |
| - | | |
| (27,726 | ) |
| Disposal of equipment written off at net book value | |
| (6 | ) | |
| - | |
| Disposal of equipment impaired at net book value | |
| (6,364 | ) | |
| - | |
| Accumulated depreciation | |
| - | | |
| 10,965 | |
| Foreign currency translation adjustment | |
| - | | |
| (40 | ) |
| Total gain on disposal | |
$ | 14,144 | | |
$ | 27,539 | |
5.
LEASE
As
of November 6, 2021, the Company recognized approximately US$11,581
lease liability as well as right-of-use asset
for all leases at the commencement date. Lease liabilities are measured at present value of the sum of remaining rental payments as of
November 6, 2021, with discounted rate of 4.35%
adopted from “Zhao Shang bank” of China as a reference for discount rate.
MU
GLOBAL HOLDING LIMITED
NOTES
TO CONSOLIDATED FINANCIAL STATEMENTS
FOR
THE YEARS ENDED JULY 31, 2023 AND 2022
(Currency
expressed in United States Dollars (“US$”), except for number of shares)
A
single lease cost is recognized over the lease term on a generally straight-line basis. All cash payments of operating lease cost are
classified within operating activities in the statement of cash flows.
The
initial recognition of operating lease right and lease liability as follow:
SCHEDULE OF RECOGNITION OF OPERATING LEASE RIGHT AND LEASE LIABILITY
| | |
| | |
| Gross lease payable | |
$ | 12,048 | |
| Less: Imputed interest | |
| (467 | ) |
| Initial recognition | |
$ | 11,581 | |
| Less: Remeasurement of existing lease | |
| (843 | ) |
| Balance | |
$ | 10,738 | |
As
of July 31, 2023 and July 31, 2022 operating lease right of use asset as follow:
SCHEDULE OF OPERATING LEASE RIGHT OF USE ASSET
| | |
As of July 31, 2023 (Audited) | | |
As of July 31, 2022 (Audited) | |
| Balance | |
| 6,267 | | |
| 12,966 | |
| Less: Termination of lease | |
| - | | |
| (10,285 | ) |
| Add: New operating lease liability | |
| 5,223 | | |
| 10,738 | |
| Foreign exchange translation loss | |
| (246 | ) | |
| (407 | ) |
| Amortization | |
| (4,837 | ) | |
| (6,745 | ) |
| Balance end of the year | |
$ | 6,407 | | |
$ | 6,267 | |
As
of July 31, 2023 and July 31, 2022 operating lease liability as follow:
SCHEDULE
OF OPERATING LEASE LIABILITY
| | |
As of July 31, 2023 (Audited) | | |
As of July 31, 2022 (Audited) | |
| As of August 1 | |
$ | 6,559 | | |
$ | 2,647 | |
| Less: Termination of lease | |
| - | | |
| (2,647 | ) |
| Add: New operating lease liability | |
| 5,223 | | |
| 11,581 | |
| Less: Remeasurement of existing lease | |
| - | | |
| (843 | ) |
| Less: Gross repayment | |
| (5,509 | ) | |
| (3,892 | ) |
| Add: Imputed interest | |
| 176 | | |
| 278 | |
| Foreign exchange translation loss | |
| (250 | ) | |
| (565 | ) |
| Balance end of the period/year | |
$ | 6,199 | | |
$ | 6,559 | |
For
the year ended July 31, 2023, the amortization of the operating lease right of use asset was $4,837 while for year ended July 31, 2022,
the amortization of the operating lease right of use asset was $6,745.
MU
GLOBAL HOLDING LIMITED
NOTES
TO CONSOLIDATED FINANCIAL STATEMENTS
FOR
THE YEARS ENDED JULY 31, 2023 AND 2022
(Currency
expressed in United States Dollars (“US$”), except for number of shares)
Maturities
of operating lease obligation as follow:
SCHEDULE
OF MATURITIES OF OPERATING LEASE OBLIGATION
| | |
| | |
| Year ending | |
| | |
| July 31, 2024 (12 months) | |
| 5,223 | |
| October 31, 2024 (3 months) | |
| 976 | |
| Total | |
$ | 6,199 | |
Other
information:
SCHEDULE
OF OTHER INFORMATION
| | |
Year ended | | |
Year ended | |
| | |
July 31, 2023 | | |
July 31, 2022 | |
| | |
(Audited) | | |
(Audited) | |
| Cash paid for amounts included in the measurement of lease liabilities: | |
| | | |
| | |
| Operating cash flow from operating lease | |
$ | 5,395 | | |
$ | 6,185 | |
| Right-of-use assets obtained in exchange for operating lease liabilities | |
$ | 6,407 | | |
$ | 6,267 | |
| Remaining lease term for operating lease (years) | |
| 1.25 | | |
| 1.25 | |
| Weighted average discount rate for operating lease | |
| 4.35 | % | |
| 4.35 | % |
Lease
expenses were $176 and $411 during the year ended July 31, 2023 and July 31, 2022 respectively.
6.
PATENT AND TRADEMARK
SCHEDULE
OF TRADEMARK
| | |
As of | | |
As of | |
| | |
July 31, 2023 | | |
July 31, 2022 | |
| | |
(Audited) | | |
(Audited) | |
| Patent and trademark1 | |
$ | 35,988 | | |
$ | 32,404 | |
| Accumulated amortization | |
| (6,986 | ) | |
| (6,986 | ) |
| Impairment | |
| (28,976 | ) | |
| (25,392 | ) |
| Foreign currency translation adjustment | |
| (26 | ) | |
| (26 | ) |
| Trademark, net | |
$ | - | | |
$ | - | |
Amortization
expense for the year ended July 31, 2023 and July 31, 2022 was $0 and $1,561 respectively.
7.
PREPAYMENTS AND DEPOSITS
SCHEDULE
OF PREPAYMENTS AND DEPOSITS
| | |
As of | | |
As of | |
| | |
July 31, 2023 | | |
July 31, 2022 | |
| | |
(Audited) | | |
(Audited) | |
| Prepayments | |
$ | 4,017 | | |
$ | 40,382 | |
| Deposits | |
| 5,247 | | |
| 4,712 | |
| Total prepayments and deposits | |
$ | 9,264 | | |
$ | 45,094 | |
8.
AMOUNT DUE FROM RELATED PARTY
SCHEDULE OF DUE FROM RELATED PARTY
| | |
As of | | |
As of | |
| | |
July 31, 2023 | | |
July 31, 2022 | |
| | |
(Audited) | | |
(Audited) | |
| Tien Mu International Co., Ltd1 | |
$ | 2,112 | | |
$ | 11,295 | |
| Total amount due from related party | |
$ | 2,112 | | |
$ | 11,295 | |
MU
GLOBAL HOLDING LIMITED
NOTES
TO CONSOLIDATED FINANCIAL STATEMENTS
FOR
THE YEARS ENDED JULY 31, 2023 AND 2022
(Currency
expressed in United States Dollars (“US$”), except for number of shares)
9.
INVENTORIES
SCHEDULE
OF INVENTORIES
| | |
As of | | |
As of | |
| | |
July 31, 2023 | | |
July 31, 2022 | |
| | |
(Audited) | | |
(Audited) | |
| Finished goods, at cost | |
$ | 1,333 | | |
$ | 16,483 | |
| Total inventories | |
$ | 1,333 | | |
$ | 16,483 | |
10.
LOAN FROM RELATED PARTY
SCHEDULE
OF LOAN FROM RELATED PARTY
| | |
As of July 31, 2023 | | |
As of July 31, 2022 | |
| | |
(Audited) | | |
(Audited) | |
| Hong Ting Network Technology (Xiamen) Limited1 | |
| | | |
| | |
| Current | |
$ | - | | |
$ | 43,175 | |
| Total loan from related party | |
$ | - | | |
$ | 43,175 | |
11.
LOAN FROM THIRD PARTY
SCHEDULE OF LOAN FROM THIRD PARTY
| | |
As of July 31, 2023 | | |
As of July 31, 2022 | |
| | |
(Audited) | | |
(Audited) | |
| Shang Hai Shi Ba Enterprise Management Centre | |
$ | 95,988 | | |
$ | 77,064 | |
| Total loan from third party | |
$ | 95,988 | | |
$ | 77,064 | |
The
loan is unsecured, interest-free and repayable in year 2024 and year 2025. The loan is further extended to repayment in year 2026
with a loan agreement entered on August 2, 2023.
12.
LOAN FROM DIRECTOR
SCHEDULE OF LOAN FROM DIRECTOR
| | |
As of July 31, 2023 | | |
As of July 31, 2022 | |
| | |
(Audited) | | |
(Audited) | |
| Current | |
$ | 170,805 | | |
$ | 146,439 | |
| Non-current | |
| 110,985 | | |
| 122,652 | |
| Total loan from director | |
$ | 281,790 | | |
$ | 269,091 | |
Current portion
of the loan provided by director Niu Yen-Yen is unsecured, interest-free and repayable upon demand.
The
long-term loan provided by director Niu Yen-Yen is unsecured, interest-free and repayable in year 2024, for working capital purpose.
The long-term loan is further extended to repayment in year 2026 with a loan agreement entered on August 2, 2023.
13.
OTHER PAYABLES AND ACCRUED LIABILITIES
SCHEDULE OF OTHER PAYABLES AND ACCRUED LIABILITIES
| | |
As of | | |
As of | |
| | |
July 31, 2023 | | |
July 31, 2022 | |
| | |
(Audited) | | |
(Audited) | |
| Other payables | |
$ | 40,854 | | |
$ | 45,865 | |
| Accrued audit fees | |
| 15,000 | | |
| 15,000 | |
| Accrued professional fees | |
| 9,600 | | |
| 5,000 | |
| Total other payables and accrued liabilities | |
$ | 65,454 | | |
$ | 65,865 | |
MU
GLOBAL HOLDING LIMITED.
NOTES
TO CONSOLIDATED FINANCIAL STATEMENTS
FOR
THE YEARS ENDED JULY 31, 2023 AND 2022
(Currency
expressed in United States Dollars (“US$”), except for number of shares)
14.
AMOUNT DUE TO RELATED PARTY
SCHEDULE OF DUE TO RELATED PARTIES
| | |
As of July 31, 2023 | | |
As of July 31, 2022 | |
| | |
(Audited) | | |
(Audited) | |
| Hsieh, Chang-Chung1 | |
| 93,176 | | |
| 85,076 | |
| | |
$ | 93,176 | | |
$ | 85,076 | |
As
of July 31, 2023, the balance $93,176 represented an outstanding payable to related party.
The
amounts due to related party are unsecured, interest-free with no fixed repayment term and for working capital purpose.
15.
INCOME TAXES
For
the year ended July 31, 2023 and July 31, 2022, the local (United States) and foreign components of (loss)/profit before income taxes
were comprised of the following:
SCHEDULE
OF LOSS BEFORE INCOME TAX
| | |
Year ended
July 31, 2023 | | |
Year ended
July 31, 2022 | |
| | |
(Audited) | | |
(Audited) | |
| Tax jurisdictions from: | |
| | | |
| | |
| - Local | |
$ | (53,650 | ) | |
$ | (52,675 | ) |
| - Foreign, representing | |
| | | |
| | |
| Seychelles | |
| (1,600 | ) | |
| (2,101 | ) |
| Hong Kong | |
| 13,363 | | |
| (97,033 | ) |
| People’s Republic of China (“PRC”) | |
| (26,940 | ) | |
| (205,524 | ) |
| Loss before income tax | |
$ | ) | |
$ | ) |
The
provision for income taxes consisted of the following:
SCHEDULE
OF PROVISION FOR INCOME TAXES
| | |
Year ended
July 31, 2023 | | |
Year ended
July 31, 2022 | |
| | |
(Audited) | | |
(Audited) | |
| Current: | |
| | | |
| | |
| - Local | |
$ | - | | |
$ | - | |
| - Foreign | |
| - | | |
| - | |
| | |
| | | |
| | |
| Deferred: | |
| | | |
| | |
| - Local | |
| - | | |
| - | |
| - Foreign | |
| - | | |
| - | |
| | |
| | | |
| | |
| Income tax expense | |
$ | - | | |
$ | - | |
The
effective tax rate in the periods presented is the result of the mix of income earned in various tax jurisdictions that apply a broad
range of income tax rates. The Company and its subsidiary that operate in various countries: United States, Seychelles, Hong Kong, and
PRC that are subject to taxes in the jurisdictions in which they operate, as follows:
United
States of America
The
Company is registered in the State of Nevada and is subject to the tax laws of the United States of America. As of July 31, 2023, the
operations in the United States of America incurred $493,234 of cumulative net operating losses which can be carried forward indefinitely
to offset a maximum of 80% future taxable income. The Company has provided for a full valuation allowance of $394,587 against the deferred
tax assets on the expected future tax benefits from the net operating loss carryforwards as the management believes it is more likely
than not that these assets will not be realized in the future.
Seychelles
Under
the current laws of the Seychelles, MU Worldwide Group Limited is registered as an international business company and governed by the
International Business Companies Act of Seychelles. There is no income tax charged in Seychelles.
Hong
Kong
MU
Global Holding Limited is subjected to Hong Kong Profits Tax, which is charged at the statutory income tax rate of 16.5% on its assessable
income.
Shanghai
MU
Global Health Management (Shanghai) Limited operates in the PRC and is subjected to the Corporate Income Tax governed by the Income Tax
Law of the PRC with a unified statutory income tax rate of 25%.
MU
GLOBAL HOLDING LIMITED
NOTES
TO CONSOLIDATED FINANCIAL STATEMENTS
FOR
THE YEARS ENDED JULY 31, 2023 AND 2022
(Currency
expressed in United States Dollars (“US$”), except for number of shares)
16.
CONCENTRATIONS OF RISKS
(a)
Major customers
For
the year ended July 31, 2023 and 2022, the customers who accounted for 10% or more of the Company’s revenues and its accounts receivable
balance at year end are presented as follows:
SCHEDULE
OF CONCENTRATION OF RISK
| | |
2023 | | |
2022 | | |
2023 | | |
2022 | | |
2023 | | |
2022 | |
| | |
Revenues | | |
Percentage of
revenues | | |
Accounts
receivable, trade | |
| | |
(Audited) | | |
(Audited) | | |
(Audited) | |
| | |
| | |
| | |
| | |
| | |
| | |
| |
| Customer A | |
$ | - | | |
$ | 37,062 | | |
| - | % | |
| 79 | % | |
$ | - | | |
$ | - | |
| Customer B | |
| 120,938 | | |
| - | | |
| 83 | % | |
| - | % | |
| - | | |
| - | |
| Customer C | |
| 17,171 | | |
| - | | |
| 12 | % | |
| - | % | |
| - | | |
| - | |
| | |
$ | 138,109 | | |
$ | 37,062 | | |
| 95 | % | |
| 79 | % | |
$ | - | | |
$ | - | |
(b)
Major suppliers
For
the year ended July 31, 2023 and 2022, the vendors who accounted for 10% or more of the Company’s purchase and its accounts payable
balances at year end are presented as follows:
| | |
2023 | | |
2022 | | |
2023 | | |
2022 | | |
2023 | | |
2022 | |
| | |
Purchases | | |
Percentage of
purchases | | |
Accounts
payable, trade | |
| | |
(Audited) | | |
(Audited) | | |
(Audited) | |
| | |
| | |
| | |
| | |
| | |
| | |
| |
| Vendor A | |
$ | 108,844 | | |
$ | - | | |
| 100 | % | |
| - | % | |
$ | - | | |
$ | - | |
| | |
$ | 108,844 | | |
$ | - | | |
| 100 | % | |
| - | % | |
$ | - | | |
$ | - | |
(c)
Major suppliers for property, plant and equipment
For
the year ended July 31, 2023, the Company did not purchase property, plant and equipment. For the year ended July 31, 2022, the Company
purchased property, plant and equipment from Rongzi Co., which accounted for 100% the total purchases of property, plant and equipment
during the year.
(d)
Exchange rate risk
The
operation of the Company’s subsidiaries in international markets results in exposure to movements in currency exchange rates. We
have experienced foreign currency gains and losses due to the strengthening and weakening of the U.S. dollar. The potential of volatile
foreign exchange rate fluctuations in the future could have a significant effect on our results of operations. The Company has not historically
used financial instruments to hedge its foreign currency exchange rate risks.
The
currencies that create a majority of the Company’s exchange rate exposure are RMB, HK$, and TWD. The Company translates all assets
and liabilities at the rate of exchange in effect at the balance sheet date and income and expense activity at the approximate rate of
exchange at the transaction date.
17.
COMMITMENTS AND CONTINGENCIES
On
November 6, 2021, the Company entered into a contract rental agreement to rent the office in Shanghai for a period of one
year commencing on November 6, 2021 with tri-monthly payments in the amount of RMB 3,500
per month over the course of the lease and an entitlement of 1 month rent free period as relief upon rented the premise for full 11
months. The Company has an option to renew after the end of the agreement. On October 18, 2022, the Company has renewed the tenancy
agreement for 12 months with tri-monthly payments in the amount of RMB 3,500
per month over the course of the lease from November 6, 2022 to November 5, 2023 and is entitled for 1 month rent free period as
relief upon rented the premise for full 11 months. The Company has an option to renew after the end of the agreement. On August 7, 2023, the Company has further renewed the tenancy agreement for 12 months with tri-monthly payments
in the amount of RMB 3,500 per month over the course of the lease from November 6, 2023 to November 5, 2024 and is entitled for 1 month
rent free period as relief upon rented the premise for full 11 months.
As
of July 31, 2023, the Company has the aggregate minimal rent payments due in the next two years as follows:
SCHEDULE
OF AGGREGATE MINIMAL RENT PAYMENTS
| Year ending July 31 | |
| |
| | |
| |
| 2024 | |
$ | 5,223 | |
| 2025 | |
| 976 | |
| Total | |
$ | 6,199 | |
MU
GLOBAL HOLDING LIMITED
NOTES
TO CONSOLIDATED FINANCIAL STATEMENTS
FOR
THE YEARS ENDED JULY 31, 2023 AND 2022
(Currency
expressed in United States Dollars (“US$”), except for number of shares)
18.
RELATED PARTY TRANSACTIONS
For
the year ended July 31, 2023 and 2022, the Company has following transactions with related parties:
SCHEDULE
OF OUTSTANDING PAYABLE TO RELATED PARTY
| | |
Year ended
July 31, 2023 | | |
Year ended
July 31, 2022 | |
| | |
(Audited) | | |
(Audited) | |
| Professional fee paid: | |
| | | |
| | |
| - Related party A | |
$ | 16,080 | | |
$ | 16,580 | |
| | |
| | | |
| | |
| Consultation fee paid: | |
| | | |
| | |
| - Related party B | |
$ | 8,100 | | |
$ | 32,400 | |
| | |
| | | |
| | |
| Total | |
$ | 24,180 | | |
$ | 48,980 | |
Related
party A is the fellow subsidiaries of a corporate shareholder of the Company. Related party B is the shareholder of the Company.
For
the year ended July 31, 2023, the Company incurred professional fees of $16,080 due to related party A. Related party B is consultant
of the Company and has provided consultancy service for business operation.
19.
SEGMENT INFORMATION
ASC
280, “Segment Reporting” establishes standards for reporting information about operating segments on a basis consistent with
the Company’s internal organization structure as well as information about services categories, business segments and major customers
in financial statements. In accordance with the “Segment Reporting” Topic of the ASC, the Company’s chief operating
decision maker has been identified as the Chief Executive Officer and President, who reviews operating results to make decisions about
allocating resources and assessing performance for the entire Company. Existing guidance, which is based on a management approach to
segment reporting, establishes requirements to report selected segment information quarterly and to report annually entity-wide disclosures
about products and services, major customers, and the countries in which the entity holds material assets and reports revenue. All material
operating units qualify for aggregation under “Segment Reporting” due to their similar customer base and similarities in
economic characteristics; nature of products and services; and procurement, manufacturing and distribution processes.
The
Company had no inter-segment sales for the years presented. Summarized financial information concerning the Company’s reportable
segments is shown as below:
SCHEDULE
OF SEGMENT REPORTING INFORMATION
By
Geography:
| | |
Nevada | | |
Seychelles | | |
Hong Kong | | |
China | | |
Total | |
| | |
For the year ended July 31, 2023 | |
| | |
Nevada | | |
Seychelles | | |
Hong Kong | | |
China | | |
Total | |
| | |
| | |
| | |
| | |
| | |
| |
| Revenue | |
$ | - | | |
$ | - | | |
$ | 120,938 | | |
$ | 25,314 | | |
$ | 146,252 | |
| Cost of revenue | |
| - | | |
| - | | |
| (108,844 | ) | |
| (14,244 | ) | |
| (123,088 | ) |
| Other income | |
| - | | |
| - | | |
| 14,038 | | |
| 58,813 | | |
| 72,851 | |
| Selling and marketing expenses | |
| - | | |
| - | | |
| (200 | ) | |
| (1,331 | ) | |
| (1,531 | ) |
| General and administrative expenses | |
| (53,650 | ) | |
| (1,600 | ) | |
| (12,569 | ) | |
| (95,492 | ) | |
| (163,311 | ) |
| | |
| | | |
| | | |
| | | |
| | | |
| | |
| Total assets | |
$ | 3,150 | | |
$ | 1 | | |
$ | 8,254 | | |
$ | 12,136 | | |
$ | 23,541 | |
| | |
Nevada | | |
Seychelles | | |
Hong Kong | | |
China | | |
Total | |
| | |
For the year ended July 31, 2022 | |
| | |
Nevada | | |
Seychelles | | |
Hong Kong | | |
China | | |
Total | |
| | |
| | |
| | |
| | |
| | |
| |
| Revenue | |
$ | - | | |
$ | - | | |
$ | - | | |
$ | 46,702 | | |
$ | 46,702 | |
| Cost of revenue | |
| - | | |
| - | | |
| - | | |
| (21,891 | ) | |
| (21,891 | ) |
| Other income | |
| - | | |
| - | | |
| 27,781 | | |
| 22,255 | | |
| 50,036 | |
| Selling and marketing expenses | |
| - | | |
| (13 | ) | |
| (103 | ) | |
| (3,354 | ) | |
| (3,470 | ) |
| General and administrative expenses | |
| (52,675 | ) | |
| (2,088 | ) | |
| (124,711 | ) | |
| (249,236 | ) | |
| (428,710 | ) |
| | |
| | | |
| | | |
| | | |
| | | |
| | |
| Total assets | |
$ | 3,075 | | |
$ | 1 | | |
$ | 15,551 | | |
$ | 63,421 | | |
$ | 82,048 | |
20.
SUBSEQUENT EVENTS
In
accordance with ASC Topic 855, “Subsequent Events”, which establishes general standards of accounting for and disclosure
of events that occur after the balance sheet date but before financial statements are issued, the Company has evaluated all subsequent
events through the filing date of this Form 10-K with the SEC, to ensure that this filing includes appropriate disclosure of events both
recognized in the financial statements as of July 31, 2023, and events which occurred subsequently but were not recognized in the financial
statements. During the year, there was no subsequent event that required recognition or disclosure.
EXHIBIT
31.1
CERTIFICATION
I,
NIU YEN YEN, certify that:
1.
I have reviewed this annual report on Form 10-K of MU Global Holding Limited (the “Company”) for the year ended July 31,
2023;
2.
Based on my knowledge, this annual report does not contain any untrue statement of a material fact or omit to state a material fact necessary
to make the statements made, in light of the circumstances under which such statements were made, not misleading with respect to the
period covered by this report;
3.
Based on my knowledge, the financial statements, and other financial information included in this report, fairly present in all material
respects the financial condition, results of operations and cash flows of the registrant as of, and for, the periods presented in this
report;
4.
The registrant’s other certifying officer and I are responsible for establishing and maintaining disclosure controls and procedures
(as defined in Exchange Act Rules 13a-15(e) and 15d-15(e)) and internal control over financial reporting (as defined in Exchange Act
Rules 13a-15(f) and 15d-15(f)) for the registrant and have:
| |
a. |
Designed
such disclosure controls and procedures, or caused such disclosure controls and procedures to be designed under our supervision,
to ensure that material information relating to the registrant, including its consolidated subsidiaries, is made known to us by others
within those entities, particularly during the period in which this report is being prepared; |
| |
|
|
| |
b. |
Designed
such internal control over financial reporting, or caused such internal control to be designed under our supervision, to provide
reasonable assurance regarding the reliability of financial reporting and the preparation of financial statements for external purposes
in accordance with generally accepted accounting principles. |
| |
|
|
| |
c. |
Evaluated
the effectiveness of the registrant’s disclosure controls and procedures and presented in this report our conclusions about
the effectiveness of the disclosure controls and procedures, as of the end of the period covered by this report based on such evaluation;
and |
| |
|
|
| |
d. |
Disclosed
in this report any change in the registrant’s internal control over financial reporting that occurred during the registrant’s
most recent fiscal quarter (the registrant’s fourth fiscal quarter in the case of an annual report) that has materially affected,
or is reasonably likely to materially affect, the registrant’s internal control over financial reporting; and |
5.
The registrant’s other certifying officer and I have disclosed, based on our most recent evaluation of internal control over financial
reporting, to the registrant’s auditors and the audit committee of the registrant’s board of directors (or persons performing
the equivalent functions):
| |
a. |
All
significant deficiencies and material weaknesses in the design or operation of internal control over financial reporting which are
reasonably likely to adversely affect the registrant’s ability to record, process, summarize and report financial information;
and |
| |
|
|
| |
b. |
Any
fraud, whether or not material, that involves management or other employees who have a significant role in the registrant’s
internal control over financial reporting. |
| Date:
October 30, 2023 |
By: |
/s/
NIU YEN YEN |
| |
|
NIU
YEN YEN |
| |
|
Chief
Executive Officer, Chief Financial Officer,
President, Director, Secretary, Treasurer |
| |
|
(Principal
Executive Officer, Principal Financial Officer, Principal Accounting Officer) |
EXHIBIT
32.1
CERTIFICATION
PURSUANT TO
18 U.S.C. SECTION 1350,
AS
ADOPTED PURSUANT TO
SECTION
906 OF THE SARBANES-OXLEY ACT OF 2002
In
connection with the Annual Report of MU Global Holding Limited (the “Company”) on Form 10-K for the year ended July 31, 2023
as filed with the Securities and Exchange Commission on the date hereof (the “Report”), the undersigned hereby certifies,
pursuant to 18 U.S.C. § 1350, as adopted pursuant to § 906 of the Sarbanes-Oxley Act of 2002, that, to the best of my knowledge
and belief:
(1)
The Report fully complies with the requirements of section 13(a) or 15(d) of the Securities Exchange Act of 1934; and
(2)
The information contained in the Report fairly presents, in all material respects, the financial condition and result of operations of
the Company.
| Date:
October 30, 2023 |
By: |
/s/
NIU YEN YEN |
| |
|
NIU
YEN YEN |
| |
|
Chief
Executive Officer, Chief Financial Officer,
President, Director, Secretary, Treasurer |
| |
|
(Principal
Executive Officer, Principal Financial Officer, Principal Accounting Officer) |
A
signed original of this written statement required by Section 906, or other document authenticating, acknowledging, or otherwise adopting
the signature that appears in typed form within the electronic version of this written statement has been provided to the Company and
will be retained by the Company and will be retained by the Company and furnished to the Securities and Exchange Commission or its staff
upon request.
v3.23.3
Cover - USD ($)
|
12 Months Ended |
|
Jul. 31, 2023 |
Jan. 31, 2023 |
| Cover [Abstract] |
|
|
| Document Type |
10-K
|
|
| Amendment Flag |
false
|
|
| Document Annual Report |
true
|
|
| Document Transition Report |
false
|
|
| Document Period End Date |
Jul. 31, 2023
|
|
| Document Fiscal Period Focus |
FY
|
|
| Document Fiscal Year Focus |
2023
|
|
| Current Fiscal Year End Date |
--07-31
|
|
| Entity File Number |
333-228847
|
|
| Entity Registrant Name |
MU
Global Holding Limited
|
|
| Entity Central Index Key |
0001746119
|
|
| Entity Tax Identification Number |
30-1089215
|
|
| Entity Incorporation, State or Country Code |
NV
|
|
| Entity Address, Address Line One |
Rm.
5, 7F., No. 296, Sec. 4
|
|
| Entity Address, Address Line Two |
Xinyi Rd.,
|
|
| Entity Address, Address Line Three |
Da’an Dist.,
|
|
| Entity Address, City or Town |
Taipei
City
|
|
| Entity Address, Country |
TW
|
|
| Entity Address, Postal Zip Code |
106427
|
|
| City Area Code |
+886
|
|
| Local Phone Number |
905153139
|
|
| Title of 12(b) Security |
Common
Stock
|
|
| Trading Symbol |
MUGH
|
|
| Entity Well-known Seasoned Issuer |
No
|
|
| Entity Voluntary Filers |
No
|
|
| Entity Current Reporting Status |
Yes
|
|
| Entity Interactive Data Current |
No
|
|
| Entity Filer Category |
Non-accelerated Filer
|
|
| Entity Small Business |
true
|
|
| Entity Emerging Growth Company |
true
|
|
| Elected Not To Use the Extended Transition Period |
false
|
|
| Entity Shell Company |
false
|
|
| Entity Public Float |
|
$ 0
|
| Entity Common Stock, Shares Outstanding |
59,434,838
|
|
| Document Financial Statement Error Correction [Flag] |
false
|
|
| Auditor Name |
JP CENTURION & PARTNERS PLT
|
|
| Auditor Firm ID |
6723
|
|
| Auditor Location |
Kuala
Lumpur, Malaysia
|
|
| X |
- DefinitionBoolean flag that is true when the XBRL content amends previously-filed or accepted submission.
| Name: |
dei_AmendmentFlag |
| Namespace Prefix: |
dei_ |
| Data Type: |
xbrli:booleanItemType |
| Balance Type: |
na |
| Period Type: |
duration |
|
| X |
- DefinitionPCAOB issued Audit Firm Identifier Reference 1: http://www.xbrl.org/2003/role/presentationRef
-Publisher SEC
-Name Form 10-K
-Number 249
-Section 310
Reference 2: http://www.xbrl.org/2003/role/presentationRef
-Publisher SEC
-Name Form 20-F
-Number 249
-Section 220
-Subsection f
Reference 3: http://www.xbrl.org/2003/role/presentationRef
-Publisher SEC
-Name Form 40-F
-Number 249
-Section 240
-Subsection f
| Name: |
dei_AuditorFirmId |
| Namespace Prefix: |
dei_ |
| Data Type: |
dei:nonemptySequenceNumberItemType |
| Balance Type: |
na |
| Period Type: |
duration |
|
| X |
- ReferencesReference 1: http://www.xbrl.org/2003/role/presentationRef
-Publisher SEC
-Name Form 10-K
-Number 249
-Section 310
Reference 2: http://www.xbrl.org/2003/role/presentationRef
-Publisher SEC
-Name Form 20-F
-Number 249
-Section 220
-Subsection f
Reference 3: http://www.xbrl.org/2003/role/presentationRef
-Publisher SEC
-Name Form 40-F
-Number 249
-Section 240
-Subsection f
| Name: |
dei_AuditorLocation |
| Namespace Prefix: |
dei_ |
| Data Type: |
dei:internationalNameItemType |
| Balance Type: |
na |
| Period Type: |
duration |
|
| X |
- ReferencesReference 1: http://www.xbrl.org/2003/role/presentationRef
-Publisher SEC
-Name Form 10-K
-Number 249
-Section 310
Reference 2: http://www.xbrl.org/2003/role/presentationRef
-Publisher SEC
-Name Form 20-F
-Number 249
-Section 220
-Subsection f
Reference 3: http://www.xbrl.org/2003/role/presentationRef
-Publisher SEC
-Name Form 40-F
-Number 249
-Section 240
-Subsection f
| Name: |
dei_AuditorName |
| Namespace Prefix: |
dei_ |
| Data Type: |
dei:internationalNameItemType |
| Balance Type: |
na |
| Period Type: |
duration |
|
| X |
- DefinitionEnd date of current fiscal year in the format --MM-DD.
| Name: |
dei_CurrentFiscalYearEndDate |
| Namespace Prefix: |
dei_ |
| Data Type: |
xbrli:gMonthDayItemType |
| Balance Type: |
na |
| Period Type: |
duration |
|
| X |
- DefinitionBoolean flag that is true only for a form used as an annual report. Reference 1: http://www.xbrl.org/2003/role/presentationRef
-Publisher SEC
-Name Form 10-K
-Number 249
-Section 310
Reference 2: http://www.xbrl.org/2003/role/presentationRef
-Publisher SEC
-Name Form 20-F
-Number 249
-Section 220
-Subsection f
Reference 3: http://www.xbrl.org/2003/role/presentationRef
-Publisher SEC
-Name Form 40-F
-Number 249
-Section 240
-Subsection f
| Name: |
dei_DocumentAnnualReport |
| Namespace Prefix: |
dei_ |
| Data Type: |
xbrli:booleanItemType |
| Balance Type: |
na |
| Period Type: |
duration |
|
| X |
- DefinitionIndicates whether any of the financial statement period in the filing include a restatement due to error correction. Reference 1: http://www.xbrl.org/2003/role/presentationRef
-Publisher SEC
-Name Regulation S-K
-Number 229
-Section 402
-Subsection w
Reference 2: http://www.xbrl.org/2003/role/presentationRef
-Publisher SEC
-Name Form 10-K
-Number 249
-Section 310
Reference 3: http://www.xbrl.org/2003/role/presentationRef
-Publisher SEC
-Name Form 20-F
-Number 249
-Section 220
-Subsection f
Reference 4: http://www.xbrl.org/2003/role/presentationRef
-Publisher SEC
-Name Form 40-F
-Number 249
-Section 240
-Subsection f
| Name: |
dei_DocumentFinStmtErrorCorrectionFlag |
| Namespace Prefix: |
dei_ |
| Data Type: |
xbrli:booleanItemType |
| Balance Type: |
na |
| Period Type: |
duration |
|
| X |
- DefinitionFiscal period values are FY, Q1, Q2, and Q3. 1st, 2nd and 3rd quarter 10-Q or 10-QT statements have value Q1, Q2, and Q3 respectively, with 10-K, 10-KT or other fiscal year statements having FY.
| Name: |
dei_DocumentFiscalPeriodFocus |
| Namespace Prefix: |
dei_ |
| Data Type: |
dei:fiscalPeriodItemType |
| Balance Type: |
na |
| Period Type: |
duration |
|
| X |
- DefinitionThis is focus fiscal year of the document report in YYYY format. For a 2006 annual report, which may also provide financial information from prior periods, fiscal 2006 should be given as the fiscal year focus. Example: 2006.
| Name: |
dei_DocumentFiscalYearFocus |
| Namespace Prefix: |
dei_ |
| Data Type: |
xbrli:gYearItemType |
| Balance Type: |
na |
| Period Type: |
duration |
|
| X |
- DefinitionFor the EDGAR submission types of Form 8-K: the date of the report, the date of the earliest event reported; for the EDGAR submission types of Form N-1A: the filing date; for all other submission types: the end of the reporting or transition period. The format of the date is YYYY-MM-DD.
| Name: |
dei_DocumentPeriodEndDate |
| Namespace Prefix: |
dei_ |
| Data Type: |
xbrli:dateItemType |
| Balance Type: |
na |
| Period Type: |
duration |
|
| X |
- DefinitionBoolean flag that is true only for a form used as a transition report. Reference 1: http://www.xbrl.org/2003/role/presentationRef
-Publisher SEC
-Name Forms 10-K, 10-Q, 20-F
-Number 240
-Section 13
-Subsection a-1
| Name: |
dei_DocumentTransitionReport |
| Namespace Prefix: |
dei_ |
| Data Type: |
xbrli:booleanItemType |
| Balance Type: |
na |
| Period Type: |
duration |
|
| X |
- DefinitionThe type of document being provided (such as 10-K, 10-Q, 485BPOS, etc). The document type is limited to the same value as the supporting SEC submission type, or the word 'Other'.
| Name: |
dei_DocumentType |
| Namespace Prefix: |
dei_ |
| Data Type: |
dei:submissionTypeItemType |
| Balance Type: |
na |
| Period Type: |
duration |
|
| X |
- DefinitionAddress Line 1 such as Attn, Building Name, Street Name
| Name: |
dei_EntityAddressAddressLine1 |
| Namespace Prefix: |
dei_ |
| Data Type: |
xbrli:normalizedStringItemType |
| Balance Type: |
na |
| Period Type: |
duration |
|
| X |
- DefinitionAddress Line 2 such as Street or Suite number
| Name: |
dei_EntityAddressAddressLine2 |
| Namespace Prefix: |
dei_ |
| Data Type: |
xbrli:normalizedStringItemType |
| Balance Type: |
na |
| Period Type: |
duration |
|
| X |
- DefinitionAddress Line 3 such as an Office Park
| Name: |
dei_EntityAddressAddressLine3 |
| Namespace Prefix: |
dei_ |
| Data Type: |
xbrli:normalizedStringItemType |
| Balance Type: |
na |
| Period Type: |
duration |
|
| X |
- Definition
+ References
+ Details
| Name: |
dei_EntityAddressCityOrTown |
| Namespace Prefix: |
dei_ |
| Data Type: |
xbrli:normalizedStringItemType |
| Balance Type: |
na |
| Period Type: |
duration |
|
| X |
- DefinitionISO 3166-1 alpha-2 country code.
| Name: |
dei_EntityAddressCountry |
| Namespace Prefix: |
dei_ |
| Data Type: |
dei:countryCodeItemType |
| Balance Type: |
na |
| Period Type: |
duration |
|
| X |
- DefinitionCode for the postal or zip code
| Name: |
dei_EntityAddressPostalZipCode |
| Namespace Prefix: |
dei_ |
| Data Type: |
xbrli:normalizedStringItemType |
| Balance Type: |
na |
| Period Type: |
duration |
|
| X |
- DefinitionA unique 10-digit SEC-issued value to identify entities that have filed disclosures with the SEC. It is commonly abbreviated as CIK. Reference 1: http://www.xbrl.org/2003/role/presentationRef
-Publisher SEC
-Name Exchange Act
-Number 240
-Section 12
-Subsection b-2
| Name: |
dei_EntityCentralIndexKey |
| Namespace Prefix: |
dei_ |
| Data Type: |
dei:centralIndexKeyItemType |
| Balance Type: |
na |
| Period Type: |
duration |
|
| X |
- DefinitionIndicate number of shares or other units outstanding of each of registrant's classes of capital or common stock or other ownership interests, if and as stated on cover of related periodic report. Where multiple classes or units exist define each class/interest by adding class of stock items such as Common Class A [Member], Common Class B [Member] or Partnership Interest [Member] onto the Instrument [Domain] of the Entity Listings, Instrument.
| Name: |
dei_EntityCommonStockSharesOutstanding |
| Namespace Prefix: |
dei_ |
| Data Type: |
xbrli:sharesItemType |
| Balance Type: |
na |
| Period Type: |
instant |
|
| X |
- DefinitionIndicate 'Yes' or 'No' whether registrants (1) have filed all reports required to be filed by Section 13 or 15(d) of the Securities Exchange Act of 1934 during the preceding 12 months (or for such shorter period that registrants were required to file such reports), and (2) have been subject to such filing requirements for the past 90 days. This information should be based on the registrant's current or most recent filing containing the related disclosure.
| Name: |
dei_EntityCurrentReportingStatus |
| Namespace Prefix: |
dei_ |
| Data Type: |
dei:yesNoItemType |
| Balance Type: |
na |
| Period Type: |
duration |
|
| X |
- DefinitionIndicate if registrant meets the emerging growth company criteria. Reference 1: http://www.xbrl.org/2003/role/presentationRef
-Publisher SEC
-Name Exchange Act
-Number 240
-Section 12
-Subsection b-2
| Name: |
dei_EntityEmergingGrowthCompany |
| Namespace Prefix: |
dei_ |
| Data Type: |
xbrli:booleanItemType |
| Balance Type: |
na |
| Period Type: |
duration |
|
| X |
- DefinitionCommission file number. The field allows up to 17 characters. The prefix may contain 1-3 digits, the sequence number may contain 1-8 digits, the optional suffix may contain 1-4 characters, and the fields are separated with a hyphen.
| Name: |
dei_EntityFileNumber |
| Namespace Prefix: |
dei_ |
| Data Type: |
dei:fileNumberItemType |
| Balance Type: |
na |
| Period Type: |
duration |
|
| X |
- DefinitionIndicate whether the registrant is one of the following: Large Accelerated Filer, Accelerated Filer, Non-accelerated Filer. Definitions of these categories are stated in Rule 12b-2 of the Exchange Act. This information should be based on the registrant's current or most recent filing containing the related disclosure. Reference 1: http://www.xbrl.org/2003/role/presentationRef
-Publisher SEC
-Name Exchange Act
-Number 240
-Section 12
-Subsection b-2
| Name: |
dei_EntityFilerCategory |
| Namespace Prefix: |
dei_ |
| Data Type: |
dei:filerCategoryItemType |
| Balance Type: |
na |
| Period Type: |
duration |
|
| X |
- DefinitionTwo-character EDGAR code representing the state or country of incorporation.
| Name: |
dei_EntityIncorporationStateCountryCode |
| Namespace Prefix: |
dei_ |
| Data Type: |
dei:edgarStateCountryItemType |
| Balance Type: |
na |
| Period Type: |
duration |
|
| X |
- DefinitionBoolean flag that is true when the registrant has submitted electronically every Interactive Data File required to be submitted pursuant to Rule 405 of Regulation S-T during the preceding 12 months (or for such shorter period that the registrant was required to submit such files). Reference 1: http://www.xbrl.org/2003/role/presentationRef
-Publisher SEC
-Name Regulation S-T
-Number 232
-Section 405
| Name: |
dei_EntityInteractiveDataCurrent |
| Namespace Prefix: |
dei_ |
| Data Type: |
dei:yesNoItemType |
| Balance Type: |
na |
| Period Type: |
duration |
|
| X |
- DefinitionThe aggregate market value of the voting and non-voting common equity held by non-affiliates computed by reference to the price at which the common equity was last sold, or the average bid and asked price of such common equity, as of the last business day of the registrant's most recently completed second fiscal quarter.
| Name: |
dei_EntityPublicFloat |
| Namespace Prefix: |
dei_ |
| Data Type: |
xbrli:monetaryItemType |
| Balance Type: |
credit |
| Period Type: |
instant |
|
| X |
- DefinitionThe exact name of the entity filing the report as specified in its charter, which is required by forms filed with the SEC. Reference 1: http://www.xbrl.org/2003/role/presentationRef
-Publisher SEC
-Name Exchange Act
-Number 240
-Section 12
-Subsection b-2
| Name: |
dei_EntityRegistrantName |
| Namespace Prefix: |
dei_ |
| Data Type: |
xbrli:normalizedStringItemType |
| Balance Type: |
na |
| Period Type: |
duration |
|
| X |
- DefinitionBoolean flag that is true when the registrant is a shell company as defined in Rule 12b-2 of the Exchange Act. Reference 1: http://www.xbrl.org/2003/role/presentationRef
-Publisher SEC
-Name Exchange Act
-Number 240
-Section 12
-Subsection b-2
| Name: |
dei_EntityShellCompany |
| Namespace Prefix: |
dei_ |
| Data Type: |
xbrli:booleanItemType |
| Balance Type: |
na |
| Period Type: |
duration |
|
| X |
- DefinitionIndicates that the company is a Smaller Reporting Company (SRC). Reference 1: http://www.xbrl.org/2003/role/presentationRef
-Publisher SEC
-Name Exchange Act
-Number 240
-Section 12
-Subsection b-2
| Name: |
dei_EntitySmallBusiness |
| Namespace Prefix: |
dei_ |
| Data Type: |
xbrli:booleanItemType |
| Balance Type: |
na |
| Period Type: |
duration |
|
| X |
- DefinitionThe Tax Identification Number (TIN), also known as an Employer Identification Number (EIN), is a unique 9-digit value assigned by the IRS. Reference 1: http://www.xbrl.org/2003/role/presentationRef
-Publisher SEC
-Name Exchange Act
-Number 240
-Section 12
-Subsection b-2
| Name: |
dei_EntityTaxIdentificationNumber |
| Namespace Prefix: |
dei_ |
| Data Type: |
dei:employerIdItemType |
| Balance Type: |
na |
| Period Type: |
duration |
|
| X |
- DefinitionIndicate 'Yes' or 'No' if the registrant is not required to file reports pursuant to Section 13 or Section 15(d) of the Act.
| Name: |
dei_EntityVoluntaryFilers |
| Namespace Prefix: |
dei_ |
| Data Type: |
dei:yesNoItemType |
| Balance Type: |
na |
| Period Type: |
duration |
|
| X |
- DefinitionIndicate 'Yes' or 'No' if the registrant is a well-known seasoned issuer, as defined in Rule 405 of the Securities Act. Is used on Form Type: 10-K, 10-Q, 8-K, 20-F, 6-K, 10-K/A, 10-Q/A, 20-F/A, 6-K/A, N-CSR, N-Q, N-1A. Reference 1: http://www.xbrl.org/2003/role/presentationRef
-Publisher SEC
-Name Securities Act
-Number 230
-Section 405
| Name: |
dei_EntityWellKnownSeasonedIssuer |
| Namespace Prefix: |
dei_ |
| Data Type: |
dei:yesNoItemType |
| Balance Type: |
na |
| Period Type: |
duration |
|
| X |
- DefinitionLocal phone number for entity.
| Name: |
dei_LocalPhoneNumber |
| Namespace Prefix: |
dei_ |
| Data Type: |
xbrli:normalizedStringItemType |
| Balance Type: |
na |
| Period Type: |
duration |
|
| X |
- DefinitionTitle of a 12(b) registered security. Reference 1: http://www.xbrl.org/2003/role/presentationRef
-Publisher SEC
-Name Exchange Act
-Number 240
-Section 12
-Subsection b
| Name: |
dei_Security12bTitle |
| Namespace Prefix: |
dei_ |
| Data Type: |
dei:securityTitleItemType |
| Balance Type: |
na |
| Period Type: |
duration |
|
| X |
- DefinitionTrading symbol of an instrument as listed on an exchange.
| Name: |
dei_TradingSymbol |
| Namespace Prefix: |
dei_ |
| Data Type: |
dei:tradingSymbolItemType |
| Balance Type: |
na |
| Period Type: |
duration |
|
v3.23.3
Consolidated Balance Sheets - USD ($)
|
Jul. 31, 2023 |
Jul. 31, 2022 |
| NON-CURRENT ASSETS |
|
|
| Property, plant and equipment |
|
|
| Leased asset – Right of use |
6,407
|
6,267
|
| Total non-current assets, excluding intangible assets |
6,407
|
6,267
|
| INTANGIBLE ASSET |
|
|
| Patent and trademark |
|
|
| Total non-current assets |
6,407
|
6,267
|
| CURRENT ASSETS |
|
|
| Prepayments and deposits |
9,264
|
45,094
|
| Inventories |
1,333
|
16,483
|
| Cash and cash equivalents |
4,425
|
2,909
|
| Total current assets |
17,134
|
75,781
|
| TOTAL ASSETS |
23,541
|
82,048
|
| NON-CURRENT LIABILITIES |
|
|
| Leased liabilities |
976
|
517
|
| Loan from director |
110,985
|
122,652
|
| Loan from third party |
95,988
|
77,064
|
| Total non-current liabilities |
207,949
|
200,233
|
| CURRENT LIABILITIES |
|
|
| Other payables and accrued liabilities |
65,454
|
65,865
|
| Deposit from franchisees |
27,774
|
29,286
|
| Deposit from customers |
37,135
|
39,296
|
| Loan from director |
170,805
|
146,439
|
| Loan from related party |
|
43,175
|
| Leased liabilities |
5,223
|
6,042
|
| Total current liabilities |
399,567
|
415,179
|
| TOTAL LIABILITIES |
607,516
|
615,412
|
| STOCKHOLDERS’ EQUITY |
|
|
| Preferred stock, $0.0001 par value, 200,000,000 shares authorized, None issued and outstanding |
|
|
| Common stock, $0.0001 par value, 600,000,000 shares authorized, 59,434,838 shares issued and outstanding as of July 31, 2023 and July 31, 2022 respectively |
5,943
|
5,943
|
| Additional paid-in capital |
1,831,111
|
1,830,300
|
| Foreign currency adjustment |
36,979
|
19,574
|
| Accumulated deficit |
(2,458,008)
|
(2,389,181)
|
| Total stockholders’ equity |
(583,975)
|
(533,364)
|
| TOTAL LIABILITIES AND STOCKHOLDERS’ EQUITY |
23,541
|
82,048
|
| Related Party [Member] |
|
|
| CURRENT ASSETS |
|
|
| Amount due from related party |
2,112
|
11,295
|
| CURRENT LIABILITIES |
|
|
| Amount due to related party |
93,176
|
85,076
|
| ThirdParty [Member] |
|
|
| NON-CURRENT LIABILITIES |
|
|
| Loan from third party |
$ 95,988
|
$ 77,064
|
| X |
- DefinitionDeposit from customers current.
| Name: |
MUGH_DepositFromCustomersCurrent |
| Namespace Prefix: |
MUGH_ |
| Data Type: |
xbrli:monetaryItemType |
| Balance Type: |
credit |
| Period Type: |
instant |
|
| X |
- DefinitionDue to loan from director non current.
| Name: |
MUGH_DueToLoanFromDirectorNoncurrent |
| Namespace Prefix: |
MUGH_ |
| Data Type: |
xbrli:monetaryItemType |
| Balance Type: |
credit |
| Period Type: |
instant |
|
| X |
- DefinitionForeign currency adjustment.
| Name: |
MUGH_ForeignCurrencyAdjustment |
| Namespace Prefix: |
MUGH_ |
| Data Type: |
xbrli:monetaryItemType |
| Balance Type: |
credit |
| Period Type: |
instant |
|
| X |
- DefinitionLoan from director current.
| Name: |
MUGH_LoanFromDirectorCurrent |
| Namespace Prefix: |
MUGH_ |
| Data Type: |
xbrli:monetaryItemType |
| Balance Type: |
credit |
| Period Type: |
instant |
|
| X |
- DefinitionTotal non current assets, excluding intangible assets.
| Name: |
MUGH_NoncurrentAssetsExcludingIntangibleAssets |
| Namespace Prefix: |
MUGH_ |
| Data Type: |
xbrli:monetaryItemType |
| Balance Type: |
debit |
| Period Type: |
instant |
|
| X |
- DefinitionAmount of obligations incurred classified as other, payable within one year or the normal operating cycle, if longer. Reference 1: http://fasb.org/us-gaap/role/ref/legacyRef
-Name Accounting Standards Codification
-Topic 210
-SubTopic 10
-Section S99
-Paragraph 1
-Subparagraph (SX 210.5-02.19(a))
-Publisher FASB
-URI https://asc.fasb.org//1943274/2147480566/210-10-S99-1
| Name: |
us-gaap_AccountsPayableOtherCurrent |
| Namespace Prefix: |
us-gaap_ |
| Data Type: |
xbrli:monetaryItemType |
| Balance Type: |
credit |
| Period Type: |
instant |
|
| X |
- DefinitionAmount of excess of issue price over par or stated value of stock and from other transaction involving stock or stockholder. Includes, but is not limited to, additional paid-in capital (APIC) for common and preferred stock. Reference 1: http://www.xbrl.org/2003/role/exampleRef
-Topic 852
-SubTopic 10
-Name Accounting Standards Codification
-Section 55
-Paragraph 10
-Publisher FASB
-URI https://asc.fasb.org//1943274/2147481372/852-10-55-10
Reference 2: http://www.xbrl.org/2009/role/commonPracticeRef
-Topic 946
-SubTopic 210
-Name Accounting Standards Codification
-Section S99
-Paragraph 1
-Subparagraph (SX 210.6-04(18))
-Publisher FASB
-URI https://asc.fasb.org//1943274/2147479617/946-210-S99-1
Reference 3: http://fasb.org/us-gaap/role/ref/legacyRef
-Topic 210
-SubTopic 10
-Name Accounting Standards Codification
-Section S99
-Paragraph 1
-Subparagraph (SX 210.5-02(30)(a)(1))
-Publisher FASB
-URI https://asc.fasb.org//1943274/2147480566/210-10-S99-1
| Name: |
us-gaap_AdditionalPaidInCapital |
| Namespace Prefix: |
us-gaap_ |
| Data Type: |
xbrli:monetaryItemType |
| Balance Type: |
credit |
| Period Type: |
instant |
|
| X |
- DefinitionSum of the carrying amounts as of the balance sheet date of all assets that are recognized. Assets are probable future economic benefits obtained or controlled by an entity as a result of past transactions or events. Reference 1: http://www.xbrl.org/2003/role/disclosureRef
-Topic 810
-SubTopic 10
-Name Accounting Standards Codification
-Section 50
-Paragraph 3
-Subparagraph (bb)
-Publisher FASB
-URI https://asc.fasb.org//1943274/2147481203/810-10-50-3
Reference 2: http://www.xbrl.org/2003/role/disclosureRef
-Topic 810
-SubTopic 10
-Name Accounting Standards Codification
-Section 45
-Paragraph 25
-Subparagraph (a)
-Publisher FASB
-URI https://asc.fasb.org//1943274/2147481231/810-10-45-25
Reference 3: http://www.xbrl.org/2003/role/disclosureRef
-Topic 235
-SubTopic 10
-Name Accounting Standards Codification
-Section S99
-Paragraph 1
-Subparagraph (SX 210.4-08(g)(1)(ii))
-Publisher FASB
-URI https://asc.fasb.org//1943274/2147480678/235-10-S99-1
Reference 4: http://www.xbrl.org/2003/role/disclosureRef
-Topic 323
-SubTopic 10
-Name Accounting Standards Codification
-Section 50
-Paragraph 3
-Subparagraph (c)
-Publisher FASB
-URI https://asc.fasb.org//1943274/2147481687/323-10-50-3
Reference 5: http://www.xbrl.org/2003/role/disclosureRef
-Topic 825
-SubTopic 10
-Name Accounting Standards Codification
-Section 50
-Paragraph 28
-Subparagraph (f)
-Publisher FASB
-URI https://asc.fasb.org//1943274/2147482907/825-10-50-28
Reference 6: http://www.xbrl.org/2003/role/exampleRef
-Topic 852
-SubTopic 10
-Name Accounting Standards Codification
-Section 55
-Paragraph 10
-Publisher FASB
-URI https://asc.fasb.org//1943274/2147481372/852-10-55-10
Reference 7: http://www.xbrl.org/2003/role/exampleRef
-Topic 946
-SubTopic 830
-Name Accounting Standards Codification
-Section 55
-Paragraph 12
-Publisher FASB
-URI https://asc.fasb.org//1943274/2147480167/946-830-55-12
Reference 8: http://www.xbrl.org/2003/role/disclosureRef
-Topic 944
-SubTopic 210
-Name Accounting Standards Codification
-Section S99
-Paragraph 1
-Subparagraph (SX 210.7-03(a)(12))
-Publisher FASB
-URI https://asc.fasb.org//1943274/2147479440/944-210-S99-1
Reference 9: http://www.xbrl.org/2003/role/disclosureRef
-Topic 280
-SubTopic 10
-Name Accounting Standards Codification
-Section 50
-Paragraph 22
-Publisher FASB
-URI https://asc.fasb.org//1943274/2147482810/280-10-50-22
Reference 10: http://www.xbrl.org/2003/role/disclosureRef
-Topic 946
-SubTopic 210
-Name Accounting Standards Codification
-Section S99
-Paragraph 1
-Subparagraph (SX 210.6-04(8))
-Publisher FASB
-URI https://asc.fasb.org//1943274/2147479617/946-210-S99-1
Reference 11: http://www.xbrl.org/2003/role/disclosureRef
-Topic 210
-SubTopic 10
-Name Accounting Standards Codification
-Section S99
-Paragraph 1
-Subparagraph (SX 210.5-02(18))
-Publisher FASB
-URI https://asc.fasb.org//1943274/2147480566/210-10-S99-1
Reference 12: http://www.xbrl.org/2003/role/disclosureRef
-Topic 470
-SubTopic 10
-Name Accounting Standards Codification
-Section S99
-Paragraph 1A
-Subparagraph (SX 210.13-01(a)(4)(i))
-Publisher FASB
-URI https://asc.fasb.org//1943274/2147480097/470-10-S99-1A
Reference 13: http://www.xbrl.org/2009/role/commonPracticeRef
-Topic 470
-SubTopic 10
-Name Accounting Standards Codification
-Section S99
-Paragraph 1A
-Subparagraph (SX 210.13-01(a)(4)(ii))
-Publisher FASB
-URI https://asc.fasb.org//1943274/2147480097/470-10-S99-1A
Reference 14: http://www.xbrl.org/2009/role/commonPracticeRef
-Topic 470
-SubTopic 10
-Name Accounting Standards Codification
-Section S99
-Paragraph 1A
-Subparagraph (SX 210.13-01(a)(4)(iii))
-Publisher FASB
-URI https://asc.fasb.org//1943274/2147480097/470-10-S99-1A
Reference 15: http://www.xbrl.org/2003/role/disclosureRef
-Topic 470
-SubTopic 10
-Name Accounting Standards Codification
-Section S99
-Paragraph 1A
-Subparagraph (SX 210.13-01(a)(4)(iii)(A))
-Publisher FASB
-URI https://asc.fasb.org//1943274/2147480097/470-10-S99-1A
Reference 16: http://www.xbrl.org/2003/role/disclosureRef
-Topic 470
-SubTopic 10
-Name Accounting Standards Codification
-Section S99
-Paragraph 1A
-Subparagraph (SX 210.13-01(a)(4)(iv))
-Publisher FASB
-URI https://asc.fasb.org//1943274/2147480097/470-10-S99-1A
Reference 17: http://www.xbrl.org/2003/role/disclosureRef
-Topic 470
-SubTopic 10
-Name Accounting Standards Codification
-Section S99
-Paragraph 1A
-Subparagraph (SX 210.13-01(a)(5))
-Publisher FASB
-URI https://asc.fasb.org//1943274/2147480097/470-10-S99-1A
Reference 18: http://www.xbrl.org/2003/role/disclosureRef
-Topic 470
-SubTopic 10
-Name Accounting Standards Codification
-Section S99
-Paragraph 1B
-Subparagraph (SX 210.13-02(a)(4)(i))
-Publisher FASB
-URI https://asc.fasb.org//1943274/2147480097/470-10-S99-1B
Reference 19: http://www.xbrl.org/2003/role/disclosureRef
-Topic 470
-SubTopic 10
-Name Accounting Standards Codification
-Section S99
-Paragraph 1B
-Subparagraph (SX 210.13-02(a)(4)(iii)(A))
-Publisher FASB
-URI https://asc.fasb.org//1943274/2147480097/470-10-S99-1B
Reference 20: http://www.xbrl.org/2003/role/disclosureRef
-Topic 470
-SubTopic 10
-Name Accounting Standards Codification
-Section S99
-Paragraph 1B
-Subparagraph (SX 210.13-02(a)(4)(iii)(B))
-Publisher FASB
-URI https://asc.fasb.org//1943274/2147480097/470-10-S99-1B
Reference 21: http://www.xbrl.org/2003/role/disclosureRef
-Topic 470
-SubTopic 10
-Name Accounting Standards Codification
-Section S99
-Paragraph 1B
-Subparagraph (SX 210.13-02(a)(4)(iv))
-Publisher FASB
-URI https://asc.fasb.org//1943274/2147480097/470-10-S99-1B
Reference 22: http://www.xbrl.org/2003/role/disclosureRef
-Topic 470
-SubTopic 10
-Name Accounting Standards Codification
-Section S99
-Paragraph 1B
-Subparagraph (SX 210.13-02(a)(5))
-Publisher FASB
-URI https://asc.fasb.org//1943274/2147480097/470-10-S99-1B
Reference 23: http://www.xbrl.org/2009/role/commonPracticeRef
-Topic 852
-SubTopic 10
-Name Accounting Standards Codification
-Section 50
-Paragraph 7
-Subparagraph (a)
-Publisher FASB
-URI https://asc.fasb.org//1943274/2147481404/852-10-50-7
Reference 24: http://www.xbrl.org/2003/role/disclosureRef
-Topic 280
-SubTopic 10
-Name Accounting Standards Codification
-Section 50
-Paragraph 30
-Subparagraph (c)
-Publisher FASB
-URI https://asc.fasb.org//1943274/2147482810/280-10-50-30
Reference 25: http://www.xbrl.org/2003/role/disclosureRef
-Topic 280
-SubTopic 10
-Name Accounting Standards Codification
-Section 50
-Paragraph 32
-Subparagraph (d)
-Publisher FASB
-URI https://asc.fasb.org//1943274/2147482810/280-10-50-32
Reference 26: http://fasb.org/us-gaap/role/ref/legacyRef
-Topic 942
-SubTopic 210
-Name Accounting Standards Codification
-Section S99
-Paragraph 1
-Subparagraph (SX 210.9-03(11))
-Publisher FASB
-URI https://asc.fasb.org//1943274/2147479853/942-210-S99-1
| Name: |
us-gaap_Assets |
| Namespace Prefix: |
us-gaap_ |
| Data Type: |
xbrli:monetaryItemType |
| Balance Type: |
debit |
| Period Type: |
instant |
|
| X |
- DefinitionSum of the carrying amounts as of the balance sheet date of all assets that are expected to be realized in cash, sold, or consumed within one year (or the normal operating cycle, if longer). Assets are probable future economic benefits obtained or controlled by an entity as a result of past transactions or events. Reference 1: http://www.xbrl.org/2003/role/disclosureRef
-Topic 810
-SubTopic 10
-Name Accounting Standards Codification
-Section 50
-Paragraph 3
-Subparagraph (bb)
-Publisher FASB
-URI https://asc.fasb.org//1943274/2147481203/810-10-50-3
Reference 2: http://www.xbrl.org/2003/role/disclosureRef
-Topic 810
-SubTopic 10
-Name Accounting Standards Codification
-Section 45
-Paragraph 25
-Subparagraph (a)
-Publisher FASB
-URI https://asc.fasb.org//1943274/2147481231/810-10-45-25
Reference 3: http://www.xbrl.org/2003/role/disclosureRef
-Topic 235
-SubTopic 10
-Name Accounting Standards Codification
-Section S99
-Paragraph 1
-Subparagraph (SX 210.4-08(g)(1)(ii))
-Publisher FASB
-URI https://asc.fasb.org//1943274/2147480678/235-10-S99-1
Reference 4: http://www.xbrl.org/2003/role/disclosureRef
-Topic 323
-SubTopic 10
-Name Accounting Standards Codification
-Section 50
-Paragraph 3
-Subparagraph (c)
-Publisher FASB
-URI https://asc.fasb.org//1943274/2147481687/323-10-50-3
Reference 5: http://www.xbrl.org/2003/role/disclosureRef
-Topic 825
-SubTopic 10
-Name Accounting Standards Codification
-Section 50
-Paragraph 28
-Subparagraph (f)
-Publisher FASB
-URI https://asc.fasb.org//1943274/2147482907/825-10-50-28
Reference 6: http://www.xbrl.org/2003/role/exampleRef
-Topic 852
-SubTopic 10
-Name Accounting Standards Codification
-Section 55
-Paragraph 10
-Publisher FASB
-URI https://asc.fasb.org//1943274/2147481372/852-10-55-10
Reference 7: http://www.xbrl.org/2003/role/disclosureRef
-Topic 210
-SubTopic 10
-Name Accounting Standards Codification
-Section 45
-Paragraph 1
-Publisher FASB
-URI https://asc.fasb.org//1943274/2147483467/210-10-45-1
Reference 8: http://www.xbrl.org/2003/role/disclosureRef
-Topic 210
-SubTopic 10
-Name Accounting Standards Codification
-Section S99
-Paragraph 1
-Subparagraph (SX 210.5-02(9))
-Publisher FASB
-URI https://asc.fasb.org//1943274/2147480566/210-10-S99-1
Reference 9: http://www.xbrl.org/2003/role/disclosureRef
-Topic 470
-SubTopic 10
-Name Accounting Standards Codification
-Section S99
-Paragraph 1A
-Subparagraph (SX 210.13-01(a)(4)(i))
-Publisher FASB
-URI https://asc.fasb.org//1943274/2147480097/470-10-S99-1A
Reference 10: http://www.xbrl.org/2009/role/commonPracticeRef
-Topic 470
-SubTopic 10
-Name Accounting Standards Codification
-Section S99
-Paragraph 1A
-Subparagraph (SX 210.13-01(a)(4)(ii))
-Publisher FASB
-URI https://asc.fasb.org//1943274/2147480097/470-10-S99-1A
Reference 11: http://www.xbrl.org/2009/role/commonPracticeRef
-Topic 470
-SubTopic 10
-Name Accounting Standards Codification
-Section S99
-Paragraph 1A
-Subparagraph (SX 210.13-01(a)(4)(iii))
-Publisher FASB
-URI https://asc.fasb.org//1943274/2147480097/470-10-S99-1A
Reference 12: http://www.xbrl.org/2003/role/disclosureRef
-Topic 470
-SubTopic 10
-Name Accounting Standards Codification
-Section S99
-Paragraph 1A
-Subparagraph (SX 210.13-01(a)(4)(iii)(A))
-Publisher FASB
-URI https://asc.fasb.org//1943274/2147480097/470-10-S99-1A
Reference 13: http://www.xbrl.org/2003/role/disclosureRef
-Topic 470
-SubTopic 10
-Name Accounting Standards Codification
-Section S99
-Paragraph 1A
-Subparagraph (SX 210.13-01(a)(4)(iv))
-Publisher FASB
-URI https://asc.fasb.org//1943274/2147480097/470-10-S99-1A
Reference 14: http://www.xbrl.org/2003/role/disclosureRef
-Topic 470
-SubTopic 10
-Name Accounting Standards Codification
-Section S99
-Paragraph 1A
-Subparagraph (SX 210.13-01(a)(5))
-Publisher FASB
-URI https://asc.fasb.org//1943274/2147480097/470-10-S99-1A
Reference 15: http://www.xbrl.org/2003/role/disclosureRef
-Topic 470
-SubTopic 10
-Name Accounting Standards Codification
-Section S99
-Paragraph 1B
-Subparagraph (SX 210.13-02(a)(4)(i))
-Publisher FASB
-URI https://asc.fasb.org//1943274/2147480097/470-10-S99-1B
Reference 16: http://www.xbrl.org/2003/role/disclosureRef
-Topic 470
-SubTopic 10
-Name Accounting Standards Codification
-Section S99
-Paragraph 1B
-Subparagraph (SX 210.13-02(a)(4)(iii)(A))
-Publisher FASB
-URI https://asc.fasb.org//1943274/2147480097/470-10-S99-1B
Reference 17: http://www.xbrl.org/2003/role/disclosureRef
-Topic 470
-SubTopic 10
-Name Accounting Standards Codification
-Section S99
-Paragraph 1B
-Subparagraph (SX 210.13-02(a)(4)(iii)(B))
-Publisher FASB
-URI https://asc.fasb.org//1943274/2147480097/470-10-S99-1B
Reference 18: http://www.xbrl.org/2003/role/disclosureRef
-Topic 470
-SubTopic 10
-Name Accounting Standards Codification
-Section S99
-Paragraph 1B
-Subparagraph (SX 210.13-02(a)(4)(iv))
-Publisher FASB
-URI https://asc.fasb.org//1943274/2147480097/470-10-S99-1B
Reference 19: http://www.xbrl.org/2003/role/disclosureRef
-Topic 470
-SubTopic 10
-Name Accounting Standards Codification
-Section S99
-Paragraph 1B
-Subparagraph (SX 210.13-02(a)(5))
-Publisher FASB
-URI https://asc.fasb.org//1943274/2147480097/470-10-S99-1B
Reference 20: http://www.xbrl.org/2009/role/commonPracticeRef
-Topic 852
-SubTopic 10
-Name Accounting Standards Codification
-Section 50
-Paragraph 7
-Subparagraph (a)
-Publisher FASB
-URI https://asc.fasb.org//1943274/2147481404/852-10-50-7
| Name: |
us-gaap_AssetsCurrent |
| Namespace Prefix: |
us-gaap_ |
| Data Type: |
xbrli:monetaryItemType |
| Balance Type: |
debit |
| Period Type: |
instant |
|
| X |
- References
+ Details
| Name: |
us-gaap_AssetsCurrentAbstract |
| Namespace Prefix: |
us-gaap_ |
| Data Type: |
xbrli:stringItemType |
| Balance Type: |
na |
| Period Type: |
duration |
|
| X |
- DefinitionSum of the carrying amounts as of the balance sheet date of all assets that are expected to be realized in cash, sold or consumed after one year or beyond the normal operating cycle, if longer. Reference 1: http://www.xbrl.org/2003/role/disclosureRef
-Topic 810
-SubTopic 10
-Name Accounting Standards Codification
-Section 50
-Paragraph 3
-Subparagraph (bb)
-Publisher FASB
-URI https://asc.fasb.org//1943274/2147481203/810-10-50-3
Reference 2: http://www.xbrl.org/2003/role/disclosureRef
-Topic 810
-SubTopic 10
-Name Accounting Standards Codification
-Section 45
-Paragraph 25
-Subparagraph (a)
-Publisher FASB
-URI https://asc.fasb.org//1943274/2147481231/810-10-45-25
Reference 3: http://www.xbrl.org/2003/role/disclosureRef
-Topic 235
-SubTopic 10
-Name Accounting Standards Codification
-Section S99
-Paragraph 1
-Subparagraph (SX 210.4-08(g)(1)(ii))
-Publisher FASB
-URI https://asc.fasb.org//1943274/2147480678/235-10-S99-1
Reference 4: http://www.xbrl.org/2003/role/disclosureRef
-Topic 323
-SubTopic 10
-Name Accounting Standards Codification
-Section 50
-Paragraph 3
-Subparagraph (c)
-Publisher FASB
-URI https://asc.fasb.org//1943274/2147481687/323-10-50-3
Reference 5: http://www.xbrl.org/2003/role/disclosureRef
-Topic 825
-SubTopic 10
-Name Accounting Standards Codification
-Section 50
-Paragraph 28
-Subparagraph (f)
-Publisher FASB
-URI https://asc.fasb.org//1943274/2147482907/825-10-50-28
Reference 6: http://www.xbrl.org/2003/role/disclosureRef
-Topic 470
-SubTopic 10
-Name Accounting Standards Codification
-Section S99
-Paragraph 1A
-Subparagraph (SX 210.13-01(a)(4)(i))
-Publisher FASB
-URI https://asc.fasb.org//1943274/2147480097/470-10-S99-1A
Reference 7: http://www.xbrl.org/2009/role/commonPracticeRef
-Topic 470
-SubTopic 10
-Name Accounting Standards Codification
-Section S99
-Paragraph 1A
-Subparagraph (SX 210.13-01(a)(4)(ii))
-Publisher FASB
-URI https://asc.fasb.org//1943274/2147480097/470-10-S99-1A
Reference 8: http://www.xbrl.org/2009/role/commonPracticeRef
-Topic 470
-SubTopic 10
-Name Accounting Standards Codification
-Section S99
-Paragraph 1A
-Subparagraph (SX 210.13-01(a)(4)(iii))
-Publisher FASB
-URI https://asc.fasb.org//1943274/2147480097/470-10-S99-1A
Reference 9: http://www.xbrl.org/2003/role/disclosureRef
-Topic 470
-SubTopic 10
-Name Accounting Standards Codification
-Section S99
-Paragraph 1A
-Subparagraph (SX 210.13-01(a)(4)(iii)(A))
-Publisher FASB
-URI https://asc.fasb.org//1943274/2147480097/470-10-S99-1A
Reference 10: http://www.xbrl.org/2003/role/disclosureRef
-Topic 470
-SubTopic 10
-Name Accounting Standards Codification
-Section S99
-Paragraph 1A
-Subparagraph (SX 210.13-01(a)(4)(iv))
-Publisher FASB
-URI https://asc.fasb.org//1943274/2147480097/470-10-S99-1A
Reference 11: http://www.xbrl.org/2003/role/disclosureRef
-Topic 470
-SubTopic 10
-Name Accounting Standards Codification
-Section S99
-Paragraph 1A
-Subparagraph (SX 210.13-01(a)(5))
-Publisher FASB
-URI https://asc.fasb.org//1943274/2147480097/470-10-S99-1A
Reference 12: http://www.xbrl.org/2003/role/disclosureRef
-Topic 470
-SubTopic 10
-Name Accounting Standards Codification
-Section S99
-Paragraph 1B
-Subparagraph (SX 210.13-02(a)(4)(i))
-Publisher FASB
-URI https://asc.fasb.org//1943274/2147480097/470-10-S99-1B
Reference 13: http://www.xbrl.org/2003/role/disclosureRef
-Topic 470
-SubTopic 10
-Name Accounting Standards Codification
-Section S99
-Paragraph 1B
-Subparagraph (SX 210.13-02(a)(4)(iii)(A))
-Publisher FASB
-URI https://asc.fasb.org//1943274/2147480097/470-10-S99-1B
Reference 14: http://www.xbrl.org/2003/role/disclosureRef
-Topic 470
-SubTopic 10
-Name Accounting Standards Codification
-Section S99
-Paragraph 1B
-Subparagraph (SX 210.13-02(a)(4)(iii)(B))
-Publisher FASB
-URI https://asc.fasb.org//1943274/2147480097/470-10-S99-1B
Reference 15: http://www.xbrl.org/2003/role/disclosureRef
-Topic 470
-SubTopic 10
-Name Accounting Standards Codification
-Section S99
-Paragraph 1B
-Subparagraph (SX 210.13-02(a)(4)(iv))
-Publisher FASB
-URI https://asc.fasb.org//1943274/2147480097/470-10-S99-1B
Reference 16: http://www.xbrl.org/2003/role/disclosureRef
-Topic 470
-SubTopic 10
-Name Accounting Standards Codification
-Section S99
-Paragraph 1B
-Subparagraph (SX 210.13-02(a)(5))
-Publisher FASB
-URI https://asc.fasb.org//1943274/2147480097/470-10-S99-1B
Reference 17: http://www.xbrl.org/2009/role/commonPracticeRef
-Topic 852
-SubTopic 10
-Name Accounting Standards Codification
-Section 50
-Paragraph 7
-Subparagraph (a)
-Publisher FASB
-URI https://asc.fasb.org//1943274/2147481404/852-10-50-7
| Name: |
us-gaap_AssetsNoncurrent |
| Namespace Prefix: |
us-gaap_ |
| Data Type: |
xbrli:monetaryItemType |
| Balance Type: |
debit |
| Period Type: |
instant |
|
| X |
- References
+ Details
| Name: |
us-gaap_AssetsNoncurrentAbstract |
| Namespace Prefix: |
us-gaap_ |
| Data Type: |
xbrli:stringItemType |
| Balance Type: |
na |
| Period Type: |
duration |
|
| X |
- DefinitionAmount of currency on hand as well as demand deposits with banks or financial institutions. Includes other kinds of accounts that have the general characteristics of demand deposits. Also includes short-term, highly liquid investments that are both readily convertible to known amounts of cash and so near their maturity that they present insignificant risk of changes in value because of changes in interest rates. Excludes cash and cash equivalents within disposal group and discontinued operation. Reference 1: http://www.xbrl.org/2003/role/disclosureRef
-Topic 210
-SubTopic 10
-Name Accounting Standards Codification
-Section S99
-Paragraph 1
-Subparagraph (SX 210.5-02(1))
-Publisher FASB
-URI https://asc.fasb.org//1943274/2147480566/210-10-S99-1
Reference 2: http://www.xbrl.org/2003/role/exampleRef
-Topic 210
-SubTopic 10
-Name Accounting Standards Codification
-Section 45
-Paragraph 1
-Subparagraph (a)
-Publisher FASB
-URI https://asc.fasb.org//1943274/2147483467/210-10-45-1
Reference 3: http://fasb.org/us-gaap/role/ref/legacyRef
-Name Accounting Standards Codification
-Topic 230
-SubTopic 10
-Section 45
-Paragraph 4
-Publisher FASB
-URI https://asc.fasb.org//1943274/2147482740/230-10-45-4
| Name: |
us-gaap_CashAndCashEquivalentsAtCarryingValue |
| Namespace Prefix: |
us-gaap_ |
| Data Type: |
xbrli:monetaryItemType |
| Balance Type: |
debit |
| Period Type: |
instant |
|
| X |
- DefinitionAggregate par or stated value of issued nonredeemable common stock (or common stock redeemable solely at the option of the issuer). This item includes treasury stock repurchased by the entity. Note: elements for number of nonredeemable common shares, par value and other disclosure concepts are in another section within stockholders' equity. Reference 1: http://www.xbrl.org/2003/role/exampleRef
-Topic 852
-SubTopic 10
-Name Accounting Standards Codification
-Section 55
-Paragraph 10
-Publisher FASB
-URI https://asc.fasb.org//1943274/2147481372/852-10-55-10
Reference 2: http://www.xbrl.org/2003/role/disclosureRef
-Topic 944
-SubTopic 210
-Name Accounting Standards Codification
-Section S99
-Paragraph 1
-Subparagraph (SX 210.7-03(a)(22))
-Publisher FASB
-URI https://asc.fasb.org//1943274/2147479440/944-210-S99-1
Reference 3: http://fasb.org/us-gaap/role/ref/legacyRef
-Topic 210
-SubTopic 10
-Name Accounting Standards Codification
-Section S99
-Paragraph 1
-Subparagraph (SX 210.5-02(29))
-Publisher FASB
-URI https://asc.fasb.org//1943274/2147480566/210-10-S99-1
| Name: |
us-gaap_CommonStockValue |
| Namespace Prefix: |
us-gaap_ |
| Data Type: |
xbrli:monetaryItemType |
| Balance Type: |
credit |
| Period Type: |
instant |
|
| X |
- DefinitionThe aggregate of all deposit liabilities held by the entity, including foreign and domestic, interest and noninterest bearing; may include demand deposits, saving deposits, Negotiable Order of Withdrawal (NOW) and time deposits among others. Reference 1: http://fasb.org/us-gaap/role/ref/legacyRef
-Name Accounting Standards Codification
-Topic 942
-SubTopic 210
-Section S99
-Paragraph 1
-Subparagraph (SX 210.9-03.12)
-Publisher FASB
-URI https://asc.fasb.org//1943274/2147479853/942-210-S99-1
| Name: |
us-gaap_Deposits |
| Namespace Prefix: |
us-gaap_ |
| Data Type: |
xbrli:monetaryItemType |
| Balance Type: |
credit |
| Period Type: |
instant |
|
| X |
- DefinitionAmount after amortization of assets, excluding financial assets and goodwill, lacking physical substance with a finite life. Reference 1: http://www.xbrl.org/2003/role/disclosureRef
-Topic 926
-SubTopic 20
-Name Accounting Standards Codification
-Section 50
-Paragraph 5
-Publisher FASB
-URI https://asc.fasb.org//1943274/2147483154/926-20-50-5
Reference 2: http://fasb.org/us-gaap/role/ref/legacyRef
-Topic 350
-SubTopic 30
-Name Accounting Standards Codification
-Section 50
-Paragraph 2
-Subparagraph (a)(1)
-Publisher FASB
-URI https://asc.fasb.org//1943274/2147482665/350-30-50-2
| Name: |
us-gaap_FiniteLivedIntangibleAssetsNet |
| Namespace Prefix: |
us-gaap_ |
| Data Type: |
xbrli:monetaryItemType |
| Balance Type: |
debit |
| Period Type: |
instant |
|
| X |
- References
+ Details
| Name: |
us-gaap_FiniteLivedIntangibleAssetsNetAbstract |
| Namespace Prefix: |
us-gaap_ |
| Data Type: |
xbrli:stringItemType |
| Balance Type: |
na |
| Period Type: |
duration |
|
| X |
- DefinitionAmount after valuation and LIFO reserves of inventory expected to be sold, or consumed within one year or operating cycle, if longer. Reference 1: http://www.xbrl.org/2003/role/exampleRef
-Topic 852
-SubTopic 10
-Name Accounting Standards Codification
-Section 55
-Paragraph 10
-Publisher FASB
-URI https://asc.fasb.org//1943274/2147481372/852-10-55-10
Reference 2: http://www.xbrl.org/2003/role/exampleRef
-Topic 210
-SubTopic 10
-Name Accounting Standards Codification
-Section 45
-Paragraph 1
-Subparagraph (b)
-Publisher FASB
-URI https://asc.fasb.org//1943274/2147483467/210-10-45-1
Reference 3: http://www.xbrl.org/2003/role/disclosureRef
-Topic 210
-SubTopic 10
-Name Accounting Standards Codification
-Section S99
-Paragraph 1
-Subparagraph (SX 210.5-02(6))
-Publisher FASB
-URI https://asc.fasb.org//1943274/2147480566/210-10-S99-1
| Name: |
us-gaap_InventoryNet |
| Namespace Prefix: |
us-gaap_ |
| Data Type: |
xbrli:monetaryItemType |
| Balance Type: |
debit |
| Period Type: |
instant |
|
| X |
- DefinitionSum of the carrying amounts as of the balance sheet date of all liabilities that are recognized. Liabilities are probable future sacrifices of economic benefits arising from present obligations of an entity to transfer assets or provide services to other entities in the future. Reference 1: http://www.xbrl.org/2003/role/disclosureRef
-Topic 810
-SubTopic 10
-Name Accounting Standards Codification
-Section 50
-Paragraph 3
-Subparagraph (c)
-Publisher FASB
-URI https://asc.fasb.org//1943274/2147481203/810-10-50-3
Reference 2: http://www.xbrl.org/2003/role/disclosureRef
-Topic 810
-SubTopic 10
-Name Accounting Standards Codification
-Section 45
-Paragraph 25
-Subparagraph (b)
-Publisher FASB
-URI https://asc.fasb.org//1943274/2147481231/810-10-45-25
Reference 3: http://www.xbrl.org/2003/role/disclosureRef
-Topic 810
-SubTopic 10
-Name Accounting Standards Codification
-Section 50
-Paragraph 3
-Subparagraph (bb)
-Publisher FASB
-URI https://asc.fasb.org//1943274/2147481203/810-10-50-3
Reference 4: http://www.xbrl.org/2003/role/disclosureRef
-Topic 235
-SubTopic 10
-Name Accounting Standards Codification
-Section S99
-Paragraph 1
-Subparagraph (SX 210.4-08(g)(1)(ii))
-Publisher FASB
-URI https://asc.fasb.org//1943274/2147480678/235-10-S99-1
Reference 5: http://www.xbrl.org/2003/role/disclosureRef
-Topic 323
-SubTopic 10
-Name Accounting Standards Codification
-Section 50
-Paragraph 3
-Subparagraph (c)
-Publisher FASB
-URI https://asc.fasb.org//1943274/2147481687/323-10-50-3
Reference 6: http://www.xbrl.org/2003/role/disclosureRef
-Topic 825
-SubTopic 10
-Name Accounting Standards Codification
-Section 50
-Paragraph 28
-Subparagraph (f)
-Publisher FASB
-URI https://asc.fasb.org//1943274/2147482907/825-10-50-28
Reference 7: http://www.xbrl.org/2003/role/exampleRef
-Topic 946
-SubTopic 830
-Name Accounting Standards Codification
-Section 55
-Paragraph 12
-Publisher FASB
-URI https://asc.fasb.org//1943274/2147480167/946-830-55-12
Reference 8: http://www.xbrl.org/2003/role/disclosureRef
-Topic 946
-SubTopic 210
-Name Accounting Standards Codification
-Section S99
-Paragraph 1
-Subparagraph (SX 210.6-04(14))
-Publisher FASB
-URI https://asc.fasb.org//1943274/2147479617/946-210-S99-1
Reference 9: http://www.xbrl.org/2003/role/disclosureRef
-Topic 470
-SubTopic 10
-Name Accounting Standards Codification
-Section S99
-Paragraph 1A
-Subparagraph (SX 210.13-01(a)(4)(i))
-Publisher FASB
-URI https://asc.fasb.org//1943274/2147480097/470-10-S99-1A
Reference 10: http://www.xbrl.org/2009/role/commonPracticeRef
-Topic 470
-SubTopic 10
-Name Accounting Standards Codification
-Section S99
-Paragraph 1A
-Subparagraph (SX 210.13-01(a)(4)(ii))
-Publisher FASB
-URI https://asc.fasb.org//1943274/2147480097/470-10-S99-1A
Reference 11: http://www.xbrl.org/2003/role/disclosureRef
-Topic 470
-SubTopic 10
-Name Accounting Standards Codification
-Section S99
-Paragraph 1A
-Subparagraph (SX 210.13-01(a)(4)(iii)(A))
-Publisher FASB
-URI https://asc.fasb.org//1943274/2147480097/470-10-S99-1A
Reference 12: http://www.xbrl.org/2003/role/disclosureRef
-Topic 470
-SubTopic 10
-Name Accounting Standards Codification
-Section S99
-Paragraph 1A
-Subparagraph (SX 210.13-01(a)(4)(iv))
-Publisher FASB
-URI https://asc.fasb.org//1943274/2147480097/470-10-S99-1A
Reference 13: http://www.xbrl.org/2003/role/disclosureRef
-Topic 470
-SubTopic 10
-Name Accounting Standards Codification
-Section S99
-Paragraph 1A
-Subparagraph (SX 210.13-01(a)(5))
-Publisher FASB
-URI https://asc.fasb.org//1943274/2147480097/470-10-S99-1A
Reference 14: http://www.xbrl.org/2003/role/disclosureRef
-Topic 470
-SubTopic 10
-Name Accounting Standards Codification
-Section S99
-Paragraph 1B
-Subparagraph (SX 210.13-02(a)(4)(i))
-Publisher FASB
-URI https://asc.fasb.org//1943274/2147480097/470-10-S99-1B
Reference 15: http://www.xbrl.org/2003/role/disclosureRef
-Topic 470
-SubTopic 10
-Name Accounting Standards Codification
-Section S99
-Paragraph 1B
-Subparagraph (SX 210.13-02(a)(4)(iii)(A))
-Publisher FASB
-URI https://asc.fasb.org//1943274/2147480097/470-10-S99-1B
Reference 16: http://www.xbrl.org/2003/role/disclosureRef
-Topic 470
-SubTopic 10
-Name Accounting Standards Codification
-Section S99
-Paragraph 1B
-Subparagraph (SX 210.13-02(a)(4)(iii)(B))
-Publisher FASB
-URI https://asc.fasb.org//1943274/2147480097/470-10-S99-1B
Reference 17: http://www.xbrl.org/2003/role/disclosureRef
-Topic 470
-SubTopic 10
-Name Accounting Standards Codification
-Section S99
-Paragraph 1B
-Subparagraph (SX 210.13-02(a)(4)(iv))
-Publisher FASB
-URI https://asc.fasb.org//1943274/2147480097/470-10-S99-1B
Reference 18: http://www.xbrl.org/2003/role/disclosureRef
-Topic 470
-SubTopic 10
-Name Accounting Standards Codification
-Section S99
-Paragraph 1B
-Subparagraph (SX 210.13-02(a)(5))
-Publisher FASB
-URI https://asc.fasb.org//1943274/2147480097/470-10-S99-1B
Reference 19: http://www.xbrl.org/2009/role/commonPracticeRef
-Topic 852
-SubTopic 10
-Name Accounting Standards Codification
-Section 50
-Paragraph 7
-Subparagraph (a)
-Publisher FASB
-URI https://asc.fasb.org//1943274/2147481404/852-10-50-7
Reference 20: http://www.xbrl.org/2009/role/commonPracticeRef
-Topic 852
-SubTopic 10
-Name Accounting Standards Codification
-Section 50
-Paragraph 7
-Subparagraph (b)
-Publisher FASB
-URI https://asc.fasb.org//1943274/2147481404/852-10-50-7
Reference 21: http://www.xbrl.org/2003/role/exampleRef
-Topic 280
-SubTopic 10
-Name Accounting Standards Codification
-Section 50
-Paragraph 30
-Subparagraph (d)
-Publisher FASB
-URI https://asc.fasb.org//1943274/2147482810/280-10-50-30
Reference 22: http://fasb.org/us-gaap/role/ref/legacyRef
-Name Accounting Standards Codification
-Topic 210
-SubTopic 10
-Section S99
-Paragraph 1
-Subparagraph (SX 210.5-02.19-26)
-Publisher FASB
-URI https://asc.fasb.org//1943274/2147480566/210-10-S99-1
| Name: |
us-gaap_Liabilities |
| Namespace Prefix: |
us-gaap_ |
| Data Type: |
xbrli:monetaryItemType |
| Balance Type: |
credit |
| Period Type: |
instant |
|
| X |
- DefinitionAmount of liabilities and equity items, including the portion of equity attributable to noncontrolling interests, if any. Reference 1: http://www.xbrl.org/2003/role/exampleRef
-Topic 852
-SubTopic 10
-Name Accounting Standards Codification
-Section 55
-Paragraph 10
-Publisher FASB
-URI https://asc.fasb.org//1943274/2147481372/852-10-55-10
Reference 2: http://www.xbrl.org/2003/role/disclosureRef
-Topic 944
-SubTopic 210
-Name Accounting Standards Codification
-Section S99
-Paragraph 1
-Subparagraph (SX 210.7-03(a)(25))
-Publisher FASB
-URI https://asc.fasb.org//1943274/2147479440/944-210-S99-1
Reference 3: http://www.xbrl.org/2009/role/commonPracticeRef
-Topic 235
-SubTopic 10
-Name Accounting Standards Codification
-Section S99
-Paragraph 1
-Subparagraph (SX 210.4-08(g)(1)(ii))
-Publisher FASB
-URI https://asc.fasb.org//1943274/2147480678/235-10-S99-1
Reference 4: http://www.xbrl.org/2009/role/commonPracticeRef
-Topic 323
-SubTopic 10
-Name Accounting Standards Codification
-Section 50
-Paragraph 3
-Subparagraph (c)
-Publisher FASB
-URI https://asc.fasb.org//1943274/2147481687/323-10-50-3
Reference 5: http://www.xbrl.org/2009/role/commonPracticeRef
-Topic 825
-SubTopic 10
-Name Accounting Standards Codification
-Section 50
-Paragraph 28
-Subparagraph (f)
-Publisher FASB
-URI https://asc.fasb.org//1943274/2147482907/825-10-50-28
Reference 6: http://fasb.org/us-gaap/role/ref/legacyRef
-Topic 942
-SubTopic 210
-Name Accounting Standards Codification
-Section S99
-Paragraph 1
-Subparagraph (SX 210.9-03(23))
-Publisher FASB
-URI https://asc.fasb.org//1943274/2147479853/942-210-S99-1
Reference 7: http://fasb.org/us-gaap/role/ref/legacyRef
-Topic 210
-SubTopic 10
-Name Accounting Standards Codification
-Section S99
-Paragraph 1
-Subparagraph (SX 210.5-02(32))
-Publisher FASB
-URI https://asc.fasb.org//1943274/2147480566/210-10-S99-1
| Name: |
us-gaap_LiabilitiesAndStockholdersEquity |
| Namespace Prefix: |
us-gaap_ |
| Data Type: |
xbrli:monetaryItemType |
| Balance Type: |
credit |
| Period Type: |
instant |
|
| X |
- DefinitionTotal obligations incurred as part of normal operations that are expected to be paid during the following twelve months or within one business cycle, if longer. Reference 1: http://www.xbrl.org/2003/role/disclosureRef
-Topic 810
-SubTopic 10
-Name Accounting Standards Codification
-Section 50
-Paragraph 3
-Subparagraph (c)
-Publisher FASB
-URI https://asc.fasb.org//1943274/2147481203/810-10-50-3
Reference 2: http://www.xbrl.org/2003/role/disclosureRef
-Topic 810
-SubTopic 10
-Name Accounting Standards Codification
-Section 45
-Paragraph 25
-Subparagraph (b)
-Publisher FASB
-URI https://asc.fasb.org//1943274/2147481231/810-10-45-25
Reference 3: http://www.xbrl.org/2003/role/disclosureRef
-Topic 810
-SubTopic 10
-Name Accounting Standards Codification
-Section 50
-Paragraph 3
-Subparagraph (bb)
-Publisher FASB
-URI https://asc.fasb.org//1943274/2147481203/810-10-50-3
Reference 4: http://www.xbrl.org/2003/role/disclosureRef
-Topic 235
-SubTopic 10
-Name Accounting Standards Codification
-Section S99
-Paragraph 1
-Subparagraph (SX 210.4-08(g)(1)(ii))
-Publisher FASB
-URI https://asc.fasb.org//1943274/2147480678/235-10-S99-1
Reference 5: http://www.xbrl.org/2003/role/disclosureRef
-Topic 323
-SubTopic 10
-Name Accounting Standards Codification
-Section 50
-Paragraph 3
-Subparagraph (c)
-Publisher FASB
-URI https://asc.fasb.org//1943274/2147481687/323-10-50-3
Reference 6: http://www.xbrl.org/2003/role/disclosureRef
-Topic 825
-SubTopic 10
-Name Accounting Standards Codification
-Section 50
-Paragraph 28
-Subparagraph (f)
-Publisher FASB
-URI https://asc.fasb.org//1943274/2147482907/825-10-50-28
Reference 7: http://www.xbrl.org/2003/role/exampleRef
-Topic 852
-SubTopic 10
-Name Accounting Standards Codification
-Section 55
-Paragraph 10
-Publisher FASB
-URI https://asc.fasb.org//1943274/2147481372/852-10-55-10
Reference 8: http://www.xbrl.org/2003/role/disclosureRef
-Topic 210
-SubTopic 10
-Name Accounting Standards Codification
-Section 45
-Paragraph 5
-Publisher FASB
-URI https://asc.fasb.org//1943274/2147483467/210-10-45-5
Reference 9: http://www.xbrl.org/2003/role/disclosureRef
-Topic 470
-SubTopic 10
-Name Accounting Standards Codification
-Section S99
-Paragraph 1A
-Subparagraph (SX 210.13-01(a)(4)(i))
-Publisher FASB
-URI https://asc.fasb.org//1943274/2147480097/470-10-S99-1A
Reference 10: http://www.xbrl.org/2009/role/commonPracticeRef
-Topic 470
-SubTopic 10
-Name Accounting Standards Codification
-Section S99
-Paragraph 1A
-Subparagraph (SX 210.13-01(a)(4)(ii))
-Publisher FASB
-URI https://asc.fasb.org//1943274/2147480097/470-10-S99-1A
Reference 11: http://www.xbrl.org/2003/role/disclosureRef
-Topic 470
-SubTopic 10
-Name Accounting Standards Codification
-Section S99
-Paragraph 1A
-Subparagraph (SX 210.13-01(a)(4)(iii)(A))
-Publisher FASB
-URI https://asc.fasb.org//1943274/2147480097/470-10-S99-1A
Reference 12: http://www.xbrl.org/2003/role/disclosureRef
-Topic 470
-SubTopic 10
-Name Accounting Standards Codification
-Section S99
-Paragraph 1A
-Subparagraph (SX 210.13-01(a)(4)(iv))
-Publisher FASB
-URI https://asc.fasb.org//1943274/2147480097/470-10-S99-1A
Reference 13: http://www.xbrl.org/2003/role/disclosureRef
-Topic 470
-SubTopic 10
-Name Accounting Standards Codification
-Section S99
-Paragraph 1A
-Subparagraph (SX 210.13-01(a)(5))
-Publisher FASB
-URI https://asc.fasb.org//1943274/2147480097/470-10-S99-1A
Reference 14: http://www.xbrl.org/2003/role/disclosureRef
-Topic 470
-SubTopic 10
-Name Accounting Standards Codification
-Section S99
-Paragraph 1B
-Subparagraph (SX 210.13-02(a)(4)(i))
-Publisher FASB
-URI https://asc.fasb.org//1943274/2147480097/470-10-S99-1B
Reference 15: http://www.xbrl.org/2003/role/disclosureRef
-Topic 470
-SubTopic 10
-Name Accounting Standards Codification
-Section S99
-Paragraph 1B
-Subparagraph (SX 210.13-02(a)(4)(iii)(A))
-Publisher FASB
-URI https://asc.fasb.org//1943274/2147480097/470-10-S99-1B
Reference 16: http://www.xbrl.org/2003/role/disclosureRef
-Topic 470
-SubTopic 10
-Name Accounting Standards Codification
-Section S99
-Paragraph 1B
-Subparagraph (SX 210.13-02(a)(4)(iii)(B))
-Publisher FASB
-URI https://asc.fasb.org//1943274/2147480097/470-10-S99-1B
Reference 17: http://www.xbrl.org/2003/role/disclosureRef
-Topic 470
-SubTopic 10
-Name Accounting Standards Codification
-Section S99
-Paragraph 1B
-Subparagraph (SX 210.13-02(a)(4)(iv))
-Publisher FASB
-URI https://asc.fasb.org//1943274/2147480097/470-10-S99-1B
Reference 18: http://www.xbrl.org/2003/role/disclosureRef
-Topic 470
-SubTopic 10
-Name Accounting Standards Codification
-Section S99
-Paragraph 1B
-Subparagraph (SX 210.13-02(a)(5))
-Publisher FASB
-URI https://asc.fasb.org//1943274/2147480097/470-10-S99-1B
Reference 19: http://www.xbrl.org/2009/role/commonPracticeRef
-Topic 852
-SubTopic 10
-Name Accounting Standards Codification
-Section 50
-Paragraph 7
-Subparagraph (a)
-Publisher FASB
-URI https://asc.fasb.org//1943274/2147481404/852-10-50-7
Reference 20: http://www.xbrl.org/2009/role/commonPracticeRef
-Topic 852
-SubTopic 10
-Name Accounting Standards Codification
-Section 50
-Paragraph 7
-Subparagraph (b)
-Publisher FASB
-URI https://asc.fasb.org//1943274/2147481404/852-10-50-7
Reference 21: http://fasb.org/us-gaap/role/ref/legacyRef
-Name Accounting Standards Codification
-Topic 210
-SubTopic 10
-Section S99
-Paragraph 1
-Subparagraph (SX 210.5-02.21)
-Publisher FASB
-URI https://asc.fasb.org//1943274/2147480566/210-10-S99-1
| Name: |
us-gaap_LiabilitiesCurrent |
| Namespace Prefix: |
us-gaap_ |
| Data Type: |
xbrli:monetaryItemType |
| Balance Type: |
credit |
| Period Type: |
instant |
|
| X |
- References
+ Details
| Name: |
us-gaap_LiabilitiesCurrentAbstract |
| Namespace Prefix: |
us-gaap_ |
| Data Type: |
xbrli:stringItemType |
| Balance Type: |
na |
| Period Type: |
duration |
|
| X |
- DefinitionAmount of obligation due after one year or beyond the normal operating cycle, if longer. Reference 1: http://fasb.org/us-gaap/role/ref/legacyRef
-Name Accounting Standards Codification
-Section S99
-Paragraph 1
-Subparagraph (SX 210.5-02(22))
-SubTopic 10
-Topic 210
-Publisher FASB
-URI https://asc.fasb.org//1943274/2147480566/210-10-S99-1
Reference 2: http://www.xbrl.org/2003/role/disclosureRef
-Topic 810
-SubTopic 10
-Name Accounting Standards Codification
-Section 50
-Paragraph 3
-Subparagraph (c)
-Publisher FASB
-URI https://asc.fasb.org//1943274/2147481203/810-10-50-3
Reference 3: http://www.xbrl.org/2003/role/disclosureRef
-Topic 810
-SubTopic 10
-Name Accounting Standards Codification
-Section 45
-Paragraph 25
-Subparagraph (b)
-Publisher FASB
-URI https://asc.fasb.org//1943274/2147481231/810-10-45-25
Reference 4: http://www.xbrl.org/2003/role/disclosureRef
-Topic 810
-SubTopic 10
-Name Accounting Standards Codification
-Section 50
-Paragraph 3
-Subparagraph (bb)
-Publisher FASB
-URI https://asc.fasb.org//1943274/2147481203/810-10-50-3
Reference 5: http://www.xbrl.org/2003/role/disclosureRef
-Topic 235
-SubTopic 10
-Name Accounting Standards Codification
-Section S99
-Paragraph 1
-Subparagraph (SX 210.4-08(g)(1)(ii))
-Publisher FASB
-URI https://asc.fasb.org//1943274/2147480678/235-10-S99-1
Reference 6: http://www.xbrl.org/2003/role/disclosureRef
-Topic 323
-SubTopic 10
-Name Accounting Standards Codification
-Section 50
-Paragraph 3
-Subparagraph (c)
-Publisher FASB
-URI https://asc.fasb.org//1943274/2147481687/323-10-50-3
Reference 7: http://www.xbrl.org/2003/role/disclosureRef
-Topic 825
-SubTopic 10
-Name Accounting Standards Codification
-Section 50
-Paragraph 28
-Subparagraph (f)
-Publisher FASB
-URI https://asc.fasb.org//1943274/2147482907/825-10-50-28
Reference 8: http://www.xbrl.org/2003/role/disclosureRef
-Topic 470
-SubTopic 10
-Name Accounting Standards Codification
-Section S99
-Paragraph 1A
-Subparagraph (SX 210.13-01(a)(4)(i))
-Publisher FASB
-URI https://asc.fasb.org//1943274/2147480097/470-10-S99-1A
Reference 9: http://www.xbrl.org/2009/role/commonPracticeRef
-Topic 470
-SubTopic 10
-Name Accounting Standards Codification
-Section S99
-Paragraph 1A
-Subparagraph (SX 210.13-01(a)(4)(ii))
-Publisher FASB
-URI https://asc.fasb.org//1943274/2147480097/470-10-S99-1A
Reference 10: http://www.xbrl.org/2003/role/disclosureRef
-Topic 470
-SubTopic 10
-Name Accounting Standards Codification
-Section S99
-Paragraph 1A
-Subparagraph (SX 210.13-01(a)(4)(iii)(A))
-Publisher FASB
-URI https://asc.fasb.org//1943274/2147480097/470-10-S99-1A
Reference 11: http://www.xbrl.org/2003/role/disclosureRef
-Topic 470
-SubTopic 10
-Name Accounting Standards Codification
-Section S99
-Paragraph 1A
-Subparagraph (SX 210.13-01(a)(4)(iv))
-Publisher FASB
-URI https://asc.fasb.org//1943274/2147480097/470-10-S99-1A
Reference 12: http://www.xbrl.org/2003/role/disclosureRef
-Topic 470
-SubTopic 10
-Name Accounting Standards Codification
-Section S99
-Paragraph 1A
-Subparagraph (SX 210.13-01(a)(5))
-Publisher FASB
-URI https://asc.fasb.org//1943274/2147480097/470-10-S99-1A
Reference 13: http://www.xbrl.org/2003/role/disclosureRef
-Topic 470
-SubTopic 10
-Name Accounting Standards Codification
-Section S99
-Paragraph 1B
-Subparagraph (SX 210.13-02(a)(4)(i))
-Publisher FASB
-URI https://asc.fasb.org//1943274/2147480097/470-10-S99-1B
Reference 14: http://www.xbrl.org/2003/role/disclosureRef
-Topic 470
-SubTopic 10
-Name Accounting Standards Codification
-Section S99
-Paragraph 1B
-Subparagraph (SX 210.13-02(a)(4)(iii)(A))
-Publisher FASB
-URI https://asc.fasb.org//1943274/2147480097/470-10-S99-1B
Reference 15: http://www.xbrl.org/2003/role/disclosureRef
-Topic 470
-SubTopic 10
-Name Accounting Standards Codification
-Section S99
-Paragraph 1B
-Subparagraph (SX 210.13-02(a)(4)(iii)(B))
-Publisher FASB
-URI https://asc.fasb.org//1943274/2147480097/470-10-S99-1B
Reference 16: http://www.xbrl.org/2003/role/disclosureRef
-Topic 470
-SubTopic 10
-Name Accounting Standards Codification
-Section S99
-Paragraph 1B
-Subparagraph (SX 210.13-02(a)(4)(iv))
-Publisher FASB
-URI https://asc.fasb.org//1943274/2147480097/470-10-S99-1B
Reference 17: http://www.xbrl.org/2003/role/disclosureRef
-Topic 470
-SubTopic 10
-Name Accounting Standards Codification
-Section S99
-Paragraph 1B
-Subparagraph (SX 210.13-02(a)(5))
-Publisher FASB
-URI https://asc.fasb.org//1943274/2147480097/470-10-S99-1B
Reference 18: http://www.xbrl.org/2009/role/commonPracticeRef
-Topic 852
-SubTopic 10
-Name Accounting Standards Codification
-Section 50
-Paragraph 7
-Subparagraph (a)
-Publisher FASB
-URI https://asc.fasb.org//1943274/2147481404/852-10-50-7
Reference 19: http://www.xbrl.org/2009/role/commonPracticeRef
-Topic 852
-SubTopic 10
-Name Accounting Standards Codification
-Section 50
-Paragraph 7
-Subparagraph (b)
-Publisher FASB
-URI https://asc.fasb.org//1943274/2147481404/852-10-50-7
Reference 20: http://fasb.org/us-gaap/role/ref/legacyRef
-Topic 210
-SubTopic 10
-Name Accounting Standards Codification
-Section S99
-Paragraph 1
-Subparagraph (SX 210.5-02(23))
-Publisher FASB
-URI https://asc.fasb.org//1943274/2147480566/210-10-S99-1
Reference 21: http://fasb.org/us-gaap/role/ref/legacyRef
-Topic 210
-SubTopic 10
-Name Accounting Standards Codification
-Section S99
-Paragraph 1
-Subparagraph (SX 201.5-02(24))
-Publisher FASB
-URI https://asc.fasb.org//1943274/2147480566/210-10-S99-1
Reference 22: http://fasb.org/us-gaap/role/ref/legacyRef
-Topic 210
-SubTopic 10
-Name Accounting Standards Codification
-Section S99
-Paragraph 1
-Subparagraph (SX 201.5-02(25))
-Publisher FASB
-URI https://asc.fasb.org//1943274/2147480566/210-10-S99-1
Reference 23: http://fasb.org/us-gaap/role/ref/legacyRef
-Topic 210
-SubTopic 10
-Name Accounting Standards Codification
-Section S99
-Paragraph 1
-Subparagraph (SX 201.5-02(26))
-Publisher FASB
-URI https://asc.fasb.org//1943274/2147480566/210-10-S99-1
| Name: |
us-gaap_LiabilitiesNoncurrent |
| Namespace Prefix: |
us-gaap_ |
| Data Type: |
xbrli:monetaryItemType |
| Balance Type: |
credit |
| Period Type: |
instant |
|
| X |
- References
+ Details
| Name: |
us-gaap_LiabilitiesNoncurrentAbstract |
| Namespace Prefix: |
us-gaap_ |
| Data Type: |
xbrli:stringItemType |
| Balance Type: |
na |
| Period Type: |
duration |
|
| X |
- DefinitionPresent value of lessee's discounted obligation for lease payments from operating lease, classified as current. Reference 1: http://www.xbrl.org/2003/role/disclosureRef
-Topic 842
-SubTopic 20
-Name Accounting Standards Codification
-Section 45
-Paragraph 1
-Subparagraph (b)
-Publisher FASB
-URI https://asc.fasb.org//1943274/2147479041/842-20-45-1
| Name: |
us-gaap_OperatingLeaseLiabilityCurrent |
| Namespace Prefix: |
us-gaap_ |
| Data Type: |
xbrli:monetaryItemType |
| Balance Type: |
credit |
| Period Type: |
instant |
|
| X |
- DefinitionPresent value of lessee's discounted obligation for lease payments from operating lease, classified as noncurrent. Reference 1: http://www.xbrl.org/2003/role/disclosureRef
-Topic 842
-SubTopic 20
-Name Accounting Standards Codification
-Section 45
-Paragraph 1
-Subparagraph (b)
-Publisher FASB
-URI https://asc.fasb.org//1943274/2147479041/842-20-45-1
| Name: |
us-gaap_OperatingLeaseLiabilityNoncurrent |
| Namespace Prefix: |
us-gaap_ |
| Data Type: |
xbrli:monetaryItemType |
| Balance Type: |
credit |
| Period Type: |
instant |
|
| X |
- DefinitionAmount of lessee's right to use underlying asset under operating lease. Reference 1: http://www.xbrl.org/2003/role/disclosureRef
-Topic 842
-SubTopic 20
-Name Accounting Standards Codification
-Section 45
-Paragraph 1
-Subparagraph (a)
-Publisher FASB
-URI https://asc.fasb.org//1943274/2147479041/842-20-45-1
| Name: |
us-gaap_OperatingLeaseRightOfUseAsset |
| Namespace Prefix: |
us-gaap_ |
| Data Type: |
xbrli:monetaryItemType |
| Balance Type: |
debit |
| Period Type: |
instant |
|
| X |
- DefinitionAmount of liabilities classified as other, due within one year or the normal operating cycle, if longer. Reference 1: http://www.xbrl.org/2003/role/exampleRef
-Topic 852
-SubTopic 10
-Name Accounting Standards Codification
-Section 55
-Paragraph 10
-Publisher FASB
-URI https://asc.fasb.org//1943274/2147481372/852-10-55-10
Reference 2: http://fasb.org/us-gaap/role/ref/legacyRef
-Name Accounting Standards Codification
-Topic 210
-SubTopic 10
-Section S99
-Paragraph 1
-Subparagraph (SX 210.5-02.20)
-Publisher FASB
-URI https://asc.fasb.org//1943274/2147480566/210-10-S99-1
| Name: |
us-gaap_OtherLiabilitiesCurrent |
| Namespace Prefix: |
us-gaap_ |
| Data Type: |
xbrli:monetaryItemType |
| Balance Type: |
credit |
| Period Type: |
instant |
|
| X |
- DefinitionAmount of liabilities classified as other, due after one year or the normal operating cycle, if longer. Reference 1: http://fasb.org/us-gaap/role/ref/legacyRef
-Name Accounting Standards Codification
-Topic 210
-SubTopic 10
-Section S99
-Paragraph 1
-Subparagraph (SX 210.5-02.24)
-Publisher FASB
-URI https://asc.fasb.org//1943274/2147480566/210-10-S99-1
| Name: |
us-gaap_OtherLiabilitiesNoncurrent |
| Namespace Prefix: |
us-gaap_ |
| Data Type: |
xbrli:monetaryItemType |
| Balance Type: |
credit |
| Period Type: |
instant |
|
| X |
- DefinitionAmount, after allowance, of receivables classified as other, due within one year or the operating cycle, if longer.
| Name: |
us-gaap_OtherReceivablesNetCurrent |
| Namespace Prefix: |
us-gaap_ |
| Data Type: |
xbrli:monetaryItemType |
| Balance Type: |
debit |
| Period Type: |
instant |
|
| X |
- DefinitionAggregate par or stated value of issued nonredeemable preferred stock (or preferred stock redeemable solely at the option of the issuer). This item includes treasury stock repurchased by the entity. Note: elements for number of nonredeemable preferred shares, par value and other disclosure concepts are in another section within stockholders' equity. Reference 1: http://www.xbrl.org/2003/role/exampleRef
-Topic 852
-SubTopic 10
-Name Accounting Standards Codification
-Section 55
-Paragraph 10
-Publisher FASB
-URI https://asc.fasb.org//1943274/2147481372/852-10-55-10
Reference 2: http://www.xbrl.org/2003/role/disclosureRef
-Topic 944
-SubTopic 210
-Name Accounting Standards Codification
-Section S99
-Paragraph 1
-Subparagraph (SX 210.7-03(a)(21))
-Publisher FASB
-URI https://asc.fasb.org//1943274/2147479440/944-210-S99-1
Reference 3: http://fasb.org/us-gaap/role/ref/legacyRef
-Topic 210
-SubTopic 10
-Name Accounting Standards Codification
-Section S99
-Paragraph 1
-Subparagraph (SX 210.5-02(28))
-Publisher FASB
-URI https://asc.fasb.org//1943274/2147480566/210-10-S99-1
| Name: |
us-gaap_PreferredStockValue |
| Namespace Prefix: |
us-gaap_ |
| Data Type: |
xbrli:monetaryItemType |
| Balance Type: |
credit |
| Period Type: |
instant |
|
| X |
- DefinitionAmount of asset related to consideration paid in advance for costs that provide economic benefits in future periods, and amount of other assets that are expected to be realized or consumed within one year or the normal operating cycle, if longer. Reference 1: http://www.xbrl.org/2009/role/commonPracticeRef
-Topic 210
-SubTopic 10
-Name Accounting Standards Codification
-Section S99
-Paragraph 1
-Subparagraph (SX 210.5-02(9))
-Publisher FASB
-URI https://asc.fasb.org//1943274/2147480566/210-10-S99-1
| Name: |
us-gaap_PrepaidExpenseAndOtherAssetsCurrent |
| Namespace Prefix: |
us-gaap_ |
| Data Type: |
xbrli:monetaryItemType |
| Balance Type: |
debit |
| Period Type: |
instant |
|
| X |
- DefinitionAmount after accumulated depreciation, depletion and amortization of physical assets used in the normal conduct of business to produce goods and services and not intended for resale. Examples include, but are not limited to, land, buildings, machinery and equipment, office equipment, and furniture and fixtures. Reference 1: http://fasb.org/us-gaap/role/ref/legacyRef
-Name Accounting Standards Codification
-Section 50
-Paragraph 1
-SubTopic 10
-Topic 360
-Publisher FASB
-URI https://asc.fasb.org//1943274/2147482099/360-10-50-1
Reference 2: http://www.xbrl.org/2003/role/exampleRef
-Topic 852
-SubTopic 10
-Name Accounting Standards Codification
-Section 55
-Paragraph 10
-Publisher FASB
-URI https://asc.fasb.org//1943274/2147481372/852-10-55-10
Reference 3: http://www.xbrl.org/2003/role/disclosureRef
-Topic 944
-SubTopic 210
-Name Accounting Standards Codification
-Section S99
-Paragraph 1
-Subparagraph (SX 210.7-03(a)(8))
-Publisher FASB
-URI https://asc.fasb.org//1943274/2147479440/944-210-S99-1
Reference 4: http://www.xbrl.org/2003/role/disclosureRef
-Topic 942
-SubTopic 360
-Name Accounting Standards Codification
-Section 50
-Paragraph 1
-Publisher FASB
-URI https://asc.fasb.org//1943274/2147480842/942-360-50-1
| Name: |
us-gaap_PropertyPlantAndEquipmentNet |
| Namespace Prefix: |
us-gaap_ |
| Data Type: |
xbrli:monetaryItemType |
| Balance Type: |
debit |
| Period Type: |
instant |
|
| X |
- DefinitionAmount of accumulated undistributed earnings (deficit). Reference 1: http://www.xbrl.org/2003/role/exampleRef
-Topic 852
-SubTopic 10
-Name Accounting Standards Codification
-Section 55
-Paragraph 10
-Publisher FASB
-URI https://asc.fasb.org//1943274/2147481372/852-10-55-10
Reference 2: http://www.xbrl.org/2003/role/disclosureRef
-Topic 944
-SubTopic 40
-Name Accounting Standards Codification
-Section 65
-Paragraph 2
-Subparagraph (g)(2)(i)
-Publisher FASB
-URI https://asc.fasb.org//1943274/2147480016/944-40-65-2
Reference 3: http://www.xbrl.org/2003/role/disclosureRef
-Topic 944
-SubTopic 40
-Name Accounting Standards Codification
-Section 65
-Paragraph 2
-Subparagraph (h)(2)
-Publisher FASB
-URI https://asc.fasb.org//1943274/2147480016/944-40-65-2
Reference 4: http://www.xbrl.org/2003/role/disclosureRef
-Topic 946
-SubTopic 20
-Name Accounting Standards Codification
-Section 50
-Paragraph 11
-Publisher FASB
-URI https://asc.fasb.org//1943274/2147480990/946-20-50-11
Reference 5: http://www.xbrl.org/2003/role/disclosureRef
-Topic 944
-SubTopic 210
-Name Accounting Standards Codification
-Section S99
-Paragraph 1
-Subparagraph (SX 210.7-03(a)(23)(a)(4))
-Publisher FASB
-URI https://asc.fasb.org//1943274/2147479440/944-210-S99-1
Reference 6: http://www.xbrl.org/2003/role/disclosureRef
-Topic 946
-SubTopic 210
-Name Accounting Standards Codification
-Section S99
-Paragraph 1
-Subparagraph (SX 210.6-04(17))
-Publisher FASB
-URI https://asc.fasb.org//1943274/2147479617/946-210-S99-1
Reference 7: http://fasb.org/us-gaap/role/ref/legacyRef
-Topic 505
-SubTopic 10
-Name Accounting Standards Codification
-Section S99
-Paragraph 1
-Subparagraph (SX 210.3-04)
-Publisher FASB
-URI https://asc.fasb.org//1943274/2147480008/505-10-S99-1
Reference 8: http://fasb.org/us-gaap/role/ref/legacyRef
-Topic 210
-SubTopic 10
-Name Accounting Standards Codification
-Section S99
-Paragraph 1
-Subparagraph (SX 210.5-02(30)(a)(3))
-Publisher FASB
-URI https://asc.fasb.org//1943274/2147480566/210-10-S99-1
| Name: |
us-gaap_RetainedEarningsAccumulatedDeficit |
| Namespace Prefix: |
us-gaap_ |
| Data Type: |
xbrli:monetaryItemType |
| Balance Type: |
credit |
| Period Type: |
instant |
|
| X |
- DefinitionAmount of equity (deficit) attributable to parent. Excludes temporary equity and equity attributable to noncontrolling interest. Reference 1: http://www.xbrl.org/2003/role/exampleRef
-Topic 852
-SubTopic 10
-Name Accounting Standards Codification
-Section 55
-Paragraph 10
-Publisher FASB
-URI https://asc.fasb.org//1943274/2147481372/852-10-55-10
Reference 2: http://www.xbrl.org/2003/role/exampleRef
-Topic 946
-SubTopic 830
-Name Accounting Standards Codification
-Section 55
-Paragraph 12
-Publisher FASB
-URI https://asc.fasb.org//1943274/2147480167/946-830-55-12
Reference 3: http://www.xbrl.org/2003/role/disclosureRef
-Topic 946
-SubTopic 210
-Name Accounting Standards Codification
-Section S99
-Paragraph 1
-Subparagraph (SX 210.6-04(19))
-Publisher FASB
-URI https://asc.fasb.org//1943274/2147479617/946-210-S99-1
Reference 4: http://www.xbrl.org/2003/role/disclosureRef
-Topic 946
-SubTopic 210
-Name Accounting Standards Codification
-Section S99
-Paragraph 2
-Subparagraph (SX 210.6-05(4))
-Publisher FASB
-URI https://asc.fasb.org//1943274/2147479617/946-210-S99-2
Reference 5: http://www.xbrl.org/2009/role/commonPracticeRef
-Topic 946
-SubTopic 220
-Name Accounting Standards Codification
-Section S99
-Paragraph 3
-Subparagraph (SX 210.6-09(4)(b))
-Publisher FASB
-URI https://asc.fasb.org//1943274/2147483575/946-220-S99-3
Reference 6: http://www.xbrl.org/2003/role/disclosureRef
-Topic 946
-SubTopic 220
-Name Accounting Standards Codification
-Section S99
-Paragraph 3
-Subparagraph (SX 210.6-09(6))
-Publisher FASB
-URI https://asc.fasb.org//1943274/2147483575/946-220-S99-3
Reference 7: http://www.xbrl.org/2003/role/disclosureRef
-Topic 946
-SubTopic 220
-Name Accounting Standards Codification
-Section S99
-Paragraph 3
-Subparagraph (SX 210.6-09(7))
-Publisher FASB
-URI https://asc.fasb.org//1943274/2147483575/946-220-S99-3
Reference 8: http://www.xbrl.org/2009/role/commonPracticeRef
-Topic 235
-SubTopic 10
-Name Accounting Standards Codification
-Section S99
-Paragraph 1
-Subparagraph (SX 210.4-08(g)(1)(ii))
-Publisher FASB
-URI https://asc.fasb.org//1943274/2147480678/235-10-S99-1
Reference 9: http://www.xbrl.org/2009/role/commonPracticeRef
-Topic 323
-SubTopic 10
-Name Accounting Standards Codification
-Section 50
-Paragraph 3
-Subparagraph (c)
-Publisher FASB
-URI https://asc.fasb.org//1943274/2147481687/323-10-50-3
Reference 10: http://www.xbrl.org/2009/role/commonPracticeRef
-Topic 825
-SubTopic 10
-Name Accounting Standards Codification
-Section 50
-Paragraph 28
-Subparagraph (f)
-Publisher FASB
-URI https://asc.fasb.org//1943274/2147482907/825-10-50-28
Reference 11: http://fasb.org/us-gaap/role/ref/legacyRef
-Topic 210
-SubTopic 10
-Name Accounting Standards Codification
-Section S99
-Paragraph 1
-Subparagraph (SX 210.5-02(29))
-Publisher FASB
-URI https://asc.fasb.org//1943274/2147480566/210-10-S99-1
Reference 12: http://fasb.org/us-gaap/role/ref/legacyRef
-Topic 210
-SubTopic 10
-Name Accounting Standards Codification
-Section S99
-Paragraph 1
-Subparagraph (SX 210.5-02(31))
-Publisher FASB
-URI https://asc.fasb.org//1943274/2147480566/210-10-S99-1
Reference 13: http://fasb.org/us-gaap/role/ref/legacyRef
-Topic 210
-SubTopic 10
-Name Accounting Standards Codification
-Section S99
-Paragraph 1
-Subparagraph (SX 210.5-02(30))
-Publisher FASB
-URI https://asc.fasb.org//1943274/2147480566/210-10-S99-1
Reference 14: http://fasb.org/us-gaap/role/ref/legacyRef
-Topic 310
-SubTopic 10
-Name Accounting Standards Codification
-Section S99
-Paragraph 2
-Subparagraph (SAB Topic 4.E)
-Publisher FASB
-URI https://asc.fasb.org//1943274/2147480418/310-10-S99-2
| Name: |
us-gaap_StockholdersEquity |
| Namespace Prefix: |
us-gaap_ |
| Data Type: |
xbrli:monetaryItemType |
| Balance Type: |
credit |
| Period Type: |
instant |
|
| X |
- References
+ Details
| Name: |
us-gaap_StockholdersEquityAbstract |
| Namespace Prefix: |
us-gaap_ |
| Data Type: |
xbrli:stringItemType |
| Balance Type: |
na |
| Period Type: |
duration |
|
v3.23.3
Consolidated Balance Sheets (Parenthetical) - $ / shares
|
Jul. 31, 2023 |
Jul. 31, 2022 |
| Statement of Financial Position [Abstract] |
|
|
| Preferred stock, par value |
$ 0.0001
|
$ 0.0001
|
| Preferred stock, shares authorized |
200,000,000
|
200,000,000
|
| Preferred stock, shares issued |
0
|
0
|
| Preferred stock, shares outstanding |
0
|
0
|
| Common stock, par value |
$ 0.0001
|
$ 0.0001
|
| Common stock, shares authorized |
600,000,000
|
600,000,000
|
| Common stock, shares issued |
59,434,838
|
59,434,838
|
| Common stock, shares outstanding |
59,434,838
|
59,434,838
|
| X |
- DefinitionFace amount or stated value per share of common stock. Reference 1: http://fasb.org/us-gaap/role/ref/legacyRef
-Topic 210
-SubTopic 10
-Name Accounting Standards Codification
-Section S99
-Paragraph 1
-Subparagraph (SX 210.5-02(29))
-Publisher FASB
-URI https://asc.fasb.org//1943274/2147480566/210-10-S99-1
| Name: |
us-gaap_CommonStockParOrStatedValuePerShare |
| Namespace Prefix: |
us-gaap_ |
| Data Type: |
dtr-types:perShareItemType |
| Balance Type: |
na |
| Period Type: |
instant |
|
| X |
- DefinitionThe maximum number of common shares permitted to be issued by an entity's charter and bylaws. Reference 1: http://www.xbrl.org/2003/role/disclosureRef
-Topic 946
-SubTopic 210
-Name Accounting Standards Codification
-Section S99
-Paragraph 1
-Subparagraph (SX 210.6-04(16)(a))
-Publisher FASB
-URI https://asc.fasb.org//1943274/2147479617/946-210-S99-1
Reference 2: http://fasb.org/us-gaap/role/ref/legacyRef
-Topic 210
-SubTopic 10
-Name Accounting Standards Codification
-Section S99
-Paragraph 1
-Subparagraph (SX 210.5-02(29))
-Publisher FASB
-URI https://asc.fasb.org//1943274/2147480566/210-10-S99-1
| Name: |
us-gaap_CommonStockSharesAuthorized |
| Namespace Prefix: |
us-gaap_ |
| Data Type: |
xbrli:sharesItemType |
| Balance Type: |
na |
| Period Type: |
instant |
|
| X |
- DefinitionTotal number of common shares of an entity that have been sold or granted to shareholders (includes common shares that were issued, repurchased and remain in the treasury). These shares represent capital invested by the firm's shareholders and owners, and may be all or only a portion of the number of shares authorized. Shares issued include shares outstanding and shares held in the treasury. Reference 1: http://fasb.org/us-gaap/role/ref/legacyRef
-Topic 210
-SubTopic 10
-Name Accounting Standards Codification
-Section S99
-Paragraph 1
-Subparagraph (SX 210.5-02(29))
-Publisher FASB
-URI https://asc.fasb.org//1943274/2147480566/210-10-S99-1
| Name: |
us-gaap_CommonStockSharesIssued |
| Namespace Prefix: |
us-gaap_ |
| Data Type: |
xbrli:sharesItemType |
| Balance Type: |
na |
| Period Type: |
instant |
|
| X |
- DefinitionNumber of shares of common stock outstanding. Common stock represent the ownership interest in a corporation. Reference 1: http://fasb.org/us-gaap/role/ref/legacyRef
-Name Accounting Standards Codification
-Section 50
-Paragraph 2
-SubTopic 10
-Topic 505
-Publisher FASB
-URI https://asc.fasb.org//1943274/2147481112/505-10-50-2
Reference 2: http://www.xbrl.org/2003/role/disclosureRef
-Topic 946
-SubTopic 210
-Name Accounting Standards Codification
-Section S99
-Paragraph 2
-Subparagraph (SX 210.6-05(4))
-Publisher FASB
-URI https://asc.fasb.org//1943274/2147479617/946-210-S99-2
Reference 3: http://www.xbrl.org/2009/role/commonPracticeRef
-Topic 946
-SubTopic 220
-Name Accounting Standards Codification
-Section S99
-Paragraph 3
-Subparagraph (SX 210.6-09(4)(b))
-Publisher FASB
-URI https://asc.fasb.org//1943274/2147483575/946-220-S99-3
Reference 4: http://www.xbrl.org/2003/role/disclosureRef
-Topic 946
-SubTopic 210
-Name Accounting Standards Codification
-Section S99
-Paragraph 1
-Subparagraph (SX 210.6-04(16)(a))
-Publisher FASB
-URI https://asc.fasb.org//1943274/2147479617/946-210-S99-1
Reference 5: http://www.xbrl.org/2009/role/commonPracticeRef
-Topic 946
-SubTopic 220
-Name Accounting Standards Codification
-Section S99
-Paragraph 3
-Subparagraph (SX 210.6-09(7))
-Publisher FASB
-URI https://asc.fasb.org//1943274/2147483575/946-220-S99-3
Reference 6: http://fasb.org/us-gaap/role/ref/legacyRef
-Topic 210
-SubTopic 10
-Name Accounting Standards Codification
-Section S99
-Paragraph 1
-Subparagraph (SX 210.5-02(29))
-Publisher FASB
-URI https://asc.fasb.org//1943274/2147480566/210-10-S99-1
| Name: |
us-gaap_CommonStockSharesOutstanding |
| Namespace Prefix: |
us-gaap_ |
| Data Type: |
xbrli:sharesItemType |
| Balance Type: |
na |
| Period Type: |
instant |
|
| X |
- DefinitionFace amount or stated value per share of preferred stock nonredeemable or redeemable solely at the option of the issuer. Reference 1: http://www.xbrl.org/2003/role/disclosureRef
-Topic 505
-SubTopic 10
-Name Accounting Standards Codification
-Section 50
-Paragraph 13
-Subparagraph (a)
-Publisher FASB
-URI https://asc.fasb.org//1943274/2147481112/505-10-50-13
Reference 2: http://fasb.org/us-gaap/role/ref/legacyRef
-Topic 210
-SubTopic 10
-Name Accounting Standards Codification
-Section S99
-Paragraph 1
-Subparagraph (SX 210.5-02(28))
-Publisher FASB
-URI https://asc.fasb.org//1943274/2147480566/210-10-S99-1
| Name: |
us-gaap_PreferredStockParOrStatedValuePerShare |
| Namespace Prefix: |
us-gaap_ |
| Data Type: |
dtr-types:perShareItemType |
| Balance Type: |
na |
| Period Type: |
instant |
|
| X |
- DefinitionThe maximum number of nonredeemable preferred shares (or preferred stock redeemable solely at the option of the issuer) permitted to be issued by an entity's charter and bylaws. Reference 1: http://www.xbrl.org/2003/role/disclosureRef
-Topic 946
-SubTopic 210
-Name Accounting Standards Codification
-Section S99
-Paragraph 1
-Subparagraph (SX 210.6-04(16)(a))
-Publisher FASB
-URI https://asc.fasb.org//1943274/2147479617/946-210-S99-1
Reference 2: http://fasb.org/us-gaap/role/ref/legacyRef
-Topic 210
-SubTopic 10
-Name Accounting Standards Codification
-Section S99
-Paragraph 1
-Subparagraph (SX 210.5-02(28))
-Publisher FASB
-URI https://asc.fasb.org//1943274/2147480566/210-10-S99-1
| Name: |
us-gaap_PreferredStockSharesAuthorized |
| Namespace Prefix: |
us-gaap_ |
| Data Type: |
xbrli:sharesItemType |
| Balance Type: |
na |
| Period Type: |
instant |
|
| X |
- DefinitionTotal number of nonredeemable preferred shares (or preferred stock redeemable solely at the option of the issuer) issued to shareholders (includes related preferred shares that were issued, repurchased, and remain in the treasury). May be all or portion of the number of preferred shares authorized. Excludes preferred shares that are classified as debt. Reference 1: http://www.xbrl.org/2003/role/disclosureRef
-Topic 505
-SubTopic 10
-Name Accounting Standards Codification
-Section 50
-Paragraph 13
-Subparagraph (a)
-Publisher FASB
-URI https://asc.fasb.org//1943274/2147481112/505-10-50-13
Reference 2: http://fasb.org/us-gaap/role/ref/legacyRef
-Topic 210
-SubTopic 10
-Name Accounting Standards Codification
-Section S99
-Paragraph 1
-Subparagraph (SX 210.5-02(28))
-Publisher FASB
-URI https://asc.fasb.org//1943274/2147480566/210-10-S99-1
| Name: |
us-gaap_PreferredStockSharesIssued |
| Namespace Prefix: |
us-gaap_ |
| Data Type: |
xbrli:sharesItemType |
| Balance Type: |
na |
| Period Type: |
instant |
|
| X |
- DefinitionAggregate share number for all nonredeemable preferred stock (or preferred stock redeemable solely at the option of the issuer) held by stockholders. Does not include preferred shares that have been repurchased. Reference 1: http://www.xbrl.org/2003/role/disclosureRef
-Topic 946
-SubTopic 210
-Name Accounting Standards Codification
-Section S99
-Paragraph 2
-Subparagraph (SX 210.6-05(4))
-Publisher FASB
-URI https://asc.fasb.org//1943274/2147479617/946-210-S99-2
Reference 2: http://www.xbrl.org/2009/role/commonPracticeRef
-Topic 946
-SubTopic 220
-Name Accounting Standards Codification
-Section S99
-Paragraph 3
-Subparagraph (SX 210.6-09(4)(b))
-Publisher FASB
-URI https://asc.fasb.org//1943274/2147483575/946-220-S99-3
Reference 3: http://www.xbrl.org/2003/role/disclosureRef
-Topic 946
-SubTopic 210
-Name Accounting Standards Codification
-Section S99
-Paragraph 1
-Subparagraph (SX 210.6-04(16)(a))
-Publisher FASB
-URI https://asc.fasb.org//1943274/2147479617/946-210-S99-1
Reference 4: http://www.xbrl.org/2009/role/commonPracticeRef
-Topic 946
-SubTopic 220
-Name Accounting Standards Codification
-Section S99
-Paragraph 3
-Subparagraph (SX 210.6-09(7))
-Publisher FASB
-URI https://asc.fasb.org//1943274/2147483575/946-220-S99-3
Reference 5: http://fasb.org/us-gaap/role/ref/legacyRef
-Topic 210
-SubTopic 10
-Name Accounting Standards Codification
-Section S99
-Paragraph 1
-Subparagraph (SX 210.5-02(28))
-Publisher FASB
-URI https://asc.fasb.org//1943274/2147480566/210-10-S99-1
| Name: |
us-gaap_PreferredStockSharesOutstanding |
| Namespace Prefix: |
us-gaap_ |
| Data Type: |
xbrli:sharesItemType |
| Balance Type: |
na |
| Period Type: |
instant |
|
| X |
- References
+ Details
| Name: |
us-gaap_StatementOfFinancialPositionAbstract |
| Namespace Prefix: |
us-gaap_ |
| Data Type: |
xbrli:stringItemType |
| Balance Type: |
na |
| Period Type: |
duration |
|
v3.23.3
Consolidated Statements of Operations and Comprehensive Loss - USD ($)
|
12 Months Ended |
Jul. 31, 2023 |
Jul. 31, 2022 |
| Income Statement [Abstract] |
|
|
| REVENUE |
$ 146,252
|
$ 46,702
|
| COST OF REVENUE |
(123,088)
|
(21,891)
|
| GROSS PROFIT |
23,164
|
24,811
|
| OTHER INCOME |
72,851
|
50,036
|
| SELLING AND MARKETING EXPENSES |
(1,531)
|
(3,470)
|
| GENERAL AND ADMINISTRATIVE EXPENSES |
(163,311)
|
(428,710)
|
| LOSS BEFORE INCOME TAX |
(68,827)
|
(357,333)
|
| INCOME TAXES PROVISION |
|
|
| NET LOSS |
(68,827)
|
(357,333)
|
| Other comprehensive loss: |
|
|
| - Foreign exchange translation gain |
17,405
|
14,876
|
| TOTAL COMPREHENSIVE LOSS |
$ (51,422)
|
$ (342,457)
|
| Net loss per share- Basic |
$ (0.0009)
|
$ (0.0058)
|
| Net loss per share- Diluted |
$ (0.0009)
|
$ (0.0058)
|
| Weighted average number of common shares outstanding - Basic |
59,434,838
|
59,434,838
|
| Weighted average number of common shares outstanding - Diluted |
59,434,838
|
59,434,838
|
| X |
- DefinitionAmount after tax of increase (decrease) in equity from transactions and other events and circumstances from net income and other comprehensive income, attributable to parent entity. Excludes changes in equity resulting from investments by owners and distributions to owners. Reference 1: http://www.xbrl.org/2003/role/disclosureRef
-Topic 220
-SubTopic 10
-Name Accounting Standards Codification
-Section S99
-Paragraph 2
-Subparagraph (SX 210.5-03(24))
-Publisher FASB
-URI https://asc.fasb.org//1943274/2147483621/220-10-S99-2
Reference 2: http://www.xbrl.org/2003/role/disclosureRef
-Topic 942
-SubTopic 220
-Name Accounting Standards Codification
-Section S99
-Paragraph 1
-Subparagraph (SX 210.9-04(26))
-Publisher FASB
-URI https://asc.fasb.org//1943274/2147483589/942-220-S99-1
Reference 3: http://www.xbrl.org/2003/role/disclosureRef
-Topic 944
-SubTopic 220
-Name Accounting Standards Codification
-Section S99
-Paragraph 1
-Subparagraph (SX 210.7-04(22))
-Publisher FASB
-URI https://asc.fasb.org//1943274/2147483586/944-220-S99-1
Reference 4: http://www.xbrl.org/2003/role/disclosureRef
-Topic 220
-SubTopic 10
-Name Accounting Standards Codification
-Section 45
-Paragraph 1A
-Subparagraph (c)
-Publisher FASB
-URI https://asc.fasb.org//1943274/2147482790/220-10-45-1A
Reference 5: http://www.xbrl.org/2003/role/disclosureRef
-Topic 220
-SubTopic 10
-Name Accounting Standards Codification
-Section 45
-Paragraph 1B
-Subparagraph (b)
-Publisher FASB
-URI https://asc.fasb.org//1943274/2147482790/220-10-45-1B
Reference 6: http://fasb.org/us-gaap/role/ref/legacyRef
-Name Accounting Standards Codification
-Topic 220
-SubTopic 10
-Section 45
-Paragraph 5
-Publisher FASB
-URI https://asc.fasb.org//1943274/2147482790/220-10-45-5
| Name: |
us-gaap_ComprehensiveIncomeNetOfTax |
| Namespace Prefix: |
us-gaap_ |
| Data Type: |
xbrli:monetaryItemType |
| Balance Type: |
credit |
| Period Type: |
duration |
|
| X |
- DefinitionThe aggregate cost of goods produced and sold and services rendered during the reporting period. Reference 1: http://www.xbrl.org/2003/role/disclosureRef
-Topic 235
-SubTopic 10
-Name Accounting Standards Codification
-Section S99
-Paragraph 1
-Subparagraph (SX 210.4-08(g)(1)(ii))
-Publisher FASB
-URI https://asc.fasb.org//1943274/2147480678/235-10-S99-1
Reference 2: http://www.xbrl.org/2003/role/disclosureRef
-Topic 323
-SubTopic 10
-Name Accounting Standards Codification
-Section 50
-Paragraph 3
-Subparagraph (c)
-Publisher FASB
-URI https://asc.fasb.org//1943274/2147481687/323-10-50-3
Reference 3: http://www.xbrl.org/2003/role/disclosureRef
-Topic 825
-SubTopic 10
-Name Accounting Standards Codification
-Section 50
-Paragraph 28
-Subparagraph (f)
-Publisher FASB
-URI https://asc.fasb.org//1943274/2147482907/825-10-50-28
Reference 4: http://www.xbrl.org/2003/role/disclosureRef
-Topic 470
-SubTopic 10
-Name Accounting Standards Codification
-Section S99
-Paragraph 1A
-Subparagraph (SX 210.13-01(a)(4)(i))
-Publisher FASB
-URI https://asc.fasb.org//1943274/2147480097/470-10-S99-1A
Reference 5: http://www.xbrl.org/2009/role/commonPracticeRef
-Topic 470
-SubTopic 10
-Name Accounting Standards Codification
-Section S99
-Paragraph 1A
-Subparagraph (SX 210.13-01(a)(4)(ii))
-Publisher FASB
-URI https://asc.fasb.org//1943274/2147480097/470-10-S99-1A
Reference 6: http://www.xbrl.org/2003/role/disclosureRef
-Topic 470
-SubTopic 10
-Name Accounting Standards Codification
-Section S99
-Paragraph 1A
-Subparagraph (SX 210.13-01(a)(4)(iii)(A))
-Publisher FASB
-URI https://asc.fasb.org//1943274/2147480097/470-10-S99-1A
Reference 7: http://www.xbrl.org/2003/role/disclosureRef
-Topic 470
-SubTopic 10
-Name Accounting Standards Codification
-Section S99
-Paragraph 1A
-Subparagraph (SX 210.13-01(a)(4)(iv))
-Publisher FASB
-URI https://asc.fasb.org//1943274/2147480097/470-10-S99-1A
Reference 8: http://www.xbrl.org/2003/role/disclosureRef
-Topic 470
-SubTopic 10
-Name Accounting Standards Codification
-Section S99
-Paragraph 1A
-Subparagraph (SX 210.13-01(a)(5))
-Publisher FASB
-URI https://asc.fasb.org//1943274/2147480097/470-10-S99-1A
Reference 9: http://www.xbrl.org/2003/role/disclosureRef
-Topic 470
-SubTopic 10
-Name Accounting Standards Codification
-Section S99
-Paragraph 1B
-Subparagraph (SX 210.13-02(a)(4)(i))
-Publisher FASB
-URI https://asc.fasb.org//1943274/2147480097/470-10-S99-1B
Reference 10: http://www.xbrl.org/2003/role/disclosureRef
-Topic 470
-SubTopic 10
-Name Accounting Standards Codification
-Section S99
-Paragraph 1B
-Subparagraph (SX 210.13-02(a)(4)(iii)(A))
-Publisher FASB
-URI https://asc.fasb.org//1943274/2147480097/470-10-S99-1B
Reference 11: http://www.xbrl.org/2003/role/disclosureRef
-Topic 470
-SubTopic 10
-Name Accounting Standards Codification
-Section S99
-Paragraph 1B
-Subparagraph (SX 210.13-02(a)(4)(iii)(B))
-Publisher FASB
-URI https://asc.fasb.org//1943274/2147480097/470-10-S99-1B
Reference 12: http://www.xbrl.org/2003/role/disclosureRef
-Topic 470
-SubTopic 10
-Name Accounting Standards Codification
-Section S99
-Paragraph 1B
-Subparagraph (SX 210.13-02(a)(4)(iv))
-Publisher FASB
-URI https://asc.fasb.org//1943274/2147480097/470-10-S99-1B
Reference 13: http://www.xbrl.org/2003/role/disclosureRef
-Topic 470
-SubTopic 10
-Name Accounting Standards Codification
-Section S99
-Paragraph 1B
-Subparagraph (SX 210.13-02(a)(5))
-Publisher FASB
-URI https://asc.fasb.org//1943274/2147480097/470-10-S99-1B
Reference 14: http://fasb.org/us-gaap/role/ref/legacyRef
-Topic 220
-SubTopic 10
-Name Accounting Standards Codification
-Section S99
-Paragraph 2
-Subparagraph (SX 210.5-03.2)
-Publisher FASB
-URI https://asc.fasb.org//1943274/2147483621/220-10-S99-2
| Name: |
us-gaap_CostOfRevenue |
| Namespace Prefix: |
us-gaap_ |
| Data Type: |
xbrli:monetaryItemType |
| Balance Type: |
debit |
| Period Type: |
duration |
|
| X |
- DefinitionThe amount of net income (loss) for the period per each share of common stock or unit outstanding during the reporting period. Reference 1: http://www.xbrl.org/2003/role/disclosureRef
-Topic 250
-SubTopic 10
-Name Accounting Standards Codification
-Section 50
-Paragraph 3
-Publisher FASB
-URI https://asc.fasb.org//1943274/2147483443/250-10-50-3
Reference 2: http://www.xbrl.org/2003/role/disclosureRef
-Topic 260
-SubTopic 10
-Name Accounting Standards Codification
-Section 55
-Paragraph 15
-Publisher FASB
-URI https://asc.fasb.org//1943274/2147482635/260-10-55-15
Reference 3: http://www.xbrl.org/2003/role/disclosureRef
-Topic 815
-SubTopic 40
-Name Accounting Standards Codification
-Section 65
-Paragraph 1
-Subparagraph (e)(4)
-Publisher FASB
-URI https://asc.fasb.org//1943274/2147480175/815-40-65-1
Reference 4: http://www.xbrl.org/2003/role/disclosureRef
-Topic 815
-SubTopic 40
-Name Accounting Standards Codification
-Section 65
-Paragraph 1
-Subparagraph (f)
-Publisher FASB
-URI https://asc.fasb.org//1943274/2147480175/815-40-65-1
Reference 5: http://www.xbrl.org/2003/role/disclosureRef
-Topic 250
-SubTopic 10
-Name Accounting Standards Codification
-Section 50
-Paragraph 11
-Subparagraph (a)
-Publisher FASB
-URI https://asc.fasb.org//1943274/2147483443/250-10-50-11
Reference 6: http://www.xbrl.org/2003/role/disclosureRef
-Topic 250
-SubTopic 10
-Name Accounting Standards Codification
-Section 50
-Paragraph 11
-Subparagraph (b)
-Publisher FASB
-URI https://asc.fasb.org//1943274/2147483443/250-10-50-11
Reference 7: http://www.xbrl.org/2003/role/disclosureRef
-Topic 250
-SubTopic 10
-Name Accounting Standards Codification
-Section 50
-Paragraph 7
-Subparagraph (a)
-Publisher FASB
-URI https://asc.fasb.org//1943274/2147483443/250-10-50-7
Reference 8: http://www.xbrl.org/2003/role/disclosureRef
-Topic 260
-SubTopic 10
-Name Accounting Standards Codification
-Section 45
-Paragraph 2
-Publisher FASB
-URI https://asc.fasb.org//1943274/2147482689/260-10-45-2
Reference 9: http://www.xbrl.org/2003/role/disclosureRef
-Topic 260
-SubTopic 10
-Name Accounting Standards Codification
-Section 45
-Paragraph 60B
-Subparagraph (d)
-Publisher FASB
-URI https://asc.fasb.org//1943274/2147482689/260-10-45-60B
Reference 10: http://www.xbrl.org/2003/role/disclosureRef
-Topic 250
-SubTopic 10
-Name Accounting Standards Codification
-Section 50
-Paragraph 4
-Publisher FASB
-URI https://asc.fasb.org//1943274/2147483443/250-10-50-4
Reference 11: http://www.xbrl.org/2003/role/disclosureRef
-Topic 260
-SubTopic 10
-Name Accounting Standards Codification
-Section 50
-Paragraph 1
-Subparagraph (a)
-Publisher FASB
-URI https://asc.fasb.org//1943274/2147482662/260-10-50-1
Reference 12: http://www.xbrl.org/2003/role/disclosureRef
-Topic 260
-SubTopic 10
-Name Accounting Standards Codification
-Section 45
-Paragraph 10
-Publisher FASB
-URI https://asc.fasb.org//1943274/2147482689/260-10-45-10
Reference 13: http://www.xbrl.org/2003/role/disclosureRef
-Topic 220
-SubTopic 10
-Name Accounting Standards Codification
-Section S99
-Paragraph 2
-Subparagraph (SX 210.5-03(25))
-Publisher FASB
-URI https://asc.fasb.org//1943274/2147483621/220-10-S99-2
Reference 14: http://www.xbrl.org/2003/role/disclosureRef
-Topic 942
-SubTopic 220
-Name Accounting Standards Codification
-Section S99
-Paragraph 1
-Subparagraph (SX 210.9-04(27))
-Publisher FASB
-URI https://asc.fasb.org//1943274/2147483589/942-220-S99-1
Reference 15: http://www.xbrl.org/2003/role/disclosureRef
-Topic 944
-SubTopic 220
-Name Accounting Standards Codification
-Section S99
-Paragraph 1
-Subparagraph (SX 210.7-04(23))
-Publisher FASB
-URI https://asc.fasb.org//1943274/2147483586/944-220-S99-1
Reference 16: http://www.xbrl.org/2003/role/exampleRef
-Topic 260
-SubTopic 10
-Name Accounting Standards Codification
-Section 55
-Paragraph 52
-Publisher FASB
-URI https://asc.fasb.org//1943274/2147482635/260-10-55-52
Reference 17: http://www.xbrl.org/2003/role/disclosureRef
-Topic 260
-SubTopic 10
-Name Accounting Standards Codification
-Section 45
-Paragraph 7
-Publisher FASB
-URI https://asc.fasb.org//1943274/2147482689/260-10-45-7
| Name: |
us-gaap_EarningsPerShareBasic |
| Namespace Prefix: |
us-gaap_ |
| Data Type: |
dtr-types:perShareItemType |
| Balance Type: |
na |
| Period Type: |
duration |
|
| X |
- DefinitionThe amount of net income (loss) for the period available to each share of common stock or common unit outstanding during the reporting period and to each share or unit that would have been outstanding assuming the issuance of common shares or units for all dilutive potential common shares or units outstanding during the reporting period. Reference 1: http://www.xbrl.org/2003/role/disclosureRef
-Topic 250
-SubTopic 10
-Name Accounting Standards Codification
-Section 50
-Paragraph 3
-Publisher FASB
-URI https://asc.fasb.org//1943274/2147483443/250-10-50-3
Reference 2: http://www.xbrl.org/2003/role/disclosureRef
-Topic 260
-SubTopic 10
-Name Accounting Standards Codification
-Section 55
-Paragraph 15
-Publisher FASB
-URI https://asc.fasb.org//1943274/2147482635/260-10-55-15
Reference 3: http://www.xbrl.org/2003/role/disclosureRef
-Topic 815
-SubTopic 40
-Name Accounting Standards Codification
-Section 65
-Paragraph 1
-Subparagraph (e)(4)
-Publisher FASB
-URI https://asc.fasb.org//1943274/2147480175/815-40-65-1
Reference 4: http://www.xbrl.org/2003/role/disclosureRef
-Topic 815
-SubTopic 40
-Name Accounting Standards Codification
-Section 65
-Paragraph 1
-Subparagraph (f)
-Publisher FASB
-URI https://asc.fasb.org//1943274/2147480175/815-40-65-1
Reference 5: http://www.xbrl.org/2003/role/disclosureRef
-Topic 250
-SubTopic 10
-Name Accounting Standards Codification
-Section 50
-Paragraph 11
-Subparagraph (a)
-Publisher FASB
-URI https://asc.fasb.org//1943274/2147483443/250-10-50-11
Reference 6: http://www.xbrl.org/2003/role/disclosureRef
-Topic 250
-SubTopic 10
-Name Accounting Standards Codification
-Section 50
-Paragraph 11
-Subparagraph (b)
-Publisher FASB
-URI https://asc.fasb.org//1943274/2147483443/250-10-50-11
Reference 7: http://www.xbrl.org/2003/role/disclosureRef
-Topic 250
-SubTopic 10
-Name Accounting Standards Codification
-Section 50
-Paragraph 7
-Subparagraph (a)
-Publisher FASB
-URI https://asc.fasb.org//1943274/2147483443/250-10-50-7
Reference 8: http://www.xbrl.org/2003/role/disclosureRef
-Topic 260
-SubTopic 10
-Name Accounting Standards Codification
-Section 45
-Paragraph 2
-Publisher FASB
-URI https://asc.fasb.org//1943274/2147482689/260-10-45-2
Reference 9: http://www.xbrl.org/2003/role/disclosureRef
-Topic 260
-SubTopic 10
-Name Accounting Standards Codification
-Section 45
-Paragraph 60B
-Subparagraph (d)
-Publisher FASB
-URI https://asc.fasb.org//1943274/2147482689/260-10-45-60B
Reference 10: http://www.xbrl.org/2003/role/disclosureRef
-Topic 250
-SubTopic 10
-Name Accounting Standards Codification
-Section 50
-Paragraph 4
-Publisher FASB
-URI https://asc.fasb.org//1943274/2147483443/250-10-50-4
Reference 11: http://www.xbrl.org/2003/role/disclosureRef
-Topic 260
-SubTopic 10
-Name Accounting Standards Codification
-Section 50
-Paragraph 1
-Subparagraph (a)
-Publisher FASB
-URI https://asc.fasb.org//1943274/2147482662/260-10-50-1
Reference 12: http://www.xbrl.org/2003/role/disclosureRef
-Topic 220
-SubTopic 10
-Name Accounting Standards Codification
-Section S99
-Paragraph 2
-Subparagraph (SX 210.5-03(25))
-Publisher FASB
-URI https://asc.fasb.org//1943274/2147483621/220-10-S99-2
Reference 13: http://www.xbrl.org/2003/role/disclosureRef
-Topic 942
-SubTopic 220
-Name Accounting Standards Codification
-Section S99
-Paragraph 1
-Subparagraph (SX 210.9-04(27))
-Publisher FASB
-URI https://asc.fasb.org//1943274/2147483589/942-220-S99-1
Reference 14: http://www.xbrl.org/2003/role/disclosureRef
-Topic 944
-SubTopic 220
-Name Accounting Standards Codification
-Section S99
-Paragraph 1
-Subparagraph (SX 210.7-04(23))
-Publisher FASB
-URI https://asc.fasb.org//1943274/2147483586/944-220-S99-1
Reference 15: http://www.xbrl.org/2003/role/exampleRef
-Topic 260
-SubTopic 10
-Name Accounting Standards Codification
-Section 55
-Paragraph 52
-Publisher FASB
-URI https://asc.fasb.org//1943274/2147482635/260-10-55-52
Reference 16: http://www.xbrl.org/2003/role/disclosureRef
-Topic 260
-SubTopic 10
-Name Accounting Standards Codification
-Section 45
-Paragraph 7
-Publisher FASB
-URI https://asc.fasb.org//1943274/2147482689/260-10-45-7
| Name: |
us-gaap_EarningsPerShareDiluted |
| Namespace Prefix: |
us-gaap_ |
| Data Type: |
dtr-types:perShareItemType |
| Balance Type: |
na |
| Period Type: |
duration |
|
| X |
- DefinitionThe aggregate total of expenses of managing and administering the affairs of an entity, including affiliates of the reporting entity, which are not directly or indirectly associated with the manufacture, sale or creation of a product or product line. Reference 1: http://www.xbrl.org/2003/role/disclosureRef
-Topic 946
-SubTopic 220
-Name Accounting Standards Codification
-Section S99
-Paragraph 1
-Subparagraph (SX 210.6-07(2)(a))
-Publisher FASB
-URI https://asc.fasb.org//1943274/2147483575/946-220-S99-1
Reference 2: http://fasb.org/us-gaap/role/ref/legacyRef
-Topic 220
-SubTopic 10
-Name Accounting Standards Codification
-Section S99
-Paragraph 2
-Subparagraph (SX 210.5-03.4)
-Publisher FASB
-URI https://asc.fasb.org//1943274/2147483621/220-10-S99-2
| Name: |
us-gaap_GeneralAndAdministrativeExpense |
| Namespace Prefix: |
us-gaap_ |
| Data Type: |
xbrli:monetaryItemType |
| Balance Type: |
debit |
| Period Type: |
duration |
|
| X |
- DefinitionAggregate revenue less cost of goods and services sold or operating expenses directly attributable to the revenue generation activity. Reference 1: http://www.xbrl.org/2003/role/disclosureRef
-Topic 235
-SubTopic 10
-Name Accounting Standards Codification
-Section S99
-Paragraph 1
-Subparagraph (SX 210.4-08(g)(1)(ii))
-Publisher FASB
-URI https://asc.fasb.org//1943274/2147480678/235-10-S99-1
Reference 2: http://www.xbrl.org/2003/role/disclosureRef
-Topic 323
-SubTopic 10
-Name Accounting Standards Codification
-Section 50
-Paragraph 3
-Subparagraph (c)
-Publisher FASB
-URI https://asc.fasb.org//1943274/2147481687/323-10-50-3
Reference 3: http://www.xbrl.org/2003/role/disclosureRef
-Topic 825
-SubTopic 10
-Name Accounting Standards Codification
-Section 50
-Paragraph 28
-Subparagraph (f)
-Publisher FASB
-URI https://asc.fasb.org//1943274/2147482907/825-10-50-28
Reference 4: http://www.xbrl.org/2003/role/disclosureRef
-Topic 280
-SubTopic 10
-Name Accounting Standards Codification
-Section 50
-Paragraph 22
-Publisher FASB
-URI https://asc.fasb.org//1943274/2147482810/280-10-50-22
Reference 5: http://www.xbrl.org/2003/role/disclosureRef
-Topic 470
-SubTopic 10
-Name Accounting Standards Codification
-Section S99
-Paragraph 1A
-Subparagraph (SX 210.13-01(a)(4)(i))
-Publisher FASB
-URI https://asc.fasb.org//1943274/2147480097/470-10-S99-1A
Reference 6: http://www.xbrl.org/2009/role/commonPracticeRef
-Topic 470
-SubTopic 10
-Name Accounting Standards Codification
-Section S99
-Paragraph 1A
-Subparagraph (SX 210.13-01(a)(4)(ii))
-Publisher FASB
-URI https://asc.fasb.org//1943274/2147480097/470-10-S99-1A
Reference 7: http://www.xbrl.org/2003/role/disclosureRef
-Topic 470
-SubTopic 10
-Name Accounting Standards Codification
-Section S99
-Paragraph 1A
-Subparagraph (SX 210.13-01(a)(4)(iii)(A))
-Publisher FASB
-URI https://asc.fasb.org//1943274/2147480097/470-10-S99-1A
Reference 8: http://www.xbrl.org/2003/role/disclosureRef
-Topic 470
-SubTopic 10
-Name Accounting Standards Codification
-Section S99
-Paragraph 1A
-Subparagraph (SX 210.13-01(a)(4)(iv))
-Publisher FASB
-URI https://asc.fasb.org//1943274/2147480097/470-10-S99-1A
Reference 9: http://www.xbrl.org/2003/role/disclosureRef
-Topic 470
-SubTopic 10
-Name Accounting Standards Codification
-Section S99
-Paragraph 1A
-Subparagraph (SX 210.13-01(a)(5))
-Publisher FASB
-URI https://asc.fasb.org//1943274/2147480097/470-10-S99-1A
Reference 10: http://www.xbrl.org/2003/role/disclosureRef
-Topic 470
-SubTopic 10
-Name Accounting Standards Codification
-Section S99
-Paragraph 1B
-Subparagraph (SX 210.13-02(a)(4)(i))
-Publisher FASB
-URI https://asc.fasb.org//1943274/2147480097/470-10-S99-1B
Reference 11: http://www.xbrl.org/2003/role/disclosureRef
-Topic 470
-SubTopic 10
-Name Accounting Standards Codification
-Section S99
-Paragraph 1B
-Subparagraph (SX 210.13-02(a)(4)(iii)(A))
-Publisher FASB
-URI https://asc.fasb.org//1943274/2147480097/470-10-S99-1B
Reference 12: http://www.xbrl.org/2003/role/disclosureRef
-Topic 470
-SubTopic 10
-Name Accounting Standards Codification
-Section S99
-Paragraph 1B
-Subparagraph (SX 210.13-02(a)(4)(iii)(B))
-Publisher FASB
-URI https://asc.fasb.org//1943274/2147480097/470-10-S99-1B
Reference 13: http://www.xbrl.org/2003/role/disclosureRef
-Topic 470
-SubTopic 10
-Name Accounting Standards Codification
-Section S99
-Paragraph 1B
-Subparagraph (SX 210.13-02(a)(4)(iv))
-Publisher FASB
-URI https://asc.fasb.org//1943274/2147480097/470-10-S99-1B
Reference 14: http://www.xbrl.org/2003/role/disclosureRef
-Topic 470
-SubTopic 10
-Name Accounting Standards Codification
-Section S99
-Paragraph 1B
-Subparagraph (SX 210.13-02(a)(5))
-Publisher FASB
-URI https://asc.fasb.org//1943274/2147480097/470-10-S99-1B
Reference 15: http://www.xbrl.org/2003/role/disclosureRef
-Topic 280
-SubTopic 10
-Name Accounting Standards Codification
-Section 50
-Paragraph 30
-Subparagraph (b)
-Publisher FASB
-URI https://asc.fasb.org//1943274/2147482810/280-10-50-30
Reference 16: http://www.xbrl.org/2003/role/disclosureRef
-Topic 280
-SubTopic 10
-Name Accounting Standards Codification
-Section 50
-Paragraph 32
-Subparagraph (f)
-Publisher FASB
-URI https://asc.fasb.org//1943274/2147482810/280-10-50-32
Reference 17: http://www.xbrl.org/2003/role/exampleRef
-Topic 280
-SubTopic 10
-Name Accounting Standards Codification
-Section 50
-Paragraph 31
-Publisher FASB
-URI https://asc.fasb.org//1943274/2147482810/280-10-50-31
Reference 18: http://www.xbrl.org/2003/role/disclosureRef
-Topic 280
-SubTopic 10
-Name Accounting Standards Codification
-Section 50
-Paragraph 32
-Subparagraph (c)
-Publisher FASB
-URI https://asc.fasb.org//1943274/2147482810/280-10-50-32
Reference 19: http://fasb.org/us-gaap/role/ref/legacyRef
-Topic 220
-SubTopic 10
-Name Accounting Standards Codification
-Section S99
-Paragraph 2
-Subparagraph (SX 210.5-03.1,2)
-Publisher FASB
-URI https://asc.fasb.org//1943274/2147483621/220-10-S99-2
| Name: |
us-gaap_GrossProfit |
| Namespace Prefix: |
us-gaap_ |
| Data Type: |
xbrli:monetaryItemType |
| Balance Type: |
credit |
| Period Type: |
duration |
|
| X |
- References
+ Details
| Name: |
us-gaap_IncomeStatementAbstract |
| Namespace Prefix: |
us-gaap_ |
| Data Type: |
xbrli:stringItemType |
| Balance Type: |
na |
| Period Type: |
duration |
|
| X |
- DefinitionThe portion of profit or loss for the period, net of income taxes, which is attributable to the parent. Reference 1: http://www.xbrl.org/2003/role/disclosureRef
-Topic 235
-SubTopic 10
-Name Accounting Standards Codification
-Section S99
-Paragraph 1
-Subparagraph (SX 210.4-08(g)(1)(ii))
-Publisher FASB
-URI https://asc.fasb.org//1943274/2147480678/235-10-S99-1
Reference 2: http://www.xbrl.org/2003/role/disclosureRef
-Topic 323
-SubTopic 10
-Name Accounting Standards Codification
-Section 50
-Paragraph 3
-Subparagraph (c)
-Publisher FASB
-URI https://asc.fasb.org//1943274/2147481687/323-10-50-3
Reference 3: http://www.xbrl.org/2003/role/disclosureRef
-Topic 825
-SubTopic 10
-Name Accounting Standards Codification
-Section 50
-Paragraph 28
-Subparagraph (f)
-Publisher FASB
-URI https://asc.fasb.org//1943274/2147482907/825-10-50-28
Reference 4: http://www.xbrl.org/2003/role/disclosureRef
-Topic 220
-SubTopic 10
-Name Accounting Standards Codification
-Section 50
-Paragraph 6
-Publisher FASB
-URI https://asc.fasb.org//1943274/2147482765/220-10-50-6
Reference 5: http://www.xbrl.org/2003/role/disclosureRef
-Topic 250
-SubTopic 10
-Name Accounting Standards Codification
-Section 50
-Paragraph 3
-Publisher FASB
-URI https://asc.fasb.org//1943274/2147483443/250-10-50-3
Reference 6: http://www.xbrl.org/2003/role/disclosureRef
-Topic 250
-SubTopic 10
-Name Accounting Standards Codification
-Section 50
-Paragraph 1
-Subparagraph (b)(2)
-Publisher FASB
-URI https://asc.fasb.org//1943274/2147483443/250-10-50-1
Reference 7: http://www.xbrl.org/2003/role/disclosureRef
-Topic 815
-SubTopic 40
-Name Accounting Standards Codification
-Section 65
-Paragraph 1
-Subparagraph (f)
-Publisher FASB
-URI https://asc.fasb.org//1943274/2147480175/815-40-65-1
Reference 8: http://www.xbrl.org/2003/role/disclosureRef
-Topic 250
-SubTopic 10
-Name Accounting Standards Codification
-Section 50
-Paragraph 8
-Publisher FASB
-URI https://asc.fasb.org//1943274/2147483443/250-10-50-8
Reference 9: http://www.xbrl.org/2003/role/disclosureRef
-Topic 250
-SubTopic 10
-Name Accounting Standards Codification
-Section 50
-Paragraph 9
-Publisher FASB
-URI https://asc.fasb.org//1943274/2147483443/250-10-50-9
Reference 10: http://www.xbrl.org/2003/role/disclosureRef
-Topic 250
-SubTopic 10
-Name Accounting Standards Codification
-Section 50
-Paragraph 11
-Subparagraph (a)
-Publisher FASB
-URI https://asc.fasb.org//1943274/2147483443/250-10-50-11
Reference 11: http://www.xbrl.org/2003/role/disclosureRef
-Topic 250
-SubTopic 10
-Name Accounting Standards Codification
-Section 50
-Paragraph 11
-Subparagraph (b)
-Publisher FASB
-URI https://asc.fasb.org//1943274/2147483443/250-10-50-11
Reference 12: http://www.xbrl.org/2003/role/disclosureRef
-Topic 250
-SubTopic 10
-Name Accounting Standards Codification
-Section 50
-Paragraph 4
-Publisher FASB
-URI https://asc.fasb.org//1943274/2147483443/250-10-50-4
Reference 13: http://www.xbrl.org/2003/role/exampleRef
-Topic 946
-SubTopic 830
-Name Accounting Standards Codification
-Section 55
-Paragraph 10
-Publisher FASB
-URI https://asc.fasb.org//1943274/2147480167/946-830-55-10
Reference 14: http://www.xbrl.org/2003/role/disclosureRef
-Topic 946
-SubTopic 220
-Name Accounting Standards Codification
-Section 45
-Paragraph 7
-Publisher FASB
-URI https://asc.fasb.org//1943274/2147483581/946-220-45-7
Reference 15: http://www.xbrl.org/2003/role/disclosureRef
-Topic 944
-SubTopic 220
-Name Accounting Standards Codification
-Section S99
-Paragraph 1
-Subparagraph (SX 210.7-04(18))
-Publisher FASB
-URI https://asc.fasb.org//1943274/2147483586/944-220-S99-1
Reference 16: http://www.xbrl.org/2003/role/disclosureRef
-Topic 280
-SubTopic 10
-Name Accounting Standards Codification
-Section 50
-Paragraph 22
-Publisher FASB
-URI https://asc.fasb.org//1943274/2147482810/280-10-50-22
Reference 17: http://www.xbrl.org/2003/role/disclosureRef
-Topic 946
-SubTopic 220
-Name Accounting Standards Codification
-Section S99
-Paragraph 1
-Subparagraph (SX 210.6-07(9))
-Publisher FASB
-URI https://asc.fasb.org//1943274/2147483575/946-220-S99-1
Reference 18: http://www.xbrl.org/2003/role/disclosureRef
-Topic 946
-SubTopic 220
-Name Accounting Standards Codification
-Section S99
-Paragraph 3
-Subparagraph (SX 210.6-09(1)(d))
-Publisher FASB
-URI https://asc.fasb.org//1943274/2147483575/946-220-S99-3
Reference 19: http://www.xbrl.org/2003/role/disclosureRef
-Topic 470
-SubTopic 10
-Name Accounting Standards Codification
-Section S99
-Paragraph 1A
-Subparagraph (SX 210.13-01(a)(4)(i))
-Publisher FASB
-URI https://asc.fasb.org//1943274/2147480097/470-10-S99-1A
Reference 20: http://www.xbrl.org/2009/role/commonPracticeRef
-Topic 470
-SubTopic 10
-Name Accounting Standards Codification
-Section S99
-Paragraph 1A
-Subparagraph (SX 210.13-01(a)(4)(ii))
-Publisher FASB
-URI https://asc.fasb.org//1943274/2147480097/470-10-S99-1A
Reference 21: http://www.xbrl.org/2003/role/disclosureRef
-Topic 470
-SubTopic 10
-Name Accounting Standards Codification
-Section S99
-Paragraph 1A
-Subparagraph (SX 210.13-01(a)(4)(iii)(A))
-Publisher FASB
-URI https://asc.fasb.org//1943274/2147480097/470-10-S99-1A
Reference 22: http://www.xbrl.org/2003/role/disclosureRef
-Topic 470
-SubTopic 10
-Name Accounting Standards Codification
-Section S99
-Paragraph 1A
-Subparagraph (SX 210.13-01(a)(4)(iv))
-Publisher FASB
-URI https://asc.fasb.org//1943274/2147480097/470-10-S99-1A
Reference 23: http://www.xbrl.org/2003/role/disclosureRef
-Topic 470
-SubTopic 10
-Name Accounting Standards Codification
-Section S99
-Paragraph 1A
-Subparagraph (SX 210.13-01(a)(5))
-Publisher FASB
-URI https://asc.fasb.org//1943274/2147480097/470-10-S99-1A
Reference 24: http://www.xbrl.org/2003/role/disclosureRef
-Topic 470
-SubTopic 10
-Name Accounting Standards Codification
-Section S99
-Paragraph 1B
-Subparagraph (SX 210.13-02(a)(4)(i))
-Publisher FASB
-URI https://asc.fasb.org//1943274/2147480097/470-10-S99-1B
Reference 25: http://www.xbrl.org/2003/role/disclosureRef
-Topic 470
-SubTopic 10
-Name Accounting Standards Codification
-Section S99
-Paragraph 1B
-Subparagraph (SX 210.13-02(a)(4)(iii)(A))
-Publisher FASB
-URI https://asc.fasb.org//1943274/2147480097/470-10-S99-1B
Reference 26: http://www.xbrl.org/2003/role/disclosureRef
-Topic 470
-SubTopic 10
-Name Accounting Standards Codification
-Section S99
-Paragraph 1B
-Subparagraph (SX 210.13-02(a)(4)(iii)(B))
-Publisher FASB
-URI https://asc.fasb.org//1943274/2147480097/470-10-S99-1B
Reference 27: http://www.xbrl.org/2003/role/disclosureRef
-Topic 470
-SubTopic 10
-Name Accounting Standards Codification
-Section S99
-Paragraph 1B
-Subparagraph (SX 210.13-02(a)(4)(iv))
-Publisher FASB
-URI https://asc.fasb.org//1943274/2147480097/470-10-S99-1B
Reference 28: http://www.xbrl.org/2003/role/disclosureRef
-Topic 470
-SubTopic 10
-Name Accounting Standards Codification
-Section S99
-Paragraph 1B
-Subparagraph (SX 210.13-02(a)(5))
-Publisher FASB
-URI https://asc.fasb.org//1943274/2147480097/470-10-S99-1B
Reference 29: http://www.xbrl.org/2003/role/disclosureRef
-Topic 280
-SubTopic 10
-Name Accounting Standards Codification
-Section 50
-Paragraph 30
-Subparagraph (b)
-Publisher FASB
-URI https://asc.fasb.org//1943274/2147482810/280-10-50-30
Reference 30: http://www.xbrl.org/2003/role/disclosureRef
-Topic 280
-SubTopic 10
-Name Accounting Standards Codification
-Section 50
-Paragraph 32
-Subparagraph (f)
-Publisher FASB
-URI https://asc.fasb.org//1943274/2147482810/280-10-50-32
Reference 31: http://www.xbrl.org/2003/role/disclosureRef
-Topic 260
-SubTopic 10
-Name Accounting Standards Codification
-Section 45
-Paragraph 60B
-Subparagraph (a)
-Publisher FASB
-URI https://asc.fasb.org//1943274/2147482689/260-10-45-60B
Reference 32: http://www.xbrl.org/2003/role/exampleRef
-Topic 280
-SubTopic 10
-Name Accounting Standards Codification
-Section 50
-Paragraph 31
-Publisher FASB
-URI https://asc.fasb.org//1943274/2147482810/280-10-50-31
Reference 33: http://www.xbrl.org/2003/role/disclosureRef
-Topic 280
-SubTopic 10
-Name Accounting Standards Codification
-Section 50
-Paragraph 32
-Subparagraph (c)
-Publisher FASB
-URI https://asc.fasb.org//1943274/2147482810/280-10-50-32
Reference 34: http://www.xbrl.org/2003/role/disclosureRef
-Topic 205
-SubTopic 20
-Name Accounting Standards Codification
-Section 50
-Paragraph 7
-Publisher FASB
-URI https://asc.fasb.org//1943274/2147483499/205-20-50-7
Reference 35: http://fasb.org/us-gaap/role/ref/legacyRef
-Topic 230
-SubTopic 10
-Name Accounting Standards Codification
-Section 45
-Paragraph 28
-Publisher FASB
-URI https://asc.fasb.org//1943274/2147482740/230-10-45-28
Reference 36: http://www.xbrl.org/2003/role/disclosureRef
-Topic 220
-SubTopic 10
-Name Accounting Standards Codification
-Section 45
-Paragraph 1A
-Subparagraph (a)
-Publisher FASB
-URI https://asc.fasb.org//1943274/2147482790/220-10-45-1A
Reference 37: http://www.xbrl.org/2003/role/disclosureRef
-Topic 220
-SubTopic 10
-Name Accounting Standards Codification
-Section 45
-Paragraph 1B
-Subparagraph (a)
-Publisher FASB
-URI https://asc.fasb.org//1943274/2147482790/220-10-45-1B
Reference 38: http://fasb.org/us-gaap/role/ref/legacyRef
-Topic 220
-SubTopic 10
-Name Accounting Standards Codification
-Section S99
-Paragraph 2
-Subparagraph (SX 210.5-03(20))
-Publisher FASB
-URI https://asc.fasb.org//1943274/2147483621/220-10-S99-2
Reference 39: http://fasb.org/us-gaap/role/ref/legacyRef
-Topic 942
-SubTopic 220
-Name Accounting Standards Codification
-Section S99
-Paragraph 1
-Subparagraph (SX 210.9-04(22))
-Publisher FASB
-URI https://asc.fasb.org//1943274/2147483589/942-220-S99-1
| Name: |
us-gaap_NetIncomeLoss |
| Namespace Prefix: |
us-gaap_ |
| Data Type: |
xbrli:monetaryItemType |
| Balance Type: |
credit |
| Period Type: |
duration |
|
| X |
- DefinitionAmount after tax and reclassification adjustments of gain (loss) on foreign currency translation adjustments, foreign currency transactions designated and effective as economic hedges of a net investment in a foreign entity and intra-entity foreign currency transactions that are of a long-term-investment nature. Reference 1: http://fasb.org/us-gaap/role/ref/legacyRef
-Name Accounting Standards Codification
-Section 45
-Paragraph 10A
-Subparagraph (a)
-SubTopic 10
-Topic 220
-Publisher FASB
-URI https://asc.fasb.org//1943274/2147482790/220-10-45-10A
| Name: |
us-gaap_OtherComprehensiveIncomeLossForeignCurrencyTransactionAndTranslationAdjustmentNetOfTax |
| Namespace Prefix: |
us-gaap_ |
| Data Type: |
xbrli:monetaryItemType |
| Balance Type: |
credit |
| Period Type: |
duration |
|
| X |
- References
+ Details
| Name: |
us-gaap_OtherComprehensiveIncomeLossNetOfTaxPortionAttributableToParentAbstract |
| Namespace Prefix: |
us-gaap_ |
| Data Type: |
xbrli:stringItemType |
| Balance Type: |
na |
| Period Type: |
duration |
|
| X |
- DefinitionAmount of income (expense) related to nonoperating activities, classified as other. Reference 1: http://fasb.org/us-gaap/role/ref/legacyRef
-Topic 220
-SubTopic 10
-Name Accounting Standards Codification
-Section S99
-Paragraph 2
-Subparagraph (SX 210.5-03.9)
-Publisher FASB
-URI https://asc.fasb.org//1943274/2147483621/220-10-S99-2
| Name: |
us-gaap_OtherNonoperatingIncomeExpense |
| Namespace Prefix: |
us-gaap_ |
| Data Type: |
xbrli:monetaryItemType |
| Balance Type: |
credit |
| Period Type: |
duration |
|
| X |
- DefinitionAmount, excluding tax collected from customer, of revenue from satisfaction of performance obligation by transferring promised good or service to customer. Tax collected from customer is tax assessed by governmental authority that is both imposed on and concurrent with specific revenue-producing transaction, including, but not limited to, sales, use, value added and excise. Reference 1: http://www.xbrl.org/2003/role/disclosureRef
-Topic 924
-SubTopic 10
-Name Accounting Standards Codification
-Section S99
-Paragraph 1
-Subparagraph (SAB Topic 11.L)
-Publisher FASB
-URI https://asc.fasb.org//1943274/2147479941/924-10-S99-1
Reference 2: http://www.xbrl.org/2003/role/disclosureRef
-Topic 606
-SubTopic 10
-Name Accounting Standards Codification
-Section 50
-Paragraph 5
-Publisher FASB
-URI https://asc.fasb.org//1943274/2147479806/606-10-50-5
Reference 3: http://www.xbrl.org/2003/role/disclosureRef
-Topic 280
-SubTopic 10
-Name Accounting Standards Codification
-Section 50
-Paragraph 30
-Subparagraph (a)
-Publisher FASB
-URI https://asc.fasb.org//1943274/2147482810/280-10-50-30
Reference 4: http://www.xbrl.org/2003/role/disclosureRef
-Topic 280
-SubTopic 10
-Name Accounting Standards Codification
-Section 50
-Paragraph 42
-Publisher FASB
-URI https://asc.fasb.org//1943274/2147482810/280-10-50-42
Reference 5: http://www.xbrl.org/2003/role/disclosureRef
-Topic 280
-SubTopic 10
-Name Accounting Standards Codification
-Section 50
-Paragraph 22
-Subparagraph (b)
-Publisher FASB
-URI https://asc.fasb.org//1943274/2147482810/280-10-50-22
Reference 6: http://www.xbrl.org/2003/role/disclosureRef
-Topic 280
-SubTopic 10
-Name Accounting Standards Codification
-Section 50
-Paragraph 32
-Subparagraph (b)
-Publisher FASB
-URI https://asc.fasb.org//1943274/2147482810/280-10-50-32
Reference 7: http://www.xbrl.org/2003/role/disclosureRef
-Topic 280
-SubTopic 10
-Name Accounting Standards Codification
-Section 50
-Paragraph 40
-Publisher FASB
-URI https://asc.fasb.org//1943274/2147482810/280-10-50-40
Reference 8: http://www.xbrl.org/2003/role/disclosureRef
-Topic 280
-SubTopic 10
-Name Accounting Standards Codification
-Section 50
-Paragraph 22
-Subparagraph (a)
-Publisher FASB
-URI https://asc.fasb.org//1943274/2147482810/280-10-50-22
Reference 9: http://www.xbrl.org/2003/role/disclosureRef
-Topic 280
-SubTopic 10
-Name Accounting Standards Codification
-Section 50
-Paragraph 32
-Subparagraph (a)
-Publisher FASB
-URI https://asc.fasb.org//1943274/2147482810/280-10-50-32
Reference 10: http://www.xbrl.org/2003/role/disclosureRef
-Topic 280
-SubTopic 10
-Name Accounting Standards Codification
-Section 50
-Paragraph 41
-Subparagraph (a)
-Publisher FASB
-URI https://asc.fasb.org//1943274/2147482810/280-10-50-41
Reference 11: http://www.xbrl.org/2003/role/disclosureRef
-Topic 606
-SubTopic 10
-Name Accounting Standards Codification
-Section 50
-Paragraph 4
-Subparagraph (a)
-Publisher FASB
-URI https://asc.fasb.org//1943274/2147479806/606-10-50-4
| Name: |
us-gaap_RevenueFromContractWithCustomerExcludingAssessedTax |
| Namespace Prefix: |
us-gaap_ |
| Data Type: |
xbrli:monetaryItemType |
| Balance Type: |
credit |
| Period Type: |
duration |
|
| X |
- DefinitionThe aggregate total amount of expenses directly related to the marketing or selling of products or services.
| Name: |
us-gaap_SellingAndMarketingExpense |
| Namespace Prefix: |
us-gaap_ |
| Data Type: |
xbrli:monetaryItemType |
| Balance Type: |
debit |
| Period Type: |
duration |
|
| X |
- DefinitionThe average number of shares or units issued and outstanding that are used in calculating diluted EPS or earnings per unit (EPU), determined based on the timing of issuance of shares or units in the period. Reference 1: http://www.xbrl.org/2003/role/disclosureRef
-Topic 260
-SubTopic 10
-Name Accounting Standards Codification
-Section 50
-Paragraph 1
-Subparagraph (a)
-Publisher FASB
-URI https://asc.fasb.org//1943274/2147482662/260-10-50-1
Reference 2: http://www.xbrl.org/2003/role/disclosureRef
-Topic 260
-SubTopic 10
-Name Accounting Standards Codification
-Section 45
-Paragraph 16
-Publisher FASB
-URI https://asc.fasb.org//1943274/2147482689/260-10-45-16
| Name: |
us-gaap_WeightedAverageNumberOfDilutedSharesOutstanding |
| Namespace Prefix: |
us-gaap_ |
| Data Type: |
xbrli:sharesItemType |
| Balance Type: |
na |
| Period Type: |
duration |
|
| X |
- DefinitionNumber of [basic] shares or units, after adjustment for contingently issuable shares or units and other shares or units not deemed outstanding, determined by relating the portion of time within a reporting period that common shares or units have been outstanding to the total time in that period. Reference 1: http://www.xbrl.org/2003/role/disclosureRef
-Topic 260
-SubTopic 10
-Name Accounting Standards Codification
-Section 50
-Paragraph 1
-Subparagraph (a)
-Publisher FASB
-URI https://asc.fasb.org//1943274/2147482662/260-10-50-1
Reference 2: http://www.xbrl.org/2003/role/disclosureRef
-Topic 260
-SubTopic 10
-Name Accounting Standards Codification
-Section 45
-Paragraph 10
-Publisher FASB
-URI https://asc.fasb.org//1943274/2147482689/260-10-45-10
| Name: |
us-gaap_WeightedAverageNumberOfSharesOutstandingBasic |
| Namespace Prefix: |
us-gaap_ |
| Data Type: |
xbrli:sharesItemType |
| Balance Type: |
na |
| Period Type: |
duration |
|
v3.23.3
Consolidated Statements of Changes in Stockholders' Equity - USD ($)
|
Common Stock [Member] |
Additional Paid-in Capital [Member] |
AOCI Attributable to Parent [Member] |
Retained Earnings [Member] |
Total |
| Balance value at Jul. 31, 2021 |
$ 5,943
|
$ 1,830,300
|
$ 4,698
|
$ (2,031,848)
|
$ (190,907)
|
| Balance, shares at Jul. 31, 2021 |
59,434,838
|
|
|
|
|
| Net loss for the year |
|
|
|
(357,333)
|
(357,333)
|
| Foreign currency translation adjustment |
|
|
14,876
|
|
14,876
|
| Balance value at Jul. 31, 2022 |
$ 5,943
|
1,830,300
|
19,574
|
(2,389,181)
|
(533,364)
|
| Balance, shares at Jul. 31, 2022 |
59,434,838
|
|
|
|
|
| Net loss for the year |
|
|
|
(68,827)
|
(68,827)
|
| Foreign currency translation adjustment |
|
811
|
17,405
|
|
18,216
|
| Balance value at Jul. 31, 2023 |
$ 5,943
|
$ 1,831,111
|
$ 36,979
|
$ (2,458,008)
|
$ (583,975)
|
| Balance, shares at Jul. 31, 2023 |
59,434,838
|
|
|
|
|
| X |
- DefinitionOther comprehensive income loss foreign currency transaction and translation additional paid in capital adjustment net of tax.
| Name: |
MUGH_OtherComprehensiveIncomeLossForeignCurrencyTransactionAndTranslationAdditionalPaidInCapitalAdjustmentNetOfTax |
| Namespace Prefix: |
MUGH_ |
| Data Type: |
xbrli:monetaryItemType |
| Balance Type: |
credit |
| Period Type: |
duration |
|
| X |
- DefinitionThe portion of profit or loss for the period, net of income taxes, which is attributable to the parent. Reference 1: http://www.xbrl.org/2003/role/disclosureRef
-Topic 235
-SubTopic 10
-Name Accounting Standards Codification
-Section S99
-Paragraph 1
-Subparagraph (SX 210.4-08(g)(1)(ii))
-Publisher FASB
-URI https://asc.fasb.org//1943274/2147480678/235-10-S99-1
Reference 2: http://www.xbrl.org/2003/role/disclosureRef
-Topic 323
-SubTopic 10
-Name Accounting Standards Codification
-Section 50
-Paragraph 3
-Subparagraph (c)
-Publisher FASB
-URI https://asc.fasb.org//1943274/2147481687/323-10-50-3
Reference 3: http://www.xbrl.org/2003/role/disclosureRef
-Topic 825
-SubTopic 10
-Name Accounting Standards Codification
-Section 50
-Paragraph 28
-Subparagraph (f)
-Publisher FASB
-URI https://asc.fasb.org//1943274/2147482907/825-10-50-28
Reference 4: http://www.xbrl.org/2003/role/disclosureRef
-Topic 220
-SubTopic 10
-Name Accounting Standards Codification
-Section 50
-Paragraph 6
-Publisher FASB
-URI https://asc.fasb.org//1943274/2147482765/220-10-50-6
Reference 5: http://www.xbrl.org/2003/role/disclosureRef
-Topic 250
-SubTopic 10
-Name Accounting Standards Codification
-Section 50
-Paragraph 3
-Publisher FASB
-URI https://asc.fasb.org//1943274/2147483443/250-10-50-3
Reference 6: http://www.xbrl.org/2003/role/disclosureRef
-Topic 250
-SubTopic 10
-Name Accounting Standards Codification
-Section 50
-Paragraph 1
-Subparagraph (b)(2)
-Publisher FASB
-URI https://asc.fasb.org//1943274/2147483443/250-10-50-1
Reference 7: http://www.xbrl.org/2003/role/disclosureRef
-Topic 815
-SubTopic 40
-Name Accounting Standards Codification
-Section 65
-Paragraph 1
-Subparagraph (f)
-Publisher FASB
-URI https://asc.fasb.org//1943274/2147480175/815-40-65-1
Reference 8: http://www.xbrl.org/2003/role/disclosureRef
-Topic 250
-SubTopic 10
-Name Accounting Standards Codification
-Section 50
-Paragraph 8
-Publisher FASB
-URI https://asc.fasb.org//1943274/2147483443/250-10-50-8
Reference 9: http://www.xbrl.org/2003/role/disclosureRef
-Topic 250
-SubTopic 10
-Name Accounting Standards Codification
-Section 50
-Paragraph 9
-Publisher FASB
-URI https://asc.fasb.org//1943274/2147483443/250-10-50-9
Reference 10: http://www.xbrl.org/2003/role/disclosureRef
-Topic 250
-SubTopic 10
-Name Accounting Standards Codification
-Section 50
-Paragraph 11
-Subparagraph (a)
-Publisher FASB
-URI https://asc.fasb.org//1943274/2147483443/250-10-50-11
Reference 11: http://www.xbrl.org/2003/role/disclosureRef
-Topic 250
-SubTopic 10
-Name Accounting Standards Codification
-Section 50
-Paragraph 11
-Subparagraph (b)
-Publisher FASB
-URI https://asc.fasb.org//1943274/2147483443/250-10-50-11
Reference 12: http://www.xbrl.org/2003/role/disclosureRef
-Topic 250
-SubTopic 10
-Name Accounting Standards Codification
-Section 50
-Paragraph 4
-Publisher FASB
-URI https://asc.fasb.org//1943274/2147483443/250-10-50-4
Reference 13: http://www.xbrl.org/2003/role/exampleRef
-Topic 946
-SubTopic 830
-Name Accounting Standards Codification
-Section 55
-Paragraph 10
-Publisher FASB
-URI https://asc.fasb.org//1943274/2147480167/946-830-55-10
Reference 14: http://www.xbrl.org/2003/role/disclosureRef
-Topic 946
-SubTopic 220
-Name Accounting Standards Codification
-Section 45
-Paragraph 7
-Publisher FASB
-URI https://asc.fasb.org//1943274/2147483581/946-220-45-7
Reference 15: http://www.xbrl.org/2003/role/disclosureRef
-Topic 944
-SubTopic 220
-Name Accounting Standards Codification
-Section S99
-Paragraph 1
-Subparagraph (SX 210.7-04(18))
-Publisher FASB
-URI https://asc.fasb.org//1943274/2147483586/944-220-S99-1
Reference 16: http://www.xbrl.org/2003/role/disclosureRef
-Topic 280
-SubTopic 10
-Name Accounting Standards Codification
-Section 50
-Paragraph 22
-Publisher FASB
-URI https://asc.fasb.org//1943274/2147482810/280-10-50-22
Reference 17: http://www.xbrl.org/2003/role/disclosureRef
-Topic 946
-SubTopic 220
-Name Accounting Standards Codification
-Section S99
-Paragraph 1
-Subparagraph (SX 210.6-07(9))
-Publisher FASB
-URI https://asc.fasb.org//1943274/2147483575/946-220-S99-1
Reference 18: http://www.xbrl.org/2003/role/disclosureRef
-Topic 946
-SubTopic 220
-Name Accounting Standards Codification
-Section S99
-Paragraph 3
-Subparagraph (SX 210.6-09(1)(d))
-Publisher FASB
-URI https://asc.fasb.org//1943274/2147483575/946-220-S99-3
Reference 19: http://www.xbrl.org/2003/role/disclosureRef
-Topic 470
-SubTopic 10
-Name Accounting Standards Codification
-Section S99
-Paragraph 1A
-Subparagraph (SX 210.13-01(a)(4)(i))
-Publisher FASB
-URI https://asc.fasb.org//1943274/2147480097/470-10-S99-1A
Reference 20: http://www.xbrl.org/2009/role/commonPracticeRef
-Topic 470
-SubTopic 10
-Name Accounting Standards Codification
-Section S99
-Paragraph 1A
-Subparagraph (SX 210.13-01(a)(4)(ii))
-Publisher FASB
-URI https://asc.fasb.org//1943274/2147480097/470-10-S99-1A
Reference 21: http://www.xbrl.org/2003/role/disclosureRef
-Topic 470
-SubTopic 10
-Name Accounting Standards Codification
-Section S99
-Paragraph 1A
-Subparagraph (SX 210.13-01(a)(4)(iii)(A))
-Publisher FASB
-URI https://asc.fasb.org//1943274/2147480097/470-10-S99-1A
Reference 22: http://www.xbrl.org/2003/role/disclosureRef
-Topic 470
-SubTopic 10
-Name Accounting Standards Codification
-Section S99
-Paragraph 1A
-Subparagraph (SX 210.13-01(a)(4)(iv))
-Publisher FASB
-URI https://asc.fasb.org//1943274/2147480097/470-10-S99-1A
Reference 23: http://www.xbrl.org/2003/role/disclosureRef
-Topic 470
-SubTopic 10
-Name Accounting Standards Codification
-Section S99
-Paragraph 1A
-Subparagraph (SX 210.13-01(a)(5))
-Publisher FASB
-URI https://asc.fasb.org//1943274/2147480097/470-10-S99-1A
Reference 24: http://www.xbrl.org/2003/role/disclosureRef
-Topic 470
-SubTopic 10
-Name Accounting Standards Codification
-Section S99
-Paragraph 1B
-Subparagraph (SX 210.13-02(a)(4)(i))
-Publisher FASB
-URI https://asc.fasb.org//1943274/2147480097/470-10-S99-1B
Reference 25: http://www.xbrl.org/2003/role/disclosureRef
-Topic 470
-SubTopic 10
-Name Accounting Standards Codification
-Section S99
-Paragraph 1B
-Subparagraph (SX 210.13-02(a)(4)(iii)(A))
-Publisher FASB
-URI https://asc.fasb.org//1943274/2147480097/470-10-S99-1B
Reference 26: http://www.xbrl.org/2003/role/disclosureRef
-Topic 470
-SubTopic 10
-Name Accounting Standards Codification
-Section S99
-Paragraph 1B
-Subparagraph (SX 210.13-02(a)(4)(iii)(B))
-Publisher FASB
-URI https://asc.fasb.org//1943274/2147480097/470-10-S99-1B
Reference 27: http://www.xbrl.org/2003/role/disclosureRef
-Topic 470
-SubTopic 10
-Name Accounting Standards Codification
-Section S99
-Paragraph 1B
-Subparagraph (SX 210.13-02(a)(4)(iv))
-Publisher FASB
-URI https://asc.fasb.org//1943274/2147480097/470-10-S99-1B
Reference 28: http://www.xbrl.org/2003/role/disclosureRef
-Topic 470
-SubTopic 10
-Name Accounting Standards Codification
-Section S99
-Paragraph 1B
-Subparagraph (SX 210.13-02(a)(5))
-Publisher FASB
-URI https://asc.fasb.org//1943274/2147480097/470-10-S99-1B
Reference 29: http://www.xbrl.org/2003/role/disclosureRef
-Topic 280
-SubTopic 10
-Name Accounting Standards Codification
-Section 50
-Paragraph 30
-Subparagraph (b)
-Publisher FASB
-URI https://asc.fasb.org//1943274/2147482810/280-10-50-30
Reference 30: http://www.xbrl.org/2003/role/disclosureRef
-Topic 280
-SubTopic 10
-Name Accounting Standards Codification
-Section 50
-Paragraph 32
-Subparagraph (f)
-Publisher FASB
-URI https://asc.fasb.org//1943274/2147482810/280-10-50-32
Reference 31: http://www.xbrl.org/2003/role/disclosureRef
-Topic 260
-SubTopic 10
-Name Accounting Standards Codification
-Section 45
-Paragraph 60B
-Subparagraph (a)
-Publisher FASB
-URI https://asc.fasb.org//1943274/2147482689/260-10-45-60B
Reference 32: http://www.xbrl.org/2003/role/exampleRef
-Topic 280
-SubTopic 10
-Name Accounting Standards Codification
-Section 50
-Paragraph 31
-Publisher FASB
-URI https://asc.fasb.org//1943274/2147482810/280-10-50-31
Reference 33: http://www.xbrl.org/2003/role/disclosureRef
-Topic 280
-SubTopic 10
-Name Accounting Standards Codification
-Section 50
-Paragraph 32
-Subparagraph (c)
-Publisher FASB
-URI https://asc.fasb.org//1943274/2147482810/280-10-50-32
Reference 34: http://www.xbrl.org/2003/role/disclosureRef
-Topic 205
-SubTopic 20
-Name Accounting Standards Codification
-Section 50
-Paragraph 7
-Publisher FASB
-URI https://asc.fasb.org//1943274/2147483499/205-20-50-7
Reference 35: http://fasb.org/us-gaap/role/ref/legacyRef
-Topic 230
-SubTopic 10
-Name Accounting Standards Codification
-Section 45
-Paragraph 28
-Publisher FASB
-URI https://asc.fasb.org//1943274/2147482740/230-10-45-28
Reference 36: http://www.xbrl.org/2003/role/disclosureRef
-Topic 220
-SubTopic 10
-Name Accounting Standards Codification
-Section 45
-Paragraph 1A
-Subparagraph (a)
-Publisher FASB
-URI https://asc.fasb.org//1943274/2147482790/220-10-45-1A
Reference 37: http://www.xbrl.org/2003/role/disclosureRef
-Topic 220
-SubTopic 10
-Name Accounting Standards Codification
-Section 45
-Paragraph 1B
-Subparagraph (a)
-Publisher FASB
-URI https://asc.fasb.org//1943274/2147482790/220-10-45-1B
Reference 38: http://fasb.org/us-gaap/role/ref/legacyRef
-Topic 220
-SubTopic 10
-Name Accounting Standards Codification
-Section S99
-Paragraph 2
-Subparagraph (SX 210.5-03(20))
-Publisher FASB
-URI https://asc.fasb.org//1943274/2147483621/220-10-S99-2
Reference 39: http://fasb.org/us-gaap/role/ref/legacyRef
-Topic 942
-SubTopic 220
-Name Accounting Standards Codification
-Section S99
-Paragraph 1
-Subparagraph (SX 210.9-04(22))
-Publisher FASB
-URI https://asc.fasb.org//1943274/2147483589/942-220-S99-1
| Name: |
us-gaap_NetIncomeLoss |
| Namespace Prefix: |
us-gaap_ |
| Data Type: |
xbrli:monetaryItemType |
| Balance Type: |
credit |
| Period Type: |
duration |
|
| X |
- DefinitionNumber of shares issued which are neither cancelled nor held in the treasury.
| Name: |
us-gaap_SharesOutstanding |
| Namespace Prefix: |
us-gaap_ |
| Data Type: |
xbrli:sharesItemType |
| Balance Type: |
na |
| Period Type: |
instant |
|
| X |
- DefinitionAmount of equity (deficit) attributable to parent. Excludes temporary equity and equity attributable to noncontrolling interest. Reference 1: http://www.xbrl.org/2003/role/exampleRef
-Topic 852
-SubTopic 10
-Name Accounting Standards Codification
-Section 55
-Paragraph 10
-Publisher FASB
-URI https://asc.fasb.org//1943274/2147481372/852-10-55-10
Reference 2: http://www.xbrl.org/2003/role/exampleRef
-Topic 946
-SubTopic 830
-Name Accounting Standards Codification
-Section 55
-Paragraph 12
-Publisher FASB
-URI https://asc.fasb.org//1943274/2147480167/946-830-55-12
Reference 3: http://www.xbrl.org/2003/role/disclosureRef
-Topic 946
-SubTopic 210
-Name Accounting Standards Codification
-Section S99
-Paragraph 1
-Subparagraph (SX 210.6-04(19))
-Publisher FASB
-URI https://asc.fasb.org//1943274/2147479617/946-210-S99-1
Reference 4: http://www.xbrl.org/2003/role/disclosureRef
-Topic 946
-SubTopic 210
-Name Accounting Standards Codification
-Section S99
-Paragraph 2
-Subparagraph (SX 210.6-05(4))
-Publisher FASB
-URI https://asc.fasb.org//1943274/2147479617/946-210-S99-2
Reference 5: http://www.xbrl.org/2009/role/commonPracticeRef
-Topic 946
-SubTopic 220
-Name Accounting Standards Codification
-Section S99
-Paragraph 3
-Subparagraph (SX 210.6-09(4)(b))
-Publisher FASB
-URI https://asc.fasb.org//1943274/2147483575/946-220-S99-3
Reference 6: http://www.xbrl.org/2003/role/disclosureRef
-Topic 946
-SubTopic 220
-Name Accounting Standards Codification
-Section S99
-Paragraph 3
-Subparagraph (SX 210.6-09(6))
-Publisher FASB
-URI https://asc.fasb.org//1943274/2147483575/946-220-S99-3
Reference 7: http://www.xbrl.org/2003/role/disclosureRef
-Topic 946
-SubTopic 220
-Name Accounting Standards Codification
-Section S99
-Paragraph 3
-Subparagraph (SX 210.6-09(7))
-Publisher FASB
-URI https://asc.fasb.org//1943274/2147483575/946-220-S99-3
Reference 8: http://www.xbrl.org/2009/role/commonPracticeRef
-Topic 235
-SubTopic 10
-Name Accounting Standards Codification
-Section S99
-Paragraph 1
-Subparagraph (SX 210.4-08(g)(1)(ii))
-Publisher FASB
-URI https://asc.fasb.org//1943274/2147480678/235-10-S99-1
Reference 9: http://www.xbrl.org/2009/role/commonPracticeRef
-Topic 323
-SubTopic 10
-Name Accounting Standards Codification
-Section 50
-Paragraph 3
-Subparagraph (c)
-Publisher FASB
-URI https://asc.fasb.org//1943274/2147481687/323-10-50-3
Reference 10: http://www.xbrl.org/2009/role/commonPracticeRef
-Topic 825
-SubTopic 10
-Name Accounting Standards Codification
-Section 50
-Paragraph 28
-Subparagraph (f)
-Publisher FASB
-URI https://asc.fasb.org//1943274/2147482907/825-10-50-28
Reference 11: http://fasb.org/us-gaap/role/ref/legacyRef
-Topic 210
-SubTopic 10
-Name Accounting Standards Codification
-Section S99
-Paragraph 1
-Subparagraph (SX 210.5-02(29))
-Publisher FASB
-URI https://asc.fasb.org//1943274/2147480566/210-10-S99-1
Reference 12: http://fasb.org/us-gaap/role/ref/legacyRef
-Topic 210
-SubTopic 10
-Name Accounting Standards Codification
-Section S99
-Paragraph 1
-Subparagraph (SX 210.5-02(31))
-Publisher FASB
-URI https://asc.fasb.org//1943274/2147480566/210-10-S99-1
Reference 13: http://fasb.org/us-gaap/role/ref/legacyRef
-Topic 210
-SubTopic 10
-Name Accounting Standards Codification
-Section S99
-Paragraph 1
-Subparagraph (SX 210.5-02(30))
-Publisher FASB
-URI https://asc.fasb.org//1943274/2147480566/210-10-S99-1
Reference 14: http://fasb.org/us-gaap/role/ref/legacyRef
-Topic 310
-SubTopic 10
-Name Accounting Standards Codification
-Section S99
-Paragraph 2
-Subparagraph (SAB Topic 4.E)
-Publisher FASB
-URI https://asc.fasb.org//1943274/2147480418/310-10-S99-2
| Name: |
us-gaap_StockholdersEquity |
| Namespace Prefix: |
us-gaap_ |
| Data Type: |
xbrli:monetaryItemType |
| Balance Type: |
credit |
| Period Type: |
instant |
|
v3.23.3
Consolidated Statement of Cash Flows - USD ($)
|
12 Months Ended |
Jul. 31, 2023 |
Jul. 31, 2022 |
| CASH FLOWS FROM OPERATING ACTIVITIES: |
|
|
| Net loss |
$ (68,827)
|
$ (357,333)
|
| Adjustments to reconcile net loss to net cash used in operating activities: |
|
|
| Depreciation and amortization |
4,837
|
102,904
|
| Impairment of fixed assets |
(2,780)
|
174,973
|
| Asset written-off |
(6)
|
100
|
| Lease interest |
176
|
|
| Gain on disposal |
(14,144)
|
(27,539)
|
| Gain on re-measurement of extended loan repayment |
(15,090)
|
|
| Waiver of debts |
(40,109)
|
|
| Interest expense |
9,851
|
2,641
|
| Prepayment written-off |
35,915
|
|
| Changes in operating assets and liabilities: |
|
|
| Prepayments and deposits |
(1,450)
|
54,782
|
| Amount due from related parties |
9,183
|
(868)
|
| Inventories |
14,244
|
20,284
|
| Other payables and accrued liabilities |
1,978
|
3,485
|
| Amount due to related parties |
8,100
|
31,800
|
| Leased liabilities |
(5,395)
|
(6,185)
|
| Deposit from franchisees |
|
(3,213)
|
| Net cash used in operating activities |
(63,517)
|
(4,169)
|
| CASH FLOWS FROM INVESTING ACTIVITIES: |
|
|
| Proceed on disposal of property, plant and equipment |
20,514
|
44,340
|
| Purchase of trademark |
(3,584)
|
(2,841)
|
| Purchase of property, plant and equipment |
|
(41,811)
|
| Net cash generated from/(used in) investing activities |
16,930
|
(312)
|
| CASH FLOWS FROM FINANCING ACTIVITIES: |
|
|
| Loan from director |
24,366
|
(1,222)
|
| Loan from related party |
(2,873)
|
(8,018)
|
| Loan from third party |
24,717
|
(5,721)
|
| Net cash generated from/(used in) financing activities |
46,210
|
(14,961)
|
| Effect of foreign exchange translation |
1,893
|
2,120
|
| Net change in cash and cash equivalents |
1,516
|
(17,322)
|
| Cash and cash equivalents, beginning of year |
2,909
|
20,231
|
| CASH AND CASH EQUIVALENTS, END OF YEAR |
$ 4,425
|
$ 2,909
|
| X |
- DefinitionGain loss on remeasurement of extended loan repayment.
| Name: |
MUGH_GainLossOnRemeasurementOfExtendedLoanRepayment |
| Namespace Prefix: |
MUGH_ |
| Data Type: |
xbrli:monetaryItemType |
| Balance Type: |
credit |
| Period Type: |
duration |
|
| X |
- DefinitionImpairment of fixed assets.
| Name: |
MUGH_ImpairmentOfFixedAssets |
| Namespace Prefix: |
MUGH_ |
| Data Type: |
xbrli:monetaryItemType |
| Balance Type: |
debit |
| Period Type: |
duration |
|
| X |
- Definition
+ References
+ Details
| Name: |
MUGH_IncreaseDecreaseInDepositFromFranchisees |
| Namespace Prefix: |
MUGH_ |
| Data Type: |
xbrli:monetaryItemType |
| Balance Type: |
debit |
| Period Type: |
duration |
|
| X |
- Definition
+ References
+ Details
| Name: |
MUGH_IncreaseDecreaseInLeasedLiabilities |
| Namespace Prefix: |
MUGH_ |
| Data Type: |
xbrli:monetaryItemType |
| Balance Type: |
debit |
| Period Type: |
duration |
|
| X |
- Definition
+ References
+ Details
| Name: |
MUGH_PrepaymentWrittenoff |
| Namespace Prefix: |
MUGH_ |
| Data Type: |
xbrli:monetaryItemType |
| Balance Type: |
credit |
| Period Type: |
duration |
|
| X |
- DefinitionProceeds from repayments of third party debt.
| Name: |
MUGH_ProceedsFromRepaymentsOfThirdPartyDebt |
| Namespace Prefix: |
MUGH_ |
| Data Type: |
xbrli:monetaryItemType |
| Balance Type: |
debit |
| Period Type: |
duration |
|
| X |
- References
+ Details
| Name: |
us-gaap_AdjustmentsToReconcileNetIncomeLossToCashProvidedByUsedInOperatingActivitiesAbstract |
| Namespace Prefix: |
us-gaap_ |
| Data Type: |
xbrli:stringItemType |
| Balance Type: |
na |
| Period Type: |
duration |
|
| X |
- DefinitionAmount of write-down of assets recognized in the income statement. Includes, but is not limited to, losses from tangible assets, intangible assets and goodwill. Reference 1: http://fasb.org/us-gaap/role/ref/legacyRef
-Name Accounting Standards Codification
-Section 45
-Paragraph 28
-Subparagraph (b)
-SubTopic 10
-Topic 230
-Publisher FASB
-URI https://asc.fasb.org//1943274/2147482740/230-10-45-28
Reference 2: http://fasb.org/us-gaap/role/ref/legacyRef
-Name Accounting Standards Codification
-Topic 360
-SubTopic 10
-Section 45
-Paragraph 4
-Publisher FASB
-URI https://asc.fasb.org//1943274/2147482130/360-10-45-4
| Name: |
us-gaap_AssetImpairmentCharges |
| Namespace Prefix: |
us-gaap_ |
| Data Type: |
xbrli:monetaryItemType |
| Balance Type: |
debit |
| Period Type: |
duration |
|
| X |
- DefinitionAmount of cash and cash equivalents, and cash and cash equivalents restricted to withdrawal or usage; including, but not limited to, disposal group and discontinued operations. Cash includes, but is not limited to, currency on hand, demand deposits with banks or financial institutions, and other accounts with general characteristics of demand deposits. Cash equivalents include, but are not limited to, short-term, highly liquid investments that are both readily convertible to known amounts of cash and so near their maturity that they present insignificant risk of changes in value because of changes in interest rates. Reference 1: http://www.xbrl.org/2003/role/disclosureRef
-Topic 230
-SubTopic 10
-Name Accounting Standards Codification
-Section 50
-Paragraph 8
-Publisher FASB
-URI https://asc.fasb.org//1943274/2147482913/230-10-50-8
Reference 2: http://fasb.org/us-gaap/role/ref/legacyRef
-Topic 230
-SubTopic 10
-Name Accounting Standards Codification
-Section 45
-Paragraph 24
-Publisher FASB
-URI https://asc.fasb.org//1943274/2147482740/230-10-45-24
Reference 3: http://fasb.org/us-gaap/role/ref/legacyRef
-Name Accounting Standards Codification
-Topic 230
-SubTopic 10
-Section 45
-Paragraph 4
-Publisher FASB
-URI https://asc.fasb.org//1943274/2147482740/230-10-45-4
| Name: |
us-gaap_CashCashEquivalentsRestrictedCashAndRestrictedCashEquivalentsIncludingDisposalGroupAndDiscontinuedOperations |
| Namespace Prefix: |
us-gaap_ |
| Data Type: |
xbrli:monetaryItemType |
| Balance Type: |
debit |
| Period Type: |
instant |
|
| X |
- DefinitionAmount of increase (decrease) in cash, cash equivalents, and cash and cash equivalents restricted to withdrawal or usage; including effect from exchange rate change. Cash includes, but is not limited to, currency on hand, demand deposits with banks or financial institutions, and other accounts with general characteristics of demand deposits. Cash equivalents include, but are not limited to, short-term, highly liquid investments that are both readily convertible to known amounts of cash and so near their maturity that they present insignificant risk of changes in value because of changes in interest rates. Reference 1: http://fasb.org/us-gaap/role/ref/legacyRef
-Topic 230
-SubTopic 10
-Name Accounting Standards Codification
-Section 45
-Paragraph 24
-Publisher FASB
-URI https://asc.fasb.org//1943274/2147482740/230-10-45-24
Reference 2: http://fasb.org/us-gaap/role/ref/legacyRef
-Name Accounting Standards Codification
-Section 45
-Paragraph 1
-SubTopic 230
-Topic 830
-Publisher FASB
-URI https://asc.fasb.org//1943274/2147481877/830-230-45-1
| Name: |
us-gaap_CashCashEquivalentsRestrictedCashAndRestrictedCashEquivalentsPeriodIncreaseDecreaseIncludingExchangeRateEffect |
| Namespace Prefix: |
us-gaap_ |
| Data Type: |
xbrli:monetaryItemType |
| Balance Type: |
debit |
| Period Type: |
duration |
|
| X |
- DefinitionThe aggregate expense recognized in the current period that allocates the cost of tangible assets, intangible assets, or depleting assets to periods that benefit from use of the assets. Reference 1: http://fasb.org/us-gaap/role/ref/legacyRef
-Name Accounting Standards Codification
-Section 45
-Paragraph 28
-Subparagraph (b)
-SubTopic 10
-Topic 230
-Publisher FASB
-URI https://asc.fasb.org//1943274/2147482740/230-10-45-28
Reference 2: http://www.xbrl.org/2003/role/disclosureRef
-Topic 280
-SubTopic 10
-Name Accounting Standards Codification
-Section 50
-Paragraph 22
-Subparagraph (e)
-Publisher FASB
-URI https://asc.fasb.org//1943274/2147482810/280-10-50-22
| Name: |
us-gaap_DepreciationDepletionAndAmortization |
| Namespace Prefix: |
us-gaap_ |
| Data Type: |
xbrli:monetaryItemType |
| Balance Type: |
debit |
| Period Type: |
duration |
|
| X |
- DefinitionAmount of increase (decrease) from effect of exchange rate changes on cash and cash equivalents, and cash and cash equivalents restricted to withdrawal or usage; held in foreign currencies; including, but not limited to, disposal group and discontinued operations. Cash includes, but is not limited to, currency on hand, demand deposits with banks or financial institutions, and other accounts with general characteristics of demand deposits. Cash equivalents include, but are not limited to, short-term, highly liquid investments that are both readily convertible to known amounts of cash and so near their maturity that they present insignificant risk of changes in value because of changes in interest rates. Reference 1: http://www.xbrl.org/2009/role/commonPracticeRef
-Topic 830
-SubTopic 230
-Name Accounting Standards Codification
-Section 45
-Paragraph 1
-Publisher FASB
-URI https://asc.fasb.org//1943274/2147481877/830-230-45-1
| Name: |
us-gaap_EffectOfExchangeRateOnCashCashEquivalentsRestrictedCashAndRestrictedCashEquivalentsIncludingDisposalGroupAndDiscontinuedOperations |
| Namespace Prefix: |
us-gaap_ |
| Data Type: |
xbrli:monetaryItemType |
| Balance Type: |
debit |
| Period Type: |
duration |
|
| X |
- DefinitionAmount of gain (loss) on sale or disposal of assets, including but not limited to property plant and equipment, intangible assets and equity in securities of subsidiaries or equity method investee. Reference 1: http://www.xbrl.org/2009/role/commonPracticeRef
-Topic 230
-SubTopic 10
-Name Accounting Standards Codification
-Section 45
-Paragraph 28
-Subparagraph (b)
-Publisher FASB
-URI https://asc.fasb.org//1943274/2147482740/230-10-45-28
| Name: |
us-gaap_GainLossOnDispositionOfAssets1 |
| Namespace Prefix: |
us-gaap_ |
| Data Type: |
xbrli:monetaryItemType |
| Balance Type: |
credit |
| Period Type: |
duration |
|
| X |
- DefinitionThe increase (decrease) during the reporting period in the aggregate value of all inventory held by the reporting entity, associated with underlying transactions that are classified as operating activities. Reference 1: http://fasb.org/us-gaap/role/ref/legacyRef
-Name Accounting Standards Codification
-Section 45
-Paragraph 28
-Subparagraph (a)
-SubTopic 10
-Topic 230
-Publisher FASB
-URI https://asc.fasb.org//1943274/2147482740/230-10-45-28
| Name: |
us-gaap_IncreaseDecreaseInInventories |
| Namespace Prefix: |
us-gaap_ |
| Data Type: |
xbrli:monetaryItemType |
| Balance Type: |
credit |
| Period Type: |
duration |
|
| X |
- References
+ Details
| Name: |
us-gaap_IncreaseDecreaseInOperatingCapitalAbstract |
| Namespace Prefix: |
us-gaap_ |
| Data Type: |
xbrli:stringItemType |
| Balance Type: |
na |
| Period Type: |
duration |
|
| X |
- DefinitionThe increase (decrease) during the reporting period in other obligations or expenses incurred but not yet paid. Reference 1: http://fasb.org/us-gaap/role/ref/legacyRef
-Name Accounting Standards Codification
-Section 45
-Paragraph 28
-Subparagraph (a)
-SubTopic 10
-Topic 230
-Publisher FASB
-URI https://asc.fasb.org//1943274/2147482740/230-10-45-28
| Name: |
us-gaap_IncreaseDecreaseInOtherAccountsPayableAndAccruedLiabilities |
| Namespace Prefix: |
us-gaap_ |
| Data Type: |
xbrli:monetaryItemType |
| Balance Type: |
debit |
| Period Type: |
duration |
|
| X |
- DefinitionAmount of increase (decrease) in prepaid expenses, and assets classified as other. Reference 1: http://fasb.org/us-gaap/role/ref/legacyRef
-Name Accounting Standards Codification
-Section 45
-Paragraph 28
-Subparagraph (a)
-SubTopic 10
-Topic 230
-Publisher FASB
-URI https://asc.fasb.org//1943274/2147482740/230-10-45-28
| Name: |
us-gaap_IncreaseDecreaseInPrepaidDeferredExpenseAndOtherAssets |
| Namespace Prefix: |
us-gaap_ |
| Data Type: |
xbrli:monetaryItemType |
| Balance Type: |
credit |
| Period Type: |
duration |
|
| X |
- DefinitionAmount of the cost of borrowed funds accounted for as interest expense. Reference 1: http://www.xbrl.org/2003/role/exampleRef
-Topic 946
-SubTopic 830
-Name Accounting Standards Codification
-Section 55
-Paragraph 10
-Publisher FASB
-URI https://asc.fasb.org//1943274/2147480167/946-830-55-10
Reference 2: http://www.xbrl.org/2009/role/commonPracticeRef
-Topic 946
-SubTopic 220
-Name Accounting Standards Codification
-Section 45
-Paragraph 3
-Subparagraph (i)
-Publisher FASB
-URI https://asc.fasb.org//1943274/2147483581/946-220-45-3
Reference 3: http://www.xbrl.org/2003/role/disclosureRef
-Topic 946
-SubTopic 220
-Name Accounting Standards Codification
-Section S99
-Paragraph 1
-Subparagraph (SX 210.6-07(3))
-Publisher FASB
-URI https://asc.fasb.org//1943274/2147483575/946-220-S99-1
Reference 4: http://www.xbrl.org/2003/role/disclosureRef
-Topic 280
-SubTopic 10
-Name Accounting Standards Codification
-Section 50
-Paragraph 22
-Subparagraph (d)
-Publisher FASB
-URI https://asc.fasb.org//1943274/2147482810/280-10-50-22
Reference 5: http://fasb.org/us-gaap/role/ref/legacyRef
-Name Accounting Standards Codification
-Topic 835
-SubTopic 30
-Section 45
-Paragraph 3
-Publisher FASB
-URI https://asc.fasb.org//1943274/2147482925/835-30-45-3
Reference 6: http://fasb.org/us-gaap/role/ref/legacyRef
-Topic 942
-SubTopic 220
-Name Accounting Standards Codification
-Section S99
-Paragraph 1
-Subparagraph (SX 210.9-04.9)
-Publisher FASB
-URI https://asc.fasb.org//1943274/2147483589/942-220-S99-1
Reference 7: http://www.xbrl.org/2003/role/disclosureRef
-Topic 220
-SubTopic 10
-Name Accounting Standards Codification
-Section S99
-Paragraph 2
-Subparagraph (210.5-03(11))
-Publisher FASB
-URI https://asc.fasb.org//1943274/2147483621/220-10-S99-2
Reference 8: http://www.xbrl.org/2003/role/disclosureRef
-Topic 835
-SubTopic 20
-Name Accounting Standards Codification
-Section 50
-Paragraph 1
-Subparagraph (a)
-Publisher FASB
-URI https://asc.fasb.org//1943274/2147483013/835-20-50-1
| Name: |
us-gaap_InterestExpense |
| Namespace Prefix: |
us-gaap_ |
| Data Type: |
xbrli:monetaryItemType |
| Balance Type: |
debit |
| Period Type: |
duration |
|
| X |
- DefinitionAmount of cash inflow (outflow) from financing activities, including discontinued operations. Financing activity cash flows include obtaining resources from owners and providing them with a return on, and a return of, their investment; borrowing money and repaying amounts borrowed, or settling the obligation; and obtaining and paying for other resources obtained from creditors on long-term credit. Reference 1: http://www.xbrl.org/2003/role/disclosureRef
-Topic 230
-SubTopic 10
-Name Accounting Standards Codification
-Section 45
-Paragraph 24
-Publisher FASB
-URI https://asc.fasb.org//1943274/2147482740/230-10-45-24
| Name: |
us-gaap_NetCashProvidedByUsedInFinancingActivities |
| Namespace Prefix: |
us-gaap_ |
| Data Type: |
xbrli:monetaryItemType |
| Balance Type: |
debit |
| Period Type: |
duration |
|
| X |
- References
+ Details
| Name: |
us-gaap_NetCashProvidedByUsedInFinancingActivitiesAbstract |
| Namespace Prefix: |
us-gaap_ |
| Data Type: |
xbrli:stringItemType |
| Balance Type: |
na |
| Period Type: |
duration |
|
| X |
- DefinitionAmount of cash inflow (outflow) from investing activities, including discontinued operations. Investing activity cash flows include making and collecting loans and acquiring and disposing of debt or equity instruments and property, plant, and equipment and other productive assets. Reference 1: http://www.xbrl.org/2003/role/disclosureRef
-Topic 230
-SubTopic 10
-Name Accounting Standards Codification
-Section 45
-Paragraph 24
-Publisher FASB
-URI https://asc.fasb.org//1943274/2147482740/230-10-45-24
| Name: |
us-gaap_NetCashProvidedByUsedInInvestingActivities |
| Namespace Prefix: |
us-gaap_ |
| Data Type: |
xbrli:monetaryItemType |
| Balance Type: |
debit |
| Period Type: |
duration |
|
| X |
- References
+ Details
| Name: |
us-gaap_NetCashProvidedByUsedInInvestingActivitiesAbstract |
| Namespace Prefix: |
us-gaap_ |
| Data Type: |
xbrli:stringItemType |
| Balance Type: |
na |
| Period Type: |
duration |
|
| X |
- DefinitionAmount of cash inflow (outflow) from operating activities, including discontinued operations. Operating activity cash flows include transactions, adjustments, and changes in value not defined as investing or financing activities. Reference 1: http://fasb.org/us-gaap/role/ref/legacyRef
-Topic 230
-SubTopic 10
-Name Accounting Standards Codification
-Section 45
-Paragraph 28
-Publisher FASB
-URI https://asc.fasb.org//1943274/2147482740/230-10-45-28
Reference 2: http://fasb.org/us-gaap/role/ref/legacyRef
-Topic 230
-SubTopic 10
-Name Accounting Standards Codification
-Section 45
-Paragraph 24
-Publisher FASB
-URI https://asc.fasb.org//1943274/2147482740/230-10-45-24
Reference 3: http://fasb.org/us-gaap/role/ref/legacyRef
-Topic 230
-SubTopic 10
-Name Accounting Standards Codification
-Section 45
-Paragraph 25
-Publisher FASB
-URI https://asc.fasb.org//1943274/2147482740/230-10-45-25
| Name: |
us-gaap_NetCashProvidedByUsedInOperatingActivities |
| Namespace Prefix: |
us-gaap_ |
| Data Type: |
xbrli:monetaryItemType |
| Balance Type: |
na |
| Period Type: |
duration |
|
| X |
- References
+ Details
| Name: |
us-gaap_NetCashProvidedByUsedInOperatingActivitiesAbstract |
| Namespace Prefix: |
us-gaap_ |
| Data Type: |
xbrli:stringItemType |
| Balance Type: |
na |
| Period Type: |
duration |
|
| X |
- DefinitionThe portion of profit or loss for the period, net of income taxes, which is attributable to the parent. Reference 1: http://www.xbrl.org/2003/role/disclosureRef
-Topic 235
-SubTopic 10
-Name Accounting Standards Codification
-Section S99
-Paragraph 1
-Subparagraph (SX 210.4-08(g)(1)(ii))
-Publisher FASB
-URI https://asc.fasb.org//1943274/2147480678/235-10-S99-1
Reference 2: http://www.xbrl.org/2003/role/disclosureRef
-Topic 323
-SubTopic 10
-Name Accounting Standards Codification
-Section 50
-Paragraph 3
-Subparagraph (c)
-Publisher FASB
-URI https://asc.fasb.org//1943274/2147481687/323-10-50-3
Reference 3: http://www.xbrl.org/2003/role/disclosureRef
-Topic 825
-SubTopic 10
-Name Accounting Standards Codification
-Section 50
-Paragraph 28
-Subparagraph (f)
-Publisher FASB
-URI https://asc.fasb.org//1943274/2147482907/825-10-50-28
Reference 4: http://www.xbrl.org/2003/role/disclosureRef
-Topic 220
-SubTopic 10
-Name Accounting Standards Codification
-Section 50
-Paragraph 6
-Publisher FASB
-URI https://asc.fasb.org//1943274/2147482765/220-10-50-6
Reference 5: http://www.xbrl.org/2003/role/disclosureRef
-Topic 250
-SubTopic 10
-Name Accounting Standards Codification
-Section 50
-Paragraph 3
-Publisher FASB
-URI https://asc.fasb.org//1943274/2147483443/250-10-50-3
Reference 6: http://www.xbrl.org/2003/role/disclosureRef
-Topic 250
-SubTopic 10
-Name Accounting Standards Codification
-Section 50
-Paragraph 1
-Subparagraph (b)(2)
-Publisher FASB
-URI https://asc.fasb.org//1943274/2147483443/250-10-50-1
Reference 7: http://www.xbrl.org/2003/role/disclosureRef
-Topic 815
-SubTopic 40
-Name Accounting Standards Codification
-Section 65
-Paragraph 1
-Subparagraph (f)
-Publisher FASB
-URI https://asc.fasb.org//1943274/2147480175/815-40-65-1
Reference 8: http://www.xbrl.org/2003/role/disclosureRef
-Topic 250
-SubTopic 10
-Name Accounting Standards Codification
-Section 50
-Paragraph 8
-Publisher FASB
-URI https://asc.fasb.org//1943274/2147483443/250-10-50-8
Reference 9: http://www.xbrl.org/2003/role/disclosureRef
-Topic 250
-SubTopic 10
-Name Accounting Standards Codification
-Section 50
-Paragraph 9
-Publisher FASB
-URI https://asc.fasb.org//1943274/2147483443/250-10-50-9
Reference 10: http://www.xbrl.org/2003/role/disclosureRef
-Topic 250
-SubTopic 10
-Name Accounting Standards Codification
-Section 50
-Paragraph 11
-Subparagraph (a)
-Publisher FASB
-URI https://asc.fasb.org//1943274/2147483443/250-10-50-11
Reference 11: http://www.xbrl.org/2003/role/disclosureRef
-Topic 250
-SubTopic 10
-Name Accounting Standards Codification
-Section 50
-Paragraph 11
-Subparagraph (b)
-Publisher FASB
-URI https://asc.fasb.org//1943274/2147483443/250-10-50-11
Reference 12: http://www.xbrl.org/2003/role/disclosureRef
-Topic 250
-SubTopic 10
-Name Accounting Standards Codification
-Section 50
-Paragraph 4
-Publisher FASB
-URI https://asc.fasb.org//1943274/2147483443/250-10-50-4
Reference 13: http://www.xbrl.org/2003/role/exampleRef
-Topic 946
-SubTopic 830
-Name Accounting Standards Codification
-Section 55
-Paragraph 10
-Publisher FASB
-URI https://asc.fasb.org//1943274/2147480167/946-830-55-10
Reference 14: http://www.xbrl.org/2003/role/disclosureRef
-Topic 946
-SubTopic 220
-Name Accounting Standards Codification
-Section 45
-Paragraph 7
-Publisher FASB
-URI https://asc.fasb.org//1943274/2147483581/946-220-45-7
Reference 15: http://www.xbrl.org/2003/role/disclosureRef
-Topic 944
-SubTopic 220
-Name Accounting Standards Codification
-Section S99
-Paragraph 1
-Subparagraph (SX 210.7-04(18))
-Publisher FASB
-URI https://asc.fasb.org//1943274/2147483586/944-220-S99-1
Reference 16: http://www.xbrl.org/2003/role/disclosureRef
-Topic 280
-SubTopic 10
-Name Accounting Standards Codification
-Section 50
-Paragraph 22
-Publisher FASB
-URI https://asc.fasb.org//1943274/2147482810/280-10-50-22
Reference 17: http://www.xbrl.org/2003/role/disclosureRef
-Topic 946
-SubTopic 220
-Name Accounting Standards Codification
-Section S99
-Paragraph 1
-Subparagraph (SX 210.6-07(9))
-Publisher FASB
-URI https://asc.fasb.org//1943274/2147483575/946-220-S99-1
Reference 18: http://www.xbrl.org/2003/role/disclosureRef
-Topic 946
-SubTopic 220
-Name Accounting Standards Codification
-Section S99
-Paragraph 3
-Subparagraph (SX 210.6-09(1)(d))
-Publisher FASB
-URI https://asc.fasb.org//1943274/2147483575/946-220-S99-3
Reference 19: http://www.xbrl.org/2003/role/disclosureRef
-Topic 470
-SubTopic 10
-Name Accounting Standards Codification
-Section S99
-Paragraph 1A
-Subparagraph (SX 210.13-01(a)(4)(i))
-Publisher FASB
-URI https://asc.fasb.org//1943274/2147480097/470-10-S99-1A
Reference 20: http://www.xbrl.org/2009/role/commonPracticeRef
-Topic 470
-SubTopic 10
-Name Accounting Standards Codification
-Section S99
-Paragraph 1A
-Subparagraph (SX 210.13-01(a)(4)(ii))
-Publisher FASB
-URI https://asc.fasb.org//1943274/2147480097/470-10-S99-1A
Reference 21: http://www.xbrl.org/2003/role/disclosureRef
-Topic 470
-SubTopic 10
-Name Accounting Standards Codification
-Section S99
-Paragraph 1A
-Subparagraph (SX 210.13-01(a)(4)(iii)(A))
-Publisher FASB
-URI https://asc.fasb.org//1943274/2147480097/470-10-S99-1A
Reference 22: http://www.xbrl.org/2003/role/disclosureRef
-Topic 470
-SubTopic 10
-Name Accounting Standards Codification
-Section S99
-Paragraph 1A
-Subparagraph (SX 210.13-01(a)(4)(iv))
-Publisher FASB
-URI https://asc.fasb.org//1943274/2147480097/470-10-S99-1A
Reference 23: http://www.xbrl.org/2003/role/disclosureRef
-Topic 470
-SubTopic 10
-Name Accounting Standards Codification
-Section S99
-Paragraph 1A
-Subparagraph (SX 210.13-01(a)(5))
-Publisher FASB
-URI https://asc.fasb.org//1943274/2147480097/470-10-S99-1A
Reference 24: http://www.xbrl.org/2003/role/disclosureRef
-Topic 470
-SubTopic 10
-Name Accounting Standards Codification
-Section S99
-Paragraph 1B
-Subparagraph (SX 210.13-02(a)(4)(i))
-Publisher FASB
-URI https://asc.fasb.org//1943274/2147480097/470-10-S99-1B
Reference 25: http://www.xbrl.org/2003/role/disclosureRef
-Topic 470
-SubTopic 10
-Name Accounting Standards Codification
-Section S99
-Paragraph 1B
-Subparagraph (SX 210.13-02(a)(4)(iii)(A))
-Publisher FASB
-URI https://asc.fasb.org//1943274/2147480097/470-10-S99-1B
Reference 26: http://www.xbrl.org/2003/role/disclosureRef
-Topic 470
-SubTopic 10
-Name Accounting Standards Codification
-Section S99
-Paragraph 1B
-Subparagraph (SX 210.13-02(a)(4)(iii)(B))
-Publisher FASB
-URI https://asc.fasb.org//1943274/2147480097/470-10-S99-1B
Reference 27: http://www.xbrl.org/2003/role/disclosureRef
-Topic 470
-SubTopic 10
-Name Accounting Standards Codification
-Section S99
-Paragraph 1B
-Subparagraph (SX 210.13-02(a)(4)(iv))
-Publisher FASB
-URI https://asc.fasb.org//1943274/2147480097/470-10-S99-1B
Reference 28: http://www.xbrl.org/2003/role/disclosureRef
-Topic 470
-SubTopic 10
-Name Accounting Standards Codification
-Section S99
-Paragraph 1B
-Subparagraph (SX 210.13-02(a)(5))
-Publisher FASB
-URI https://asc.fasb.org//1943274/2147480097/470-10-S99-1B
Reference 29: http://www.xbrl.org/2003/role/disclosureRef
-Topic 280
-SubTopic 10
-Name Accounting Standards Codification
-Section 50
-Paragraph 30
-Subparagraph (b)
-Publisher FASB
-URI https://asc.fasb.org//1943274/2147482810/280-10-50-30
Reference 30: http://www.xbrl.org/2003/role/disclosureRef
-Topic 280
-SubTopic 10
-Name Accounting Standards Codification
-Section 50
-Paragraph 32
-Subparagraph (f)
-Publisher FASB
-URI https://asc.fasb.org//1943274/2147482810/280-10-50-32
Reference 31: http://www.xbrl.org/2003/role/disclosureRef
-Topic 260
-SubTopic 10
-Name Accounting Standards Codification
-Section 45
-Paragraph 60B
-Subparagraph (a)
-Publisher FASB
-URI https://asc.fasb.org//1943274/2147482689/260-10-45-60B
Reference 32: http://www.xbrl.org/2003/role/exampleRef
-Topic 280
-SubTopic 10
-Name Accounting Standards Codification
-Section 50
-Paragraph 31
-Publisher FASB
-URI https://asc.fasb.org//1943274/2147482810/280-10-50-31
Reference 33: http://www.xbrl.org/2003/role/disclosureRef
-Topic 280
-SubTopic 10
-Name Accounting Standards Codification
-Section 50
-Paragraph 32
-Subparagraph (c)
-Publisher FASB
-URI https://asc.fasb.org//1943274/2147482810/280-10-50-32
Reference 34: http://www.xbrl.org/2003/role/disclosureRef
-Topic 205
-SubTopic 20
-Name Accounting Standards Codification
-Section 50
-Paragraph 7
-Publisher FASB
-URI https://asc.fasb.org//1943274/2147483499/205-20-50-7
Reference 35: http://fasb.org/us-gaap/role/ref/legacyRef
-Topic 230
-SubTopic 10
-Name Accounting Standards Codification
-Section 45
-Paragraph 28
-Publisher FASB
-URI https://asc.fasb.org//1943274/2147482740/230-10-45-28
Reference 36: http://www.xbrl.org/2003/role/disclosureRef
-Topic 220
-SubTopic 10
-Name Accounting Standards Codification
-Section 45
-Paragraph 1A
-Subparagraph (a)
-Publisher FASB
-URI https://asc.fasb.org//1943274/2147482790/220-10-45-1A
Reference 37: http://www.xbrl.org/2003/role/disclosureRef
-Topic 220
-SubTopic 10
-Name Accounting Standards Codification
-Section 45
-Paragraph 1B
-Subparagraph (a)
-Publisher FASB
-URI https://asc.fasb.org//1943274/2147482790/220-10-45-1B
Reference 38: http://fasb.org/us-gaap/role/ref/legacyRef
-Topic 220
-SubTopic 10
-Name Accounting Standards Codification
-Section S99
-Paragraph 2
-Subparagraph (SX 210.5-03(20))
-Publisher FASB
-URI https://asc.fasb.org//1943274/2147483621/220-10-S99-2
Reference 39: http://fasb.org/us-gaap/role/ref/legacyRef
-Topic 942
-SubTopic 220
-Name Accounting Standards Codification
-Section S99
-Paragraph 1
-Subparagraph (SX 210.9-04(22))
-Publisher FASB
-URI https://asc.fasb.org//1943274/2147483589/942-220-S99-1
| Name: |
us-gaap_NetIncomeLoss |
| Namespace Prefix: |
us-gaap_ |
| Data Type: |
xbrli:monetaryItemType |
| Balance Type: |
credit |
| Period Type: |
duration |
|
| X |
- DefinitionThe cash outflow to acquire asset without physical form usually arising from contractual or other legal rights, excluding goodwill. Reference 1: http://fasb.org/us-gaap/role/ref/legacyRef
-Topic 230
-SubTopic 10
-Name Accounting Standards Codification
-Section 45
-Paragraph 13
-Subparagraph (c)
-Publisher FASB
-URI https://asc.fasb.org//1943274/2147482740/230-10-45-13
| Name: |
us-gaap_PaymentsToAcquireIntangibleAssets |
| Namespace Prefix: |
us-gaap_ |
| Data Type: |
xbrli:monetaryItemType |
| Balance Type: |
credit |
| Period Type: |
duration |
|
| X |
- DefinitionThe cash outflow associated with the acquisition of long-lived, physical assets that are used in the normal conduct of business to produce goods and services and not intended for resale; includes cash outflows to pay for construction of self-constructed assets. Reference 1: http://fasb.org/us-gaap/role/ref/legacyRef
-Topic 230
-SubTopic 10
-Name Accounting Standards Codification
-Section 45
-Paragraph 13
-Subparagraph (c)
-Publisher FASB
-URI https://asc.fasb.org//1943274/2147482740/230-10-45-13
| Name: |
us-gaap_PaymentsToAcquirePropertyPlantAndEquipment |
| Namespace Prefix: |
us-gaap_ |
| Data Type: |
xbrli:monetaryItemType |
| Balance Type: |
credit |
| Period Type: |
duration |
|
| X |
- DefinitionAmount of cash inflow (outflow) from other long-term debt.
| Name: |
us-gaap_ProceedsFromRepaymentsOfOtherLongTermDebt |
| Namespace Prefix: |
us-gaap_ |
| Data Type: |
xbrli:monetaryItemType |
| Balance Type: |
debit |
| Period Type: |
duration |
|
| X |
- DefinitionThe cash inflow from the sale of long-lived, physical assets that are used in the normal conduct of business to produce goods and services and not intended for resale. Reference 1: http://fasb.org/us-gaap/role/ref/legacyRef
-Topic 230
-SubTopic 10
-Name Accounting Standards Codification
-Section 45
-Paragraph 12
-Subparagraph (c)
-Publisher FASB
-URI https://asc.fasb.org//1943274/2147482740/230-10-45-12
| Name: |
us-gaap_ProceedsFromSaleOfPropertyPlantAndEquipment |
| Namespace Prefix: |
us-gaap_ |
| Data Type: |
xbrli:monetaryItemType |
| Balance Type: |
debit |
| Period Type: |
duration |
|
v3.23.3
ORGANIZATION AND BUSINESS BACKGROUND
|
12 Months Ended |
Jul. 31, 2023 |
|---|
| Organization, Consolidation and Presentation of Financial Statements [Abstract] |
|
| ORGANIZATION AND BUSINESS BACKGROUND |
1.
ORGANIZATION AND BUSINESS BACKGROUND
MU
Global Holding Limited is organized as a Nevada limited liability company, incorporated on June 4, 2018. For purposes of consolidated
financial statement presentation, MU Global Holding Limited and its subsidiary are herein referred to as “the Company” or
“we”. The Company business of which planned principal operations are to provide wellness and beauty services to customers
via Company owned outlets, franchised outlets or distribution of our product to third party wellness and beauty salon.
On
June 29, 2018, the Company acquired 100% interest in MU Worldwide Group Limited, a private limited liability company incorporated in
Seychelles and its subsidiary MU Global Holding Limited, a private limited liability company incorporated in Hong Kong. On August 16,
2018, MU Global Holding Limited incorporated a wholly-owned subsidiary in Shanghai, People Republic of China under the name of MU Global
Health Management (Shanghai) Limited.
The
accompanying financial statements have been prepared on a going concern basis, which contemplates the realization of assets and the settlement
of liabilities and commitments in the normal course of business. As reflected in the accompanying financial statements, for the year
ended July 31, 2023, the Company incurred a net loss of $68,827, as of that date, the Company’s current liabilities exceeded its
current assets by $382,433, had an accumulated deficit of $2,458,008, capital deficiency of $583,975 and net operating cash flows of
$63,517 which raise substantial doubt about the Company’s ability to continue as a going concern within one year of the date that
the financial statements are issued. The financial statements do not include any adjustments that might be necessary if the Company is
unable to continue as a going concern.
Details
of the Company’s subsidiaries:
SCHEDULE
OF COMPANY’S SUBSIDIARY
| | |
Company name | |
Place and
date of incorporation | |
Particulars of issued capital | |
Principal
activities | |
Proportional
of ownership interest and voting power held | |
| 1. | |
MU Worldwide Group Limited | |
Seychelles, June 7, 2018 | |
100 shares of ordinary share of US$1 each | |
Investment holding | |
| 100 | % |
| 2. | |
MU Global Holding Limited | |
Hong Kong, January 30, 2018 | |
1 share of ordinary share of HK$1 each | |
Providing SPA and wellness service in Hong Kong | |
| 100 | % |
| 3. | |
MU Global Health Management (Shanghai) Limited | |
Shanghai, August 16, 2018 | |
RMB 7,405,866 | |
Providing SPA and wellness service in China | |
| 100 | % |
MU
GLOBAL HOLDING LIMITED
NOTES
TO CONSOLIDATED FINANCIAL STATEMENTS
FOR
THE YEARS ENDED JULY 31, 2023 AND 2022
(Currency
expressed in United States Dollars (“US$”), except for number of shares)
Business
Overview
MU
Global is a beauty and wellness company, providing SPA and wellness service and also SPA related products to the customers. The services
provided are designed to improve the overall health system and body function.
Since
the establishment, the Company has been focusing to expand in the Chinese market, with other country also under consideration as target
destinations. As an emerging industry in China, the beauty and wellness industry are still in the early stage as there is a huge potential
for the industry to growth significantly. According to a report published by the Chinese State Department, the beauty and wellness industry
of the country is expected reach the market value of China 8 trillion Chinese Yuan by 2020, accounting for 6.5% of the country Gross
Domestic Product (GDP).
In
year 2020, COVID-19 crisis has resulted the sales of the global beauty and wellness industry weak due to consumers have had limited access
to retail outlets and supply chain bottlenecks have reduced product availability. In China, the industry’s February sales fell
up to 80 percent compared with 2019. Nevertheless, based on Mckinsey and Company research report on April 8, 2021, shows that consumers
care deeply about wellness—and that their interest is growing and estimate the global wellness market at more than US$1.5 trillion,
with annual growth of 5 to 10 percent. A rise in both consumer interest and purchasing power presents tremendous opportunities for companies,
particularly as spending on personal wellness rebounds after stagnating or even declining during the COVID-19 crisis
China
has large territory, population, diverse ethnicity and cultural background. As such, it has resulted in different consumer orientations
in different cities and townships across the country, which is particularly challenging to tackle the consumer market with a single business
model.
The
advance in technological development and rise in use of technology in marketing has also intensified the competition, probing the Company
to develop the business models that allow quick penetration and huge coverage of different markets, and also being able to cope with
the swift changes in the consumer market. Thus, the Company is focusing on three key areas as part of the Company’s early development
in the Chinese market.
The
first and most key focus is to enter the regional market through the adoption of franchisee and agent model, which the other parties
are familiar and have deep understanding in the local market, hence its operating strategy is effective and best suited the targeted
region.
Second,
the key strategy is to ensure rapid development of the Omni channel marketing plan which targets to lease out at least ten thousand Stone
Spa Bed (Hot Stone Bath equipment), reducing the time cost for the development of project, and most importantly, working on to spur sales
and revenue growth.
Lastly,
the essential requirement for business success in the Chinese market is to ensure and maintain a clear and transparent business model,
which would result in effective collaboration between the company and its agent/franchisee, and consequently leads to efficient market
operation and a win-win situation between the two parties.
Currently,
the Company operates in the Chinese market with two business models:
| 1. |
Tripartite
co-operation and profit sharing model. |
| |
|
| 2. |
Large-scale
chain agent model |
| |
|
| 3.
|
Direct-
service store model |
|
| X |
- References
+ Details
| Name: |
us-gaap_OrganizationConsolidationAndPresentationOfFinancialStatementsAbstract |
| Namespace Prefix: |
us-gaap_ |
| Data Type: |
xbrli:stringItemType |
| Balance Type: |
na |
| Period Type: |
duration |
|
| X |
- DefinitionThe entire disclosure for organization, consolidation and basis of presentation of financial statements disclosure. Reference 1: http://www.xbrl.org/2003/role/disclosureRef
-Topic 946
-SubTopic 10
-Name Accounting Standards Codification
-Section 50
-Paragraph 1
-Publisher FASB
-URI https://asc.fasb.org//1943274/2147480424/946-10-50-1
Reference 2: http://www.xbrl.org/2003/role/disclosureRef
-Topic 946
-SubTopic 10
-Name Accounting Standards Codification
-Section 50
-Paragraph 2
-Publisher FASB
-URI https://asc.fasb.org//1943274/2147480424/946-10-50-2
Reference 3: http://fasb.org/us-gaap/role/ref/legacyRef
-Topic 810
-Name Accounting Standards Codification
-Publisher FASB
-URI https://asc.fasb.org//810/tableOfContent
Reference 4: http://fasb.org/us-gaap/role/ref/legacyRef
-Topic 205
-Name Accounting Standards Codification
-Publisher FASB
-URI https://asc.fasb.org//205/tableOfContent
| Name: |
us-gaap_OrganizationConsolidationAndPresentationOfFinancialStatementsDisclosureTextBlock |
| Namespace Prefix: |
us-gaap_ |
| Data Type: |
dtr-types:textBlockItemType |
| Balance Type: |
na |
| Period Type: |
duration |
|
v3.23.3
SUMMARY OF SIGNIFICANT ACCOUNTING POLICIES
|
12 Months Ended |
Jul. 31, 2023 |
|---|
| Accounting Policies [Abstract] |
|
| SUMMARY OF SIGNIFICANT ACCOUNTING POLICIES |
2.
SUMMARY OF SIGNIFICANT ACCOUNTING POLICIES
The
accompanying consolidated financial statements reflect the application of certain significant accounting policies as described in this
note and elsewhere in the accompanying consolidated financial statements and notes.
Basis
of presentation
These
accompanying consolidated financial statements have been prepared in accordance with generally accepted accounting principles in the
United States of America (“US GAAP”).
The
Company has adopted its fiscal year-end to be July 31.
Basis
of consolidation
The
consolidated financial statements include the accounts of the Company and its subsidiaries. All inter-company accounts and transactions
have been eliminated upon consolidation.
MU
GLOBAL HOLDING LIMITED
NOTES
TO CONSOLIDATED FINANCIAL STATEMENTS
FOR
THE YEARS ENDED JULY 31, 2023 AND 2022
(Currency
expressed in United States Dollars (“US$”), except for number of shares)
Use
of estimates
Management
uses estimates and assumptions in preparing these financial statements in accordance with US GAAP. Those estimates and assumptions affect
the reported amounts of assets and liabilities, the disclosure of contingent assets and liabilities in the balance sheets, and the reported
revenue and expenses during the periods reported. Actual results may differ from these estimates.
Revenue
recognition
Financial
Accounting Standards Board, or FASB, issued ASC 606. The standard is a comprehensive new revenue recognition model that requires revenue
to be recognized in a manner to depict the transfer of goods or services to a customer at an amount that reflects the consideration expected
to be received in exchange for those goods or services.
Revenue
is measured at the fair value of the consideration received or receivable, net of discounts and taxes applicable to the revenue. The
Company derives its revenue from provision of wellness and beauty services to customers via Company owned outlets, franchised outlets
or distribution of our product to third party wellness and beauty salon.
Cost
of revenue
Cost
of revenue includes the cost of services and product incurred to provide wellness and beauty services and purchase of products.
Cash
and cash equivalents
Cash
and cash equivalents are carried at cost and represent cash on hand, demand deposits placed with banks or other financial institutions
and all highly liquid investments with an original maturity of three months or less as of the purchase date of such investments.
Property,
plant and equipment
Property,
plant and equipment are stated at cost less accumulated depreciation and accumulated impairment losses, if any. Depreciation is calculated
on the straight-line basis over the following expected useful lives from the date on which they become fully operational:
SCHEDULE
OF PROPERTY, PLANT AND EQUIPMENT ESTIMATED LIFE
| Classification |
|
Estimated
useful life |
| Leasable
equipment |
|
5
years |
| Computer
hardware and software |
|
3
years |
| Office
equipment |
|
3
years |
| Outlet
design fee and equipment |
|
3
years |
| Application
development fee |
|
3
years |
Expenditures
for maintenance and repairs are expensed as incurred. The gain or loss on the disposal of property, plant and equipment is the difference
between the net sales proceeds and the carrying amount of the relevant assets and is recognized in the Consolidated Statements of Operations
and Comprehensive Loss.
Impairment
of long-live assets
Long-lived
assets primarily include trademark of the Company. In accordance with the provision of ASC Topic 360, Impairment or Disposal of Long-Lived
Assets, the Company generally conducts its annual impairment evaluation to its long-lived assets, usually in the fourth quarter of
each fiscal year, or more frequently if indicators of impairment exist, such as significant sustained change in the business climate.
The recoverability of long-lived assets is measured at the lowest level group. If the total of the expected undiscounted future net cash
flows is less than the carrying amount of the asset, a loss is recognized for the difference between the fair value and carrying amount
of the asset.
MU
GLOBAL HOLDING LIMITED
NOTES
TO CONSOLIDATED FINANCIAL STATEMENTS
FOR
THE YEARS ENDED JULY 31, 2023 AND 2022
(Currency
expressed in United States Dollars (“US$”), except for number of shares)
Leases
The
Company recognizes lease payments for its short-term lease on a straight-line basis over the lease term in accordance with ASC 842.
The
right-of-use asset is initially measured at cost, which comprises the initial amount of the lease liability adjusted for lease payments
made at or before the lease commencement date, plus any initial direct costs incurred less any lease incentives received. Costs associated
with operating lease assets are recognized on a straight-line basis within operating expenses over the term of the lease.
In
determining the present value of the unpaid lease payments, ASC 842 requires a lessee to discount its unpaid lease payments using the
interest rate implicit in the lease or, if that rate cannot be readily determined, its incremental borrowing rate. As most of the Company
leases do not provide an implicit rate, the Company uses its incremental borrowing rate as the discount rate for the lease. The Company
incremental borrowing rate is estimated to approximate the interest rate on a collateralized basis with similar terms and payments.
Inventories
Inventories
consisting of products available for sell, are stated at the lower of cost or market value. Cost of inventory is determined using the
first-in, first-out (FIFO) method. Inventory reserve is recorded to write down the cost of inventory to the estimated market value due
to slow-moving merchandise and damaged goods, which is dependent upon factors such as historical and forecasted consumer demand, and
promotional environment. The Company takes ownership, risks and rewards of the products purchased. Write downs are recorded in cost of
revenues in the Consolidated Statements of Operations and Comprehensive Loss.
Income
taxes
Income
taxes are determined in accordance with the provisions of ASC Topic 740, “Income Taxes” (“ASC 740”). Under this
method, deferred tax assets and liabilities are recognized for the future tax consequences attributable to differences between the financial
statement carrying amounts of existing assets and liabilities and their respective tax basis. Deferred tax assets and liabilities are
measured using enacted income tax rates expected to apply to taxable income in the periods in which those temporary differences are expected
to be recovered or settled. Any effect on deferred tax assets and liabilities of a change in tax rates is recognized in income in the
period that includes the enactment date.
ASC
740 prescribes a comprehensive model for how companies should recognize, measure, present, and disclose in their financial statements
uncertain tax positions taken or expected to be taken on a tax return. Under ASC 740, tax positions must initially be recognized in the
financial statements when it is more likely than not the position will be sustained upon examination by the tax authorities. Such tax
positions must initially and subsequently be measured as the largest amount of tax benefit that has a greater than 50% likelihood of
being realized upon ultimate settlement with the tax authority assuming full knowledge of the position and relevant facts.
The
Company conducts major businesses in China and is subject to tax in this jurisdiction. As a result of its business activities, the Company
will file tax returns that are subject to examination by the foreign tax authority.
Going
concern
The
accompanying financial statements have been prepared using the going concern basis of accounting, which contemplates the realization
of assets and the satisfaction of liabilities in the normal course of business.
For
the year ended July 31, 2023, the Company has generated revenue of $146,252 and continuously incurred a net loss of $68,827. As of July
31, 2023, the Company suffered an accumulated deficit of $2,458,008, capital deficiency of $583,975 and negative operating cash flows
of $63,517. The Company’s ability to continue as a going concern is dependent upon improving the profitability and the continuing
financial support from its shareholders and director. Management believes the existing shareholders, director or external financing will
provide the additional cash to meet the Company’s obligations as they become due.
These
and other factors raise substantial doubt about the Company’s ability to continue as a going concern. These financial statements
do not include any adjustments to reflect the possible future effects on the recoverability and classification of assets or the amounts
and classification of liabilities that may result in the Company not being able to continue as a going concern.
MU
GLOBAL HOLDING LIMITED
NOTES
TO CONSOLIDATED FINANCIAL STATEMENTS
FOR
THE YEARS ENDED JULY 31, 2023 AND 2022
(Currency
expressed in United States Dollars (“US$”), except for number of shares)
Net
loss per share
The
Company calculates net loss per share in accordance with ASC Topic 260 “Earnings Per Share”. Basic loss per share
is computed by dividing the net loss by the weighted average number of common shares outstanding during the period. Diluted loss per
share is computed similar to basic loss per share except that the denominator is increased to include the number of additional common
shares that would have been outstanding if the potential common stock equivalents had been issued and if the additional common shares
were dilutive.
Foreign
currencies translation
Transactions
denominated in currencies other than the functional currency are translated into the functional currency at the exchange rates prevailing
at the dates of the transaction. Monetary assets and liabilities denominated in currencies other than the functional currency are translated
into the functional currency using the applicable exchange rates at the balance sheet dates. The resulting exchange differences are recorded
in the Consolidated Statements of Operations and Comprehensive loss.
The
functional currency of the parent Company is United States dollar and the functional currency of the subsidiaries MU Worldwide Group
Limited (Seychelles) and MU Global Holding Limited (Hong Kong) is United States dollar. MU Global Health Management (Shanghai) Limited
is in Renminbi.
The
reporting currency of the Company and its subsidiary is United States Dollars (“US$”) and the accompanying financial statements
have been expressed in US$.
In
general, for consolidation purposes, assets and liabilities of its subsidiaries whose functional currency is not US$ are translated into
US$, in accordance with ASC Topic 830-30, “Translation of Financial Statement”, using the exchange rate on the balance
sheet date. Revenues and expenses are translated at average rates prevailing during the period. The gains and losses resulting from translation
of financial statements of foreign subsidiary are recorded as a separate component of accumulated other comprehensive loss within the
statements of stockholders’ equity.
Translation
of amounts from RMB, TWD and HK$ into US$1 has been made at the following exchange rates for the respective periods:
SCHEDULE
OF FOREIGN EXCHANGE RATES TRANSLATION
| | |
As of and for the year ended July 31, | |
| | |
2023 | | |
2022 | |
| Year-end RMB : US$1 exchange rate | |
| 7.136 | | |
| 6.744 | |
| Year-average RMB : US$1 exchange rate | |
| 6.989 | | |
| 6.476 | |
| Year-end HK$ : US$1 exchange rate | |
| 7.799 | | |
| 7.850 | |
| Year-average HK$ : US$1 exchange rate | |
| 7.835 | | |
| 7.811 | |
| Year-end TWD : US$1 exchange rate | |
| 31.461 | | |
| 30.044 | |
| Year-average TWD : US$1 exchange rate | |
| 30.805 | | |
| 28.500 | |
Related
parties
Parties,
which can be a corporation or individual, are considered to be related if the Company has the ability, directly or indirectly, to control
the other party or exercise significant influence over the other party in making financial and operating decisions. Companies are also
considered to be related if they are subject to common control or common significant influence.
MU
GLOBAL HOLDING LIMITED
NOTES
TO CONSOLIDATED FINANCIAL STATEMENTS
FOR
THE YEARS ENDED JULY 31, 2023 AND 2022
(Currency
expressed in United States Dollars (“US$”), except for number of shares)
Fair
value of financial instruments:
The
carrying value of the Company’s financial instruments: cash and cash equivalents, subscription receivables, prepayment and deposits,
accounts payable, and other payables and accrued liabilities approximate at their fair values because of the short-term nature of these
financial instruments.
The
Company also follows the guidance of the ASC Topic 820-10, “Fair Value Measurements and Disclosures” (“ASC 820-10”),
with respect to financial assets and liabilities that are measured at fair value. ASC 820-10 establishes a three-tier fair value hierarchy
that prioritizes the inputs used in measuring fair value as follows:
| |
Level
1: Observable inputs such as quoted prices in active markets; |
| |
|
| |
Level
2: Inputs, other than the quoted prices in active markets, that are observable either directly or indirectly; and |
| |
|
| |
Level
3: Unobservable inputs in which there is little or no market data, which require the reporting entity to develop its own assumptions. |
Recently
Adopted Accounting Standards
In
June 2016, the FASB issued Accounting Standards Update No. 2016-13, Financial Instruments – Credit Losses (Topics 326): Measurement
of Credit Losses on Financial Instruments, which introduced the expected credit losses methodology for the measurement of credit losses
on financial assets measured at amortized cost basis, replacing the previous incurred loss methodology. In November 2019, the FASB issued
ASU 2019-10 highlighted the adoption timeline. For smaller reporting entities, Topic 326 is effective for annual periods beginning after
December 15, 2022, including interim period within those fiscal years, of which is effective for the Company on January 1, 2023.
Credit
loss rate is determined by historical collection based on aging schedule, adjusted for current conditions using reasonable and supportable
forecast. Based on the aging categorization and the adjusted loss per category, an allowance for credit losses is calculated by multiplying
the adjusted loss rate with the amortized cost in the respective age category.
Recent
accounting pronouncements
The
Company has implemented all new accounting pronouncements that are in effect. These pronouncements did not have any material impact on
the financial statements unless otherwise disclosed, and the Company does not believe that there are any other new accounting pronouncements
that have been issued that might have a material impact on its financial position or results of operations.
MU
GLOBAL HOLDING LIMITED
NOTES
TO CONSOLIDATED FINANCIAL STATEMENTS
FOR
THE YEARS ENDED JULY 31, 2023 AND 2022
(Currency
expressed in United States Dollars (“US$”), except for number of shares)
|
| X |
- References
+ Details
| Name: |
us-gaap_AccountingPoliciesAbstract |
| Namespace Prefix: |
us-gaap_ |
| Data Type: |
xbrli:stringItemType |
| Balance Type: |
na |
| Period Type: |
duration |
|
| X |
- DefinitionThe entire disclosure for all significant accounting policies of the reporting entity. Reference 1: http://www.xbrl.org/2003/role/disclosureRef
-Topic 235
-SubTopic 10
-Name Accounting Standards Codification
-Section 50
-Paragraph 1
-Publisher FASB
-URI https://asc.fasb.org//1943274/2147483426/235-10-50-1
Reference 2: http://fasb.org/us-gaap/role/ref/legacyRef
-Topic 235
-Name Accounting Standards Codification
-Publisher FASB
-URI https://asc.fasb.org//235/tableOfContent
| Name: |
us-gaap_SignificantAccountingPoliciesTextBlock |
| Namespace Prefix: |
us-gaap_ |
| Data Type: |
dtr-types:textBlockItemType |
| Balance Type: |
na |
| Period Type: |
duration |
|
v3.23.3
COMMON STOCK
|
12 Months Ended |
Jul. 31, 2023 |
|---|
| Equity [Abstract] |
|
| COMMON STOCK |
3.
COMMON STOCK
On
June 4, 2018, our Chief Executive Officer, Ms. Niu Yen-Yen subscribed 100,000 shares of restricted common stock of the Company at par
value of $0.0001 per share. The monies from this transaction, which totalled $10, went to the Company to be used as initial working capital.
On
July 6, 2018, Ms. Niu Yen-Yen and Server Int’l Co., Ltd. subscribed 25,000,000 and 11,000,000 restricted shares of common stock,
respectively, of the Company, at par value of $0.0001 per share. The monies from these transactions, which totalled $3,600, went to the
Company to be used as initial working capital. Server Int’l Co., Ltd. is controlled entirely by Ms. Niu Yen-Yen.
On
July 7, 2018, Chang Chun-Ying and Chang Su-Fen subscribed 4,300,000 and 5,000,000 restricted shares of common stock, respectively, of
the Company, at par value of $0.0001 per share. The monies from these transactions, which totalled $930, went to the Company to be used
as initial working capital.
On
July 9, 2018, GreenPro Asia Strategic SPC and GreenPro Venture Capital Limited subscribed 2,835,000 and 2,165,000 restricted shares of
common stock of the Company, respectively, at par value of $0.0001 per share. The monies from these transactions, which totalled $500,
went to the Company to be used as initial working capital.
From
July 9, 2018 to July 10, 2018 the Company issued a total of 2,150,000 shares of restricted common stock to three non-US residents. Shares
were sold at par value, $0.0001 per share. Total proceeds from these shares totalled $215 and went to the Company to be used as initial
working capital.
On
July 10, 2018, Server Int’l Co., Ltd, a Company solely controlled and owned by the CEO, transferred 1,500,000 shares of common
stock to 8 non-US residents.
On
July 11, 2018 the Company issued a total of 710,000 shares of restricted common stock to two non-US residents at a price of $0.03 per
share. Total proceeds from these sales of shares totalled $21,300 and went to the Company to be used as initial working capital.
On
July 25, 2018 the Company issued a total of 995,000 shares of restricted common stock to ten non-US residents at a price of $0.03 per
share. Total proceeds from these sales of shares totalled $29,850 and went to the Company to be used as initial working capital.
On
July 26, 2018 the Company issued 250,000 shares of restricted common stock to one non-US resident at a price of $0.20 per share. Total
proceeds from these sales of shares totalled $50,000 and went to the Company to be used as initial working capital.
On
July 31, 2018 Dezign Format Pte Ltd and Cheng Young-Chien each subscribed 2,000,000 restricted shares of common stock of the Company,
at $0.20 per share, for total consideration of $800,000. Proceeds went to the Company to be used as initial working capital.
From
August 1, 2018 to December 13, 2018, Ms. Niu Yen-Yen, the CEO of the Company, transferred 1,557,800 shares of common stock to 16 non-US
residents.
On
May 7, 2019, the convertible promissory note issued by the Company amounted $779,125 to 45 accredited investors who reside in Taiwan
with the conversion price of $1 per share have been converted to 779,125 shares of common stock of the company after the S-1 registration
statement was declared effective on May 6, 2019.
From
May 14, 2019 to July 31, 2019, the Company issued 150,317 shares of common stock at a price of $1.00 per share through the Initial Public
Offering (IPO) to 36 non-US residents.
From
August 1, 2020 to July 31, 2021, Ms. Niu Yen-Yen, the CEO of the Company, had 395,000 shares of common stock transferred from 3 non-US
residents and had sold 3,364,921 shares of common stock to 20 non-US residents.
From
August 1, 2021 to July 31, 2022, Ms. Niu Yen-Yen, the CEO of the Company, had 55,522 shares of common stock transferred from 2 non-US
residents and had sold 6,800,000 shares of common stock to 3 non-US residents.
From
August 1, 2022 to July 31, 2023, Ms. Niu Yen-Yen had sold 610,000 shares of common stock to 5 non-US residents.
As
of July 31, 2023, the Company has an issued and outstanding common share of 59,434,838.
MU
GLOBAL HOLDING LIMITED
NOTES
TO CONSOLIDATED FINANCIAL STATEMENTS
FOR
THE YEARS ENDED JULY 31, 2023 AND 2022
(Currency
expressed in United States Dollars (“US$”), except for number of shares)
|
| X |
- References
+ Details
| Name: |
us-gaap_EquityAbstract |
| Namespace Prefix: |
us-gaap_ |
| Data Type: |
xbrli:stringItemType |
| Balance Type: |
na |
| Period Type: |
duration |
|
| X |
- DefinitionThe entire disclosure for equity. Reference 1: http://www.xbrl.org/2003/role/disclosureRef
-Topic 505
-SubTopic 10
-Name Accounting Standards Codification
-Section 50
-Paragraph 13
-Subparagraph (b)
-Publisher FASB
-URI https://asc.fasb.org//1943274/2147481112/505-10-50-13
Reference 2: http://www.xbrl.org/2003/role/disclosureRef
-Topic 505
-SubTopic 10
-Name Accounting Standards Codification
-Section 50
-Paragraph 13
-Subparagraph (h)
-Publisher FASB
-URI https://asc.fasb.org//1943274/2147481112/505-10-50-13
Reference 3: http://www.xbrl.org/2003/role/disclosureRef
-Topic 505
-SubTopic 10
-Name Accounting Standards Codification
-Section 50
-Paragraph 14
-Subparagraph (b)
-Publisher FASB
-URI https://asc.fasb.org//1943274/2147481112/505-10-50-14
Reference 4: http://www.xbrl.org/2003/role/disclosureRef
-Topic 946
-SubTopic 235
-Name Accounting Standards Codification
-Section 50
-Paragraph 2
-Subparagraph (a)
-Publisher FASB
-URI https://asc.fasb.org//1943274/2147481062/946-235-50-2
Reference 5: http://www.xbrl.org/2003/role/disclosureRef
-Topic 946
-SubTopic 235
-Name Accounting Standards Codification
-Section 50
-Paragraph 2
-Subparagraph (d)
-Publisher FASB
-URI https://asc.fasb.org//1943274/2147481062/946-235-50-2
Reference 6: http://www.xbrl.org/2003/role/disclosureRef
-Topic 946
-SubTopic 505
-Name Accounting Standards Codification
-Section 50
-Paragraph 6
-Publisher FASB
-URI https://asc.fasb.org//1943274/2147481004/946-505-50-6
Reference 7: http://www.xbrl.org/2003/role/disclosureRef
-Topic 815
-SubTopic 40
-Name Accounting Standards Codification
-Section 50
-Paragraph 6
-Subparagraph (a)
-Publisher FASB
-URI https://asc.fasb.org//1943274/2147480237/815-40-50-6
Reference 8: http://www.xbrl.org/2003/role/disclosureRef
-Topic 505
-SubTopic 10
-Name Accounting Standards Codification
-Section S99
-Paragraph 1
-Subparagraph (SX 210.3-04)
-Publisher FASB
-URI https://asc.fasb.org//1943274/2147480008/505-10-S99-1
Reference 9: http://www.xbrl.org/2003/role/disclosureRef
-Topic 235
-SubTopic 10
-Name Accounting Standards Codification
-Section S99
-Paragraph 1
-Subparagraph (SX 210.4-08(e)(1))
-Publisher FASB
-URI https://asc.fasb.org//1943274/2147480678/235-10-S99-1
Reference 10: http://fasb.org/us-gaap/role/ref/legacyRef
-Topic 505
-Name Accounting Standards Codification
-Publisher FASB
-URI https://asc.fasb.org//505/tableOfContent
Reference 11: http://www.xbrl.org/2003/role/disclosureRef
-Topic 505
-SubTopic 10
-Name Accounting Standards Codification
-Section 50
-Paragraph 13
-Publisher FASB
-URI https://asc.fasb.org//1943274/2147481112/505-10-50-13
Reference 12: http://www.xbrl.org/2003/role/disclosureRef
-Topic 505
-SubTopic 10
-Name Accounting Standards Codification
-Section 50
-Paragraph 13
-Subparagraph (g)
-Publisher FASB
-URI https://asc.fasb.org//1943274/2147481112/505-10-50-13
Reference 13: http://www.xbrl.org/2003/role/disclosureRef
-Topic 505
-SubTopic 10
-Name Accounting Standards Codification
-Section 50
-Paragraph 13
-Subparagraph (i)
-Publisher FASB
-URI https://asc.fasb.org//1943274/2147481112/505-10-50-13
Reference 14: http://www.xbrl.org/2003/role/disclosureRef
-Topic 505
-SubTopic 10
-Name Accounting Standards Codification
-Section 50
-Paragraph 14
-Subparagraph (a)
-Publisher FASB
-URI https://asc.fasb.org//1943274/2147481112/505-10-50-14
Reference 15: http://www.xbrl.org/2003/role/disclosureRef
-Topic 505
-SubTopic 10
-Name Accounting Standards Codification
-Section 50
-Paragraph 14
-Subparagraph (c)
-Publisher FASB
-URI https://asc.fasb.org//1943274/2147481112/505-10-50-14
Reference 16: http://www.xbrl.org/2003/role/disclosureRef
-Topic 505
-SubTopic 10
-Name Accounting Standards Codification
-Section 50
-Paragraph 16
-Subparagraph (b)
-Publisher FASB
-URI https://asc.fasb.org//1943274/2147481112/505-10-50-16
Reference 17: http://www.xbrl.org/2003/role/disclosureRef
-Topic 505
-SubTopic 10
-Name Accounting Standards Codification
-Section 50
-Paragraph 18
-Subparagraph (a)
-Publisher FASB
-URI https://asc.fasb.org//1943274/2147481112/505-10-50-18
Reference 18: http://www.xbrl.org/2003/role/disclosureRef
-Topic 505
-SubTopic 10
-Name Accounting Standards Codification
-Section 50
-Paragraph 18
-Subparagraph (b)
-Publisher FASB
-URI https://asc.fasb.org//1943274/2147481112/505-10-50-18
Reference 19: http://www.xbrl.org/2003/role/disclosureRef
-Topic 505
-SubTopic 10
-Name Accounting Standards Codification
-Section 50
-Paragraph 18
-Subparagraph (d)
-Publisher FASB
-URI https://asc.fasb.org//1943274/2147481112/505-10-50-18
| Name: |
us-gaap_StockholdersEquityNoteDisclosureTextBlock |
| Namespace Prefix: |
us-gaap_ |
| Data Type: |
dtr-types:textBlockItemType |
| Balance Type: |
na |
| Period Type: |
duration |
|
v3.23.3
PROPERTY, PLANT AND EQUIPMENT
|
12 Months Ended |
Jul. 31, 2023 |
|---|
| Property, Plant and Equipment [Abstract] |
|
| PROPERTY, PLANT AND EQUIPMENT |
4.
PROPERTY, PLANT AND EQUIPMENT
SCHEDULE OF PROPERTY, PLANT AND EQUIPMENT
| | |
As of
July 31, 2023 | | |
As of
July 31, 2022 | |
| | |
(Audited) | | |
(Audited) | |
| Computer hardware and software | |
$ | 129,301 | | |
$ | 129,301 | |
| Office equipment | |
| 120,569 | | |
| 120,569 | |
| Leasable equipment1 | |
| 216,378 | | |
| 229,405 | |
| Outlet design fee and equipment | |
| 16,763 | | |
| 16,763 | |
| Application development fee | |
| 37,413 | | |
| 37,413 | |
| Total | |
| 520,424 | | |
| 533,451 | |
| Accumulated depreciation2 | |
| (395,140 | ) | |
| (401,797 | ) |
| Impairment | |
| (143,182 | ) | |
| (149,552 | ) |
| Foreign currency translation adjustment | |
| 17,898 | | |
| 17,898 | |
| Property, plant and equipment, net | |
$ | - | | |
| - | |
| 1 |
For
the year ended July 31, 2023, $13,027 of equipment was disposed. |
| 2 |
Depreciation
expense for the year ended July 31, 2023 and July 31, 2022 was $0 and $94,600 respectively. |
WRITE
OFF OF PROPERTY, PLANT AND EQUIPMENT
SCHEDULE OF WRITE OFF OF PROPERTY, PLANT AND EQUIPMENT
| | |
| | |
| |
| | |
As of July 31, 2023 (Audited) | | |
As of July 31, 2022 (Audited) | |
| Write off of property and equipment | |
$ | - | | |
$ | 1,686 | |
| Accumulated depreciation | |
| - | | |
| (1,624 | ) |
| Foreign currency translation adjustment | |
| - | | |
| 38 | |
| Total write off of property and equipment | |
$ | - | | |
$ | 100 | |
DISPOSAL
OF PROPERTY, PLANT AND EQUIPMENT
SCHEDULE OF DISPOSAL OF PROPERTY, PLANT AND EQUIPMENT
| | |
| | |
| |
| | |
As of July 31, 2023 (Audited) | | |
As of July 31, 2022 (Audited) | |
| Proceed from disposal of property, plant and equipment | |
$ | 20,514 | | |
$ | 44,340 | |
| Disposal of equipment at cost | |
| - | | |
| (27,726 | ) |
| Disposal of equipment written off at net book value | |
| (6 | ) | |
| - | |
| Disposal of equipment impaired at net book value | |
| (6,364 | ) | |
| - | |
| Accumulated depreciation | |
| - | | |
| 10,965 | |
| Foreign currency translation adjustment | |
| - | | |
| (40 | ) |
| Total gain on disposal | |
$ | 14,144 | | |
$ | 27,539 | |
|
| X |
- References
+ Details
| Name: |
us-gaap_PropertyPlantAndEquipmentAbstract |
| Namespace Prefix: |
us-gaap_ |
| Data Type: |
xbrli:stringItemType |
| Balance Type: |
na |
| Period Type: |
duration |
|
| X |
- DefinitionThe entire disclosure for long-lived, physical asset used in normal conduct of business and not intended for resale. Includes, but is not limited to, work of art, historical treasure, and similar asset classified as collections. Reference 1: http://fasb.org/us-gaap/role/ref/legacyRef
-Topic 360
-Name Accounting Standards Codification
-Publisher FASB
-URI https://asc.fasb.org//360/tableOfContent
Reference 2: http://www.xbrl.org/2003/role/disclosureRef
-Name Accounting Standards Codification
-Section 50
-Paragraph 6
-SubTopic 360
-Topic 958
-Publisher FASB
-URI https://asc.fasb.org//1943274/2147480321/958-360-50-6
Reference 3: http://www.xbrl.org/2003/role/disclosureRef
-Name Accounting Standards Codification
-Section 50
-Paragraph 1
-Subparagraph (d)
-SubTopic 360
-Topic 958
-Publisher FASB
-URI https://asc.fasb.org//1943274/2147480321/958-360-50-1
Reference 4: http://www.xbrl.org/2003/role/disclosureRef
-Name Accounting Standards Codification
-Section 50
-Paragraph 7
-SubTopic 360
-Topic 958
-Publisher FASB
-URI https://asc.fasb.org//1943274/2147480321/958-360-50-7
| Name: |
us-gaap_PropertyPlantAndEquipmentDisclosureTextBlock |
| Namespace Prefix: |
us-gaap_ |
| Data Type: |
dtr-types:textBlockItemType |
| Balance Type: |
na |
| Period Type: |
duration |
|
v3.23.3
LEASE
|
12 Months Ended |
Jul. 31, 2023 |
|---|
| Lease |
|
| LEASE |
5.
LEASE
As
of November 6, 2021, the Company recognized approximately US$11,581
lease liability as well as right-of-use asset
for all leases at the commencement date. Lease liabilities are measured at present value of the sum of remaining rental payments as of
November 6, 2021, with discounted rate of 4.35%
adopted from “Zhao Shang bank” of China as a reference for discount rate.
MU
GLOBAL HOLDING LIMITED
NOTES
TO CONSOLIDATED FINANCIAL STATEMENTS
FOR
THE YEARS ENDED JULY 31, 2023 AND 2022
(Currency
expressed in United States Dollars (“US$”), except for number of shares)
A
single lease cost is recognized over the lease term on a generally straight-line basis. All cash payments of operating lease cost are
classified within operating activities in the statement of cash flows.
The
initial recognition of operating lease right and lease liability as follow:
SCHEDULE OF RECOGNITION OF OPERATING LEASE RIGHT AND LEASE LIABILITY
| | |
| | |
| Gross lease payable | |
$ | 12,048 | |
| Less: Imputed interest | |
| (467 | ) |
| Initial recognition | |
$ | 11,581 | |
| Less: Remeasurement of existing lease | |
| (843 | ) |
| Balance | |
$ | 10,738 | |
As
of July 31, 2023 and July 31, 2022 operating lease right of use asset as follow:
SCHEDULE OF OPERATING LEASE RIGHT OF USE ASSET
| | |
As of July 31, 2023 (Audited) | | |
As of July 31, 2022 (Audited) | |
| Balance | |
| 6,267 | | |
| 12,966 | |
| Less: Termination of lease | |
| - | | |
| (10,285 | ) |
| Add: New operating lease liability | |
| 5,223 | | |
| 10,738 | |
| Foreign exchange translation loss | |
| (246 | ) | |
| (407 | ) |
| Amortization | |
| (4,837 | ) | |
| (6,745 | ) |
| Balance end of the year | |
$ | 6,407 | | |
$ | 6,267 | |
As
of July 31, 2023 and July 31, 2022 operating lease liability as follow:
SCHEDULE
OF OPERATING LEASE LIABILITY
| | |
As of July 31, 2023 (Audited) | | |
As of July 31, 2022 (Audited) | |
| As of August 1 | |
$ | 6,559 | | |
$ | 2,647 | |
| Less: Termination of lease | |
| - | | |
| (2,647 | ) |
| Add: New operating lease liability | |
| 5,223 | | |
| 11,581 | |
| Less: Remeasurement of existing lease | |
| - | | |
| (843 | ) |
| Less: Gross repayment | |
| (5,509 | ) | |
| (3,892 | ) |
| Add: Imputed interest | |
| 176 | | |
| 278 | |
| Foreign exchange translation loss | |
| (250 | ) | |
| (565 | ) |
| Balance end of the period/year | |
$ | 6,199 | | |
$ | 6,559 | |
For
the year ended July 31, 2023, the amortization of the operating lease right of use asset was $4,837 while for year ended July 31, 2022,
the amortization of the operating lease right of use asset was $6,745.
MU
GLOBAL HOLDING LIMITED
NOTES
TO CONSOLIDATED FINANCIAL STATEMENTS
FOR
THE YEARS ENDED JULY 31, 2023 AND 2022
(Currency
expressed in United States Dollars (“US$”), except for number of shares)
Maturities
of operating lease obligation as follow:
SCHEDULE
OF MATURITIES OF OPERATING LEASE OBLIGATION
| | |
| | |
| Year ending | |
| | |
| July 31, 2024 (12 months) | |
| 5,223 | |
| October 31, 2024 (3 months) | |
| 976 | |
| Total | |
$ | 6,199 | |
Other
information:
SCHEDULE
OF OTHER INFORMATION
| | |
Year ended | | |
Year ended | |
| | |
July 31, 2023 | | |
July 31, 2022 | |
| | |
(Audited) | | |
(Audited) | |
| Cash paid for amounts included in the measurement of lease liabilities: | |
| | | |
| | |
| Operating cash flow from operating lease | |
$ | 5,395 | | |
$ | 6,185 | |
| Right-of-use assets obtained in exchange for operating lease liabilities | |
$ | 6,407 | | |
$ | 6,267 | |
| Remaining lease term for operating lease (years) | |
| 1.25 | | |
| 1.25 | |
| Weighted average discount rate for operating lease | |
| 4.35 | % | |
| 4.35 | % |
Lease
expenses were $176 and $411 during the year ended July 31, 2023 and July 31, 2022 respectively.
|
| X |
- References
+ Details
| Name: |
MUGH_DisclosureLeaseAbstract |
| Namespace Prefix: |
MUGH_ |
| Data Type: |
xbrli:stringItemType |
| Balance Type: |
na |
| Period Type: |
duration |
|
| X |
- DefinitionThe entire disclosure for operating leases of lessee. Includes, but is not limited to, description of operating lease and maturity analysis of operating lease liability. Reference 1: http://www.xbrl.org/2003/role/disclosureRef
-Topic 842
-SubTopic 20
-Name Accounting Standards Codification
-Publisher FASB
-URI https://asc.fasb.org//842-20/tableOfContent
| Name: |
us-gaap_LesseeOperatingLeasesTextBlock |
| Namespace Prefix: |
us-gaap_ |
| Data Type: |
dtr-types:textBlockItemType |
| Balance Type: |
na |
| Period Type: |
duration |
|
v3.23.3
PATENT AND TRADEMARK
|
12 Months Ended |
Jul. 31, 2023 |
|---|
| Goodwill and Intangible Assets Disclosure [Abstract] |
|
| PATENT AND TRADEMARK |
6.
PATENT AND TRADEMARK
SCHEDULE
OF TRADEMARK
| | |
As of | | |
As of | |
| | |
July 31, 2023 | | |
July 31, 2022 | |
| | |
(Audited) | | |
(Audited) | |
| Patent and trademark1 | |
$ | 35,988 | | |
$ | 32,404 | |
| Accumulated amortization | |
| (6,986 | ) | |
| (6,986 | ) |
| Impairment | |
| (28,976 | ) | |
| (25,392 | ) |
| Foreign currency translation adjustment | |
| (26 | ) | |
| (26 | ) |
| Trademark, net | |
$ | - | | |
$ | - | |
| 1 |
The
trademarks are held under the Company’s subsidiaries in Hong Kong and Shanghai, China. |
Amortization
expense for the year ended July 31, 2023 and July 31, 2022 was $0 and $1,561 respectively.
|
| X |
- References
+ Details
| Name: |
us-gaap_GoodwillAndIntangibleAssetsDisclosureAbstract |
| Namespace Prefix: |
us-gaap_ |
| Data Type: |
xbrli:stringItemType |
| Balance Type: |
na |
| Period Type: |
duration |
|
| X |
- DefinitionThe entire disclosure for all or part of the information related to intangible assets. Reference 1: http://www.xbrl.org/2003/role/disclosureRef
-Topic 350
-SubTopic 30
-Name Accounting Standards Codification
-Publisher FASB
-URI https://asc.fasb.org//350-30/tableOfContent
| Name: |
us-gaap_IntangibleAssetsDisclosureTextBlock |
| Namespace Prefix: |
us-gaap_ |
| Data Type: |
dtr-types:textBlockItemType |
| Balance Type: |
na |
| Period Type: |
duration |
|
v3.23.3
PREPAYMENTS AND DEPOSITS
|
12 Months Ended |
Jul. 31, 2023 |
|---|
| Prepayments And Deposits |
|
| PREPAYMENTS AND DEPOSITS |
7.
PREPAYMENTS AND DEPOSITS
SCHEDULE
OF PREPAYMENTS AND DEPOSITS
| | |
As of | | |
As of | |
| | |
July 31, 2023 | | |
July 31, 2022 | |
| | |
(Audited) | | |
(Audited) | |
| Prepayments | |
$ | 4,017 | | |
$ | 40,382 | |
| Deposits | |
| 5,247 | | |
| 4,712 | |
| Total prepayments and deposits | |
$ | 9,264 | | |
$ | 45,094 | |
|
| X |
- References
+ Details
| Name: |
MUGH_DisclosurePrepaymentsAndDepositsAbstract |
| Namespace Prefix: |
MUGH_ |
| Data Type: |
xbrli:stringItemType |
| Balance Type: |
na |
| Period Type: |
duration |
|
| X |
- References
+ Details
| Name: |
MUGH_PrepaymentsAndDepositsTextBlock |
| Namespace Prefix: |
MUGH_ |
| Data Type: |
dtr-types:textBlockItemType |
| Balance Type: |
na |
| Period Type: |
duration |
|
v3.23.3
AMOUNT DUE FROM RELATED PARTY
|
12 Months Ended |
Jul. 31, 2023 |
|---|
| Amount Due From Related Party |
|
| AMOUNT DUE FROM RELATED PARTY |
8.
AMOUNT DUE FROM RELATED PARTY
SCHEDULE OF DUE FROM RELATED PARTY
| | |
As of | | |
As of | |
| | |
July 31, 2023 | | |
July 31, 2022 | |
| | |
(Audited) | | |
(Audited) | |
| Tien Mu International Co., Ltd1 | |
$ | 2,112 | | |
$ | 11,295 | |
| Total amount due from related party | |
$ | 2,112 | | |
$ | 11,295 | |
| 1 |
Tien
Mu International Co., Ltd is owned by Ms. Niu Yen-Yen, the Director and Chief Executive Officer of the Company. Tien Mu International
Co., Ltd is an operating agent of the Company’s operation in Taiwan, which collects deposits from franchisees on behalf of
the Company. |
MU
GLOBAL HOLDING LIMITED
NOTES
TO CONSOLIDATED FINANCIAL STATEMENTS
FOR
THE YEARS ENDED JULY 31, 2023 AND 2022
(Currency
expressed in United States Dollars (“US$”), except for number of shares)
|
| X |
- DefinitionDue From Related Party [Text Block]
| Name: |
MUGH_DueFromRelatedPartyTextBlock |
| Namespace Prefix: |
MUGH_ |
| Data Type: |
dtr-types:textBlockItemType |
| Balance Type: |
na |
| Period Type: |
duration |
|
v3.23.3
INVENTORIES
|
12 Months Ended |
Jul. 31, 2023 |
|---|
| Inventory Disclosure [Abstract] |
|
| INVENTORIES |
9.
INVENTORIES
SCHEDULE
OF INVENTORIES
| | |
As of | | |
As of | |
| | |
July 31, 2023 | | |
July 31, 2022 | |
| | |
(Audited) | | |
(Audited) | |
| Finished goods, at cost | |
$ | 1,333 | | |
$ | 16,483 | |
| Total inventories | |
$ | 1,333 | | |
$ | 16,483 | |
|
| X |
- References
+ Details
| Name: |
us-gaap_InventoryDisclosureAbstract |
| Namespace Prefix: |
us-gaap_ |
| Data Type: |
xbrli:stringItemType |
| Balance Type: |
na |
| Period Type: |
duration |
|
| X |
- DefinitionThe entire disclosure for inventory. Includes, but is not limited to, the basis of stating inventory, the method of determining inventory cost, the classes of inventory, and the nature of the cost elements included in inventory. Reference 1: http://www.xbrl.org/2003/role/disclosureRef
-Topic 330
-Name Accounting Standards Codification
-Publisher FASB
-URI https://asc.fasb.org//330/tableOfContent
| Name: |
us-gaap_InventoryDisclosureTextBlock |
| Namespace Prefix: |
us-gaap_ |
| Data Type: |
dtr-types:textBlockItemType |
| Balance Type: |
na |
| Period Type: |
duration |
|
v3.23.3
LOAN FROM RELATED PARTY
|
12 Months Ended |
Jul. 31, 2023 |
|---|
| Loan From Related Party |
|
| LOAN FROM RELATED PARTY |
10.
LOAN FROM RELATED PARTY
SCHEDULE
OF LOAN FROM RELATED PARTY
| | |
As of July 31, 2023 | | |
As of July 31, 2022 | |
| | |
(Audited) | | |
(Audited) | |
| Hong Ting Network Technology (Xiamen) Limited1 | |
| | | |
| | |
| Current | |
$ | - | | |
$ | 43,175 | |
| Total loan from related party | |
$ | - | | |
$ | 43,175 | |
| 1 |
Hong
Ting Network Technology (Xiamen) Limited is wholly-owned by Ms. Niu Yen-Yen, who is also the Director and Chief Executive Officer
of the Company. The loan is unsecured, interest-free and repayable on May 31, 2021 and further extended to May 31, 2023 with a loan
agreement entered on September 2, 2021. The remaining loan was being waived by Hong Ting Network Technology (Xiamen) Limited pursuant
to a debt waiver letter on June 1, 2023. |
|
| X |
- DefinitionLoan From Related Party [Text Block]
| Name: |
MUGH_LoanFromRelatedPartyTextBlock |
| Namespace Prefix: |
MUGH_ |
| Data Type: |
dtr-types:textBlockItemType |
| Balance Type: |
na |
| Period Type: |
duration |
|
v3.23.3
LOAN FROM THIRD PARTY
|
12 Months Ended |
Jul. 31, 2023 |
|---|
| Loan From Third Party |
|
| LOAN FROM THIRD PARTY |
11.
LOAN FROM THIRD PARTY
SCHEDULE OF LOAN FROM THIRD PARTY
| | |
As of July 31, 2023 | | |
As of July 31, 2022 | |
| | |
(Audited) | | |
(Audited) | |
| Shang Hai Shi Ba Enterprise Management Centre | |
$ | 95,988 | | |
$ | 77,064 | |
| Total loan from third party | |
$ | 95,988 | | |
$ | 77,064 | |
The
loan is unsecured, interest-free and repayable in year 2024 and year 2025. The loan is further extended to repayment in year 2026
with a loan agreement entered on August 2, 2023.
|
| X |
- References
+ Details
| Name: |
MUGH_DisclosureLoanFromThirdPartyAbstract |
| Namespace Prefix: |
MUGH_ |
| Data Type: |
xbrli:stringItemType |
| Balance Type: |
na |
| Period Type: |
duration |
|
| X |
- DefinitionLoan From Third Party [Text Block]
| Name: |
MUGH_LoanFromThirdPartyTextBlock |
| Namespace Prefix: |
MUGH_ |
| Data Type: |
dtr-types:textBlockItemType |
| Balance Type: |
na |
| Period Type: |
duration |
|
v3.23.3
LOAN FROM DIRECTOR
|
12 Months Ended |
Jul. 31, 2023 |
|---|
| Loan From Director |
|
| LOAN FROM DIRECTOR |
12.
LOAN FROM DIRECTOR
SCHEDULE OF LOAN FROM DIRECTOR
| | |
As of July 31, 2023 | | |
As of July 31, 2022 | |
| | |
(Audited) | | |
(Audited) | |
| Current | |
$ | 170,805 | | |
$ | 146,439 | |
| Non-current | |
| 110,985 | | |
| 122,652 | |
| Total loan from director | |
$ | 281,790 | | |
$ | 269,091 | |
Current portion
of the loan provided by director Niu Yen-Yen is unsecured, interest-free and repayable upon demand.
The
long-term loan provided by director Niu Yen-Yen is unsecured, interest-free and repayable in year 2024, for working capital purpose.
The long-term loan is further extended to repayment in year 2026 with a loan agreement entered on August 2, 2023.
|
| X |
- References
+ Details
| Name: |
MUGH_DisclosureLoanFromDirectorAbstract |
| Namespace Prefix: |
MUGH_ |
| Data Type: |
xbrli:stringItemType |
| Balance Type: |
na |
| Period Type: |
duration |
|
| X |
- DefinitionLoan From Director [Text Block]
| Name: |
MUGH_LoanFromDirectorTextBlock |
| Namespace Prefix: |
MUGH_ |
| Data Type: |
dtr-types:textBlockItemType |
| Balance Type: |
na |
| Period Type: |
duration |
|
v3.23.3
OTHER PAYABLES AND ACCRUED LIABILITIES
|
12 Months Ended |
Jul. 31, 2023 |
|---|
| Payables and Accruals [Abstract] |
|
| OTHER PAYABLES AND ACCRUED LIABILITIES |
13.
OTHER PAYABLES AND ACCRUED LIABILITIES
SCHEDULE OF OTHER PAYABLES AND ACCRUED LIABILITIES
| | |
As of | | |
As of | |
| | |
July 31, 2023 | | |
July 31, 2022 | |
| | |
(Audited) | | |
(Audited) | |
| Other payables | |
$ | 40,854 | | |
$ | 45,865 | |
| Accrued audit fees | |
| 15,000 | | |
| 15,000 | |
| Accrued professional fees | |
| 9,600 | | |
| 5,000 | |
| Total other payables and accrued liabilities | |
$ | 65,454 | | |
$ | 65,865 | |
MU
GLOBAL HOLDING LIMITED.
NOTES
TO CONSOLIDATED FINANCIAL STATEMENTS
FOR
THE YEARS ENDED JULY 31, 2023 AND 2022
(Currency
expressed in United States Dollars (“US$”), except for number of shares)
|
| X |
- DefinitionThe entire disclosure for accounts payable and accrued liabilities at the end of the reporting period. Reference 1: http://fasb.org/us-gaap/role/ref/legacyRef
-Name Accounting Standards Codification
-Topic 210
-SubTopic 10
-Section S99
-Paragraph 1
-Subparagraph (SX 210.5-02.19(a),20,24)
-Publisher FASB
-URI https://asc.fasb.org//1943274/2147480566/210-10-S99-1
| Name: |
us-gaap_AccountsPayableAndAccruedLiabilitiesDisclosureTextBlock |
| Namespace Prefix: |
us-gaap_ |
| Data Type: |
dtr-types:textBlockItemType |
| Balance Type: |
na |
| Period Type: |
duration |
|
| X |
- References
+ Details
| Name: |
us-gaap_PayablesAndAccrualsAbstract |
| Namespace Prefix: |
us-gaap_ |
| Data Type: |
xbrli:stringItemType |
| Balance Type: |
na |
| Period Type: |
duration |
|
v3.23.3
AMOUNT DUE TO RELATED PARTY
|
12 Months Ended |
Jul. 31, 2023 |
|---|
| Amount Due To Related Party |
|
| AMOUNT DUE TO RELATED PARTY |
14.
AMOUNT DUE TO RELATED PARTY
SCHEDULE OF DUE TO RELATED PARTIES
| | |
As of July 31, 2023 | | |
As of July 31, 2022 | |
| | |
(Audited) | | |
(Audited) | |
| Hsieh, Chang-Chung1 | |
| 93,176 | | |
| 85,076 | |
| | |
$ | 93,176 | | |
$ | 85,076 | |
As
of July 31, 2023, the balance $93,176 represented an outstanding payable to related party.
| 1 | Hsieh,
Chang-Chung is the Chief Financial Officer (“Principal Financial Officer”, “Principal Accounting Officer”)
of the Company, and the amount represents the salary expense accrued. On November 1, 2022, Mr. Hsieh resigned as Chief Financial
Officer of the Company. |
The
amounts due to related party are unsecured, interest-free with no fixed repayment term and for working capital purpose.
|
| X |
- DefinitionDue to Related Parties [Text Block]
| Name: |
MUGH_DueToRelatedPartiesTextBlock |
| Namespace Prefix: |
MUGH_ |
| Data Type: |
dtr-types:textBlockItemType |
| Balance Type: |
na |
| Period Type: |
duration |
|
v3.23.3
INCOME TAXES
|
12 Months Ended |
Jul. 31, 2023 |
|---|
| Income Tax Disclosure [Abstract] |
|
| INCOME TAXES |
15.
INCOME TAXES
For
the year ended July 31, 2023 and July 31, 2022, the local (United States) and foreign components of (loss)/profit before income taxes
were comprised of the following:
SCHEDULE
OF LOSS BEFORE INCOME TAX
| | |
Year ended
July 31, 2023 | | |
Year ended
July 31, 2022 | |
| | |
(Audited) | | |
(Audited) | |
| Tax jurisdictions from: | |
| | | |
| | |
| - Local | |
$ | (53,650 | ) | |
$ | (52,675 | ) |
| - Foreign, representing | |
| | | |
| | |
| Seychelles | |
| (1,600 | ) | |
| (2,101 | ) |
| Hong Kong | |
| 13,363 | | |
| (97,033 | ) |
| People’s Republic of China (“PRC”) | |
| (26,940 | ) | |
| (205,524 | ) |
| Loss before income tax | |
$ | ) | |
$ | ) |
The
provision for income taxes consisted of the following:
SCHEDULE
OF PROVISION FOR INCOME TAXES
| | |
Year ended
July 31, 2023 | | |
Year ended
July 31, 2022 | |
| | |
(Audited) | | |
(Audited) | |
| Current: | |
| | | |
| | |
| - Local | |
$ | - | | |
$ | - | |
| - Foreign | |
| - | | |
| - | |
| | |
| | | |
| | |
| Deferred: | |
| | | |
| | |
| - Local | |
| - | | |
| - | |
| - Foreign | |
| - | | |
| - | |
| | |
| | | |
| | |
| Income tax expense | |
$ | - | | |
$ | - | |
The
effective tax rate in the periods presented is the result of the mix of income earned in various tax jurisdictions that apply a broad
range of income tax rates. The Company and its subsidiary that operate in various countries: United States, Seychelles, Hong Kong, and
PRC that are subject to taxes in the jurisdictions in which they operate, as follows:
United
States of America
The
Company is registered in the State of Nevada and is subject to the tax laws of the United States of America. As of July 31, 2023, the
operations in the United States of America incurred $493,234 of cumulative net operating losses which can be carried forward indefinitely
to offset a maximum of 80% future taxable income. The Company has provided for a full valuation allowance of $394,587 against the deferred
tax assets on the expected future tax benefits from the net operating loss carryforwards as the management believes it is more likely
than not that these assets will not be realized in the future.
Seychelles
Under
the current laws of the Seychelles, MU Worldwide Group Limited is registered as an international business company and governed by the
International Business Companies Act of Seychelles. There is no income tax charged in Seychelles.
Hong
Kong
MU
Global Holding Limited is subjected to Hong Kong Profits Tax, which is charged at the statutory income tax rate of 16.5% on its assessable
income.
Shanghai
MU
Global Health Management (Shanghai) Limited operates in the PRC and is subjected to the Corporate Income Tax governed by the Income Tax
Law of the PRC with a unified statutory income tax rate of 25%.
MU
GLOBAL HOLDING LIMITED
NOTES
TO CONSOLIDATED FINANCIAL STATEMENTS
FOR
THE YEARS ENDED JULY 31, 2023 AND 2022
(Currency
expressed in United States Dollars (“US$”), except for number of shares)
|
| X |
- DefinitionThe entire disclosure for income taxes. Disclosures may include net deferred tax liability or asset recognized in an enterprise's statement of financial position, net change during the year in the total valuation allowance, approximate tax effect of each type of temporary difference and carryforward that gives rise to a significant portion of deferred tax liabilities and deferred tax assets, utilization of a tax carryback, and tax uncertainties information. Reference 1: http://www.xbrl.org/2003/role/disclosureRef
-Topic 946
-SubTopic 20
-Name Accounting Standards Codification
-Section 50
-Paragraph 13
-Publisher FASB
-URI https://asc.fasb.org//1943274/2147480990/946-20-50-13
Reference 2: http://www.xbrl.org/2003/role/disclosureRef
-Topic 235
-SubTopic 10
-Name Accounting Standards Codification
-Section S99
-Paragraph 1
-Subparagraph (SX 210.4-08(h)(2))
-Publisher FASB
-URI https://asc.fasb.org//1943274/2147480678/235-10-S99-1
Reference 3: http://www.xbrl.org/2003/role/disclosureRef
-Topic 740
-Name Accounting Standards Codification
-Publisher FASB
-URI https://asc.fasb.org//740/tableOfContent
Reference 4: http://www.xbrl.org/2003/role/disclosureRef
-Topic 740
-SubTopic 10
-Name Accounting Standards Codification
-Section 50
-Paragraph 14
-Publisher FASB
-URI https://asc.fasb.org//1943274/2147482685/740-10-50-14
Reference 5: http://www.xbrl.org/2003/role/disclosureRef
-Topic 740
-SubTopic 10
-Name Accounting Standards Codification
-Section 50
-Paragraph 21
-Publisher FASB
-URI https://asc.fasb.org//1943274/2147482685/740-10-50-21
Reference 6: http://www.xbrl.org/2003/role/disclosureRef
-Topic 740
-SubTopic 270
-Name Accounting Standards Codification
-Section 50
-Paragraph 1
-Publisher FASB
-URI https://asc.fasb.org//1943274/2147482526/740-270-50-1
Reference 7: http://www.xbrl.org/2003/role/disclosureRef
-Topic 740
-SubTopic 10
-Name Accounting Standards Codification
-Section 50
-Paragraph 17
-Subparagraph (b)
-Publisher FASB
-URI https://asc.fasb.org//1943274/2147482685/740-10-50-17
Reference 8: http://www.xbrl.org/2003/role/disclosureRef
-Topic 740
-SubTopic 10
-Name Accounting Standards Codification
-Section S99
-Paragraph 1
-Subparagraph (SAB TOPIC 6.I.5.Q1)
-Publisher FASB
-URI https://asc.fasb.org//1943274/2147479360/740-10-S99-1
Reference 9: http://www.xbrl.org/2003/role/disclosureRef
-Topic 740
-SubTopic 10
-Name Accounting Standards Codification
-Section S99
-Paragraph 2
-Subparagraph (SAB Topic 11.C)
-Publisher FASB
-URI https://asc.fasb.org//1943274/2147479360/740-10-S99-2
Reference 10: http://www.xbrl.org/2003/role/disclosureRef
-Topic 740
-SubTopic 30
-Name Accounting Standards Codification
-Section 50
-Paragraph 2
-Subparagraph (a)
-Publisher FASB
-URI https://asc.fasb.org//1943274/2147482603/740-30-50-2
| Name: |
us-gaap_IncomeTaxDisclosureTextBlock |
| Namespace Prefix: |
us-gaap_ |
| Data Type: |
dtr-types:textBlockItemType |
| Balance Type: |
na |
| Period Type: |
duration |
|
v3.23.3
CONCENTRATIONS OF RISKS
|
12 Months Ended |
Jul. 31, 2023 |
|---|
| Risks and Uncertainties [Abstract] |
|
| CONCENTRATIONS OF RISKS |
16.
CONCENTRATIONS OF RISKS
(a)
Major customers
For
the year ended July 31, 2023 and 2022, the customers who accounted for 10% or more of the Company’s revenues and its accounts receivable
balance at year end are presented as follows:
SCHEDULE
OF CONCENTRATION OF RISK
| | |
2023 | | |
2022 | | |
2023 | | |
2022 | | |
2023 | | |
2022 | |
| | |
Revenues | | |
Percentage of
revenues | | |
Accounts
receivable, trade | |
| | |
(Audited) | | |
(Audited) | | |
(Audited) | |
| | |
| | |
| | |
| | |
| | |
| | |
| |
| Customer A | |
$ | - | | |
$ | 37,062 | | |
| - | % | |
| 79 | % | |
$ | - | | |
$ | - | |
| Customer B | |
| 120,938 | | |
| - | | |
| 83 | % | |
| - | % | |
| - | | |
| - | |
| Customer C | |
| 17,171 | | |
| - | | |
| 12 | % | |
| - | % | |
| - | | |
| - | |
| | |
$ | 138,109 | | |
$ | 37,062 | | |
| 95 | % | |
| 79 | % | |
$ | - | | |
$ | - | |
(b)
Major suppliers
For
the year ended July 31, 2023 and 2022, the vendors who accounted for 10% or more of the Company’s purchase and its accounts payable
balances at year end are presented as follows:
| | |
2023 | | |
2022 | | |
2023 | | |
2022 | | |
2023 | | |
2022 | |
| | |
Purchases | | |
Percentage of
purchases | | |
Accounts
payable, trade | |
| | |
(Audited) | | |
(Audited) | | |
(Audited) | |
| | |
| | |
| | |
| | |
| | |
| | |
| |
| Vendor A | |
$ | 108,844 | | |
$ | - | | |
| 100 | % | |
| - | % | |
$ | - | | |
$ | - | |
| | |
$ | 108,844 | | |
$ | - | | |
| 100 | % | |
| - | % | |
$ | - | | |
$ | - | |
(c)
Major suppliers for property, plant and equipment
For
the year ended July 31, 2023, the Company did not purchase property, plant and equipment. For the year ended July 31, 2022, the Company
purchased property, plant and equipment from Rongzi Co., which accounted for 100% the total purchases of property, plant and equipment
during the year.
(d)
Exchange rate risk
The
operation of the Company’s subsidiaries in international markets results in exposure to movements in currency exchange rates. We
have experienced foreign currency gains and losses due to the strengthening and weakening of the U.S. dollar. The potential of volatile
foreign exchange rate fluctuations in the future could have a significant effect on our results of operations. The Company has not historically
used financial instruments to hedge its foreign currency exchange rate risks.
The
currencies that create a majority of the Company’s exchange rate exposure are RMB, HK$, and TWD. The Company translates all assets
and liabilities at the rate of exchange in effect at the balance sheet date and income and expense activity at the approximate rate of
exchange at the transaction date.
|
| X |
- DefinitionThe entire disclosure for any concentrations existing at the date of the financial statements that make an entity vulnerable to a reasonably possible, near-term, severe impact. This disclosure informs financial statement users about the general nature of the risk associated with the concentration, and may indicate the percentage of concentration risk as of the balance sheet date. Reference 1: http://fasb.org/us-gaap/role/ref/legacyRef
-Topic 275
-Name Accounting Standards Codification
-Publisher FASB
-URI https://asc.fasb.org//275/tableOfContent
| Name: |
us-gaap_ConcentrationRiskDisclosureTextBlock |
| Namespace Prefix: |
us-gaap_ |
| Data Type: |
dtr-types:textBlockItemType |
| Balance Type: |
na |
| Period Type: |
duration |
|
| X |
- References
+ Details
| Name: |
us-gaap_RisksAndUncertaintiesAbstract |
| Namespace Prefix: |
us-gaap_ |
| Data Type: |
xbrli:stringItemType |
| Balance Type: |
na |
| Period Type: |
duration |
|
v3.23.3
COMMITMENTS AND CONTINGENCIES
|
12 Months Ended |
Jul. 31, 2023 |
|---|
| Commitments and Contingencies Disclosure [Abstract] |
|
| COMMITMENTS AND CONTINGENCIES |
17.
COMMITMENTS AND CONTINGENCIES
On
November 6, 2021, the Company entered into a contract rental agreement to rent the office in Shanghai for a period of one
year commencing on November 6, 2021 with tri-monthly payments in the amount of RMB 3,500
per month over the course of the lease and an entitlement of 1 month rent free period as relief upon rented the premise for full 11
months. The Company has an option to renew after the end of the agreement. On October 18, 2022, the Company has renewed the tenancy
agreement for 12 months with tri-monthly payments in the amount of RMB 3,500
per month over the course of the lease from November 6, 2022 to November 5, 2023 and is entitled for 1 month rent free period as
relief upon rented the premise for full 11 months. The Company has an option to renew after the end of the agreement. On August 7, 2023, the Company has further renewed the tenancy agreement for 12 months with tri-monthly payments
in the amount of RMB 3,500 per month over the course of the lease from November 6, 2023 to November 5, 2024 and is entitled for 1 month
rent free period as relief upon rented the premise for full 11 months.
As
of July 31, 2023, the Company has the aggregate minimal rent payments due in the next two years as follows:
SCHEDULE
OF AGGREGATE MINIMAL RENT PAYMENTS
| Year ending July 31 | |
| |
| | |
| |
| 2024 | |
$ | 5,223 | |
| 2025 | |
| 976 | |
| Total | |
$ | 6,199 | |
MU
GLOBAL HOLDING LIMITED
NOTES
TO CONSOLIDATED FINANCIAL STATEMENTS
FOR
THE YEARS ENDED JULY 31, 2023 AND 2022
(Currency
expressed in United States Dollars (“US$”), except for number of shares)
|
| X |
- References
+ Details
| Name: |
us-gaap_CommitmentsAndContingenciesDisclosureAbstract |
| Namespace Prefix: |
us-gaap_ |
| Data Type: |
xbrli:stringItemType |
| Balance Type: |
na |
| Period Type: |
duration |
|
| X |
- DefinitionThe entire disclosure for commitments and contingencies. Reference 1: http://www.xbrl.org/2003/role/disclosureRef
-Topic 440
-SubTopic 10
-Name Accounting Standards Codification
-Section 50
-Paragraph 4
-Subparagraph (a)
-Publisher FASB
-URI https://asc.fasb.org//1943274/2147482648/440-10-50-4
Reference 2: http://www.xbrl.org/2009/role/commonPracticeRef
-Topic 450
-Name Accounting Standards Codification
-Publisher FASB
-URI https://asc.fasb.org//450/tableOfContent
Reference 3: http://www.xbrl.org/2003/role/disclosureRef
-Topic 954
-SubTopic 440
-Name Accounting Standards Codification
-Section 50
-Paragraph 1
-Subparagraph (a)
-Publisher FASB
-URI https://asc.fasb.org//1943274/2147480327/954-440-50-1
Reference 4: http://www.xbrl.org/2003/role/disclosureRef
-Topic 440
-SubTopic 10
-Name Accounting Standards Codification
-Section 50
-Paragraph 4
-Subparagraph (c)
-Publisher FASB
-URI https://asc.fasb.org//1943274/2147482648/440-10-50-4
Reference 5: http://fasb.org/us-gaap/role/ref/legacyRef
-Topic 440
-Name Accounting Standards Codification
-Publisher FASB
-URI https://asc.fasb.org//440/tableOfContent
| Name: |
us-gaap_CommitmentsAndContingenciesDisclosureTextBlock |
| Namespace Prefix: |
us-gaap_ |
| Data Type: |
dtr-types:textBlockItemType |
| Balance Type: |
na |
| Period Type: |
duration |
|
v3.23.3
RELATED PARTY TRANSACTIONS
|
12 Months Ended |
Jul. 31, 2023 |
|---|
| Related Party Transactions [Abstract] |
|
| RELATED PARTY TRANSACTIONS |
18.
RELATED PARTY TRANSACTIONS
For
the year ended July 31, 2023 and 2022, the Company has following transactions with related parties:
SCHEDULE
OF OUTSTANDING PAYABLE TO RELATED PARTY
| | |
Year ended
July 31, 2023 | | |
Year ended
July 31, 2022 | |
| | |
(Audited) | | |
(Audited) | |
| Professional fee paid: | |
| | | |
| | |
| - Related party A | |
$ | 16,080 | | |
$ | 16,580 | |
| | |
| | | |
| | |
| Consultation fee paid: | |
| | | |
| | |
| - Related party B | |
$ | 8,100 | | |
$ | 32,400 | |
| | |
| | | |
| | |
| Total | |
$ | 24,180 | | |
$ | 48,980 | |
Related
party A is the fellow subsidiaries of a corporate shareholder of the Company. Related party B is the shareholder of the Company.
For
the year ended July 31, 2023, the Company incurred professional fees of $16,080 due to related party A. Related party B is consultant
of the Company and has provided consultancy service for business operation.
|
| X |
- DefinitionThe entire disclosure for related party transactions. Examples of related party transactions include transactions between (a) a parent company and its subsidiary; (b) subsidiaries of a common parent; (c) and entity and its principal owners; and (d) affiliates. Reference 1: http://www.xbrl.org/2003/role/disclosureRef
-Topic 946
-SubTopic 20
-Name Accounting Standards Codification
-Section 50
-Paragraph 2
-Publisher FASB
-URI https://asc.fasb.org//1943274/2147480990/946-20-50-2
Reference 2: http://www.xbrl.org/2003/role/disclosureRef
-Topic 946
-SubTopic 20
-Name Accounting Standards Codification
-Section 50
-Paragraph 5
-Publisher FASB
-URI https://asc.fasb.org//1943274/2147480990/946-20-50-5
Reference 3: http://www.xbrl.org/2003/role/disclosureRef
-Topic 946
-SubTopic 20
-Name Accounting Standards Codification
-Section 50
-Paragraph 6
-Publisher FASB
-URI https://asc.fasb.org//1943274/2147480990/946-20-50-6
Reference 4: http://www.xbrl.org/2003/role/disclosureRef
-Topic 946
-SubTopic 235
-Name Accounting Standards Codification
-Section 50
-Paragraph 2
-Subparagraph (c)
-Publisher FASB
-URI https://asc.fasb.org//1943274/2147481062/946-235-50-2
Reference 5: http://www.xbrl.org/2003/role/disclosureRef
-Topic 946
-SubTopic 235
-Name Accounting Standards Codification
-Section 50
-Paragraph 2
-Subparagraph (e)
-Publisher FASB
-URI https://asc.fasb.org//1943274/2147481062/946-235-50-2
Reference 6: http://www.xbrl.org/2003/role/disclosureRef
-Topic 850
-SubTopic 10
-Name Accounting Standards Codification
-Section 50
-Paragraph 1
-Subparagraph (d)
-Publisher FASB
-URI https://asc.fasb.org//1943274/2147483326/850-10-50-1
Reference 7: http://www.xbrl.org/2003/role/disclosureRef
-Topic 946
-SubTopic 220
-Name Accounting Standards Codification
-Section S99
-Paragraph 1
-Subparagraph (SX 210.6-07(2)(g)(3))
-Publisher FASB
-URI https://asc.fasb.org//1943274/2147483575/946-220-S99-1
Reference 8: http://www.xbrl.org/2003/role/disclosureRef
-Topic 946
-SubTopic 220
-Name Accounting Standards Codification
-Section S99
-Paragraph 1
-Subparagraph (SX 210.6-07(2)(c))
-Publisher FASB
-URI https://asc.fasb.org//1943274/2147483575/946-220-S99-1
Reference 9: http://www.xbrl.org/2003/role/disclosureRef
-Topic 946
-SubTopic 220
-Name Accounting Standards Codification
-Section S99
-Paragraph 1
-Subparagraph (SX 210.6-07(2)(e))
-Publisher FASB
-URI https://asc.fasb.org//1943274/2147483575/946-220-S99-1
Reference 10: http://www.xbrl.org/2003/role/disclosureRef
-Topic 850
-Name Accounting Standards Codification
-Publisher FASB
-URI https://asc.fasb.org//850/tableOfContent
Reference 11: http://www.xbrl.org/2003/role/disclosureRef
-Topic 850
-SubTopic 10
-Name Accounting Standards Codification
-Section 50
-Paragraph 6
-Publisher FASB
-URI https://asc.fasb.org//1943274/2147483326/850-10-50-6
Reference 12: http://www.xbrl.org/2003/role/disclosureRef
-Topic 850
-SubTopic 10
-Name Accounting Standards Codification
-Section 50
-Paragraph 1
-Subparagraph (a)
-Publisher FASB
-URI https://asc.fasb.org//1943274/2147483326/850-10-50-1
Reference 13: http://www.xbrl.org/2003/role/disclosureRef
-Topic 850
-SubTopic 10
-Name Accounting Standards Codification
-Section 50
-Paragraph 1
-Subparagraph (b)
-Publisher FASB
-URI https://asc.fasb.org//1943274/2147483326/850-10-50-1
| Name: |
us-gaap_RelatedPartyTransactionsDisclosureTextBlock |
| Namespace Prefix: |
us-gaap_ |
| Data Type: |
dtr-types:textBlockItemType |
| Balance Type: |
na |
| Period Type: |
duration |
|
v3.23.3
SEGMENT INFORMATION
|
12 Months Ended |
Jul. 31, 2023 |
|---|
| Segment Reporting [Abstract] |
|
| SEGMENT INFORMATION |
19.
SEGMENT INFORMATION
ASC
280, “Segment Reporting” establishes standards for reporting information about operating segments on a basis consistent with
the Company’s internal organization structure as well as information about services categories, business segments and major customers
in financial statements. In accordance with the “Segment Reporting” Topic of the ASC, the Company’s chief operating
decision maker has been identified as the Chief Executive Officer and President, who reviews operating results to make decisions about
allocating resources and assessing performance for the entire Company. Existing guidance, which is based on a management approach to
segment reporting, establishes requirements to report selected segment information quarterly and to report annually entity-wide disclosures
about products and services, major customers, and the countries in which the entity holds material assets and reports revenue. All material
operating units qualify for aggregation under “Segment Reporting” due to their similar customer base and similarities in
economic characteristics; nature of products and services; and procurement, manufacturing and distribution processes.
The
Company had no inter-segment sales for the years presented. Summarized financial information concerning the Company’s reportable
segments is shown as below:
SCHEDULE
OF SEGMENT REPORTING INFORMATION
By
Geography:
| | |
Nevada | | |
Seychelles | | |
Hong Kong | | |
China | | |
Total | |
| | |
For the year ended July 31, 2023 | |
| | |
Nevada | | |
Seychelles | | |
Hong Kong | | |
China | | |
Total | |
| | |
| | |
| | |
| | |
| | |
| |
| Revenue | |
$ | - | | |
$ | - | | |
$ | 120,938 | | |
$ | 25,314 | | |
$ | 146,252 | |
| Cost of revenue | |
| - | | |
| - | | |
| (108,844 | ) | |
| (14,244 | ) | |
| (123,088 | ) |
| Other income | |
| - | | |
| - | | |
| 14,038 | | |
| 58,813 | | |
| 72,851 | |
| Selling and marketing expenses | |
| - | | |
| - | | |
| (200 | ) | |
| (1,331 | ) | |
| (1,531 | ) |
| General and administrative expenses | |
| (53,650 | ) | |
| (1,600 | ) | |
| (12,569 | ) | |
| (95,492 | ) | |
| (163,311 | ) |
| | |
| | | |
| | | |
| | | |
| | | |
| | |
| Total assets | |
$ | 3,150 | | |
$ | 1 | | |
$ | 8,254 | | |
$ | 12,136 | | |
$ | 23,541 | |
| | |
Nevada | | |
Seychelles | | |
Hong Kong | | |
China | | |
Total | |
| | |
For the year ended July 31, 2022 | |
| | |
Nevada | | |
Seychelles | | |
Hong Kong | | |
China | | |
Total | |
| | |
| | |
| | |
| | |
| | |
| |
| Revenue | |
$ | - | | |
$ | - | | |
$ | - | | |
$ | 46,702 | | |
$ | 46,702 | |
| Cost of revenue | |
| - | | |
| - | | |
| - | | |
| (21,891 | ) | |
| (21,891 | ) |
| Other income | |
| - | | |
| - | | |
| 27,781 | | |
| 22,255 | | |
| 50,036 | |
| Selling and marketing expenses | |
| - | | |
| (13 | ) | |
| (103 | ) | |
| (3,354 | ) | |
| (3,470 | ) |
| General and administrative expenses | |
| (52,675 | ) | |
| (2,088 | ) | |
| (124,711 | ) | |
| (249,236 | ) | |
| (428,710 | ) |
| | |
| | | |
| | | |
| | | |
| | | |
| | |
| Total assets | |
$ | 3,075 | | |
$ | 1 | | |
$ | 15,551 | | |
$ | 63,421 | | |
$ | 82,048 | |
|
| X |
- References
+ Details
| Name: |
us-gaap_SegmentReportingAbstract |
| Namespace Prefix: |
us-gaap_ |
| Data Type: |
xbrli:stringItemType |
| Balance Type: |
na |
| Period Type: |
duration |
|
| X |
- DefinitionThe entire disclosure for reporting segments including data and tables. Reportable segments include those that meet any of the following quantitative thresholds a) it's reported revenue, including sales to external customers and intersegment sales or transfers is 10 percent or more of the combined revenue, internal and external, of all operating segments b) the absolute amount of its reported profit or loss is 10 percent or more of the greater, in absolute amount of 1) the combined reported profit of all operating segments that did not report a loss or 2) the combined reported loss of all operating segments that did report a loss c) its assets are 10 percent or more of the combined assets of all operating segments. Reference 1: http://www.xbrl.org/2003/role/disclosureRef
-Topic 280
-SubTopic 10
-Name Accounting Standards Codification
-Section 50
-Paragraph 22
-Publisher FASB
-URI https://asc.fasb.org//1943274/2147482810/280-10-50-22
Reference 2: http://www.xbrl.org/2003/role/disclosureRef
-Topic 280
-SubTopic 10
-Name Accounting Standards Codification
-Section 50
-Paragraph 15
-Publisher FASB
-URI https://asc.fasb.org//1943274/2147482810/280-10-50-15
Reference 3: http://www.xbrl.org/2003/role/disclosureRef
-Topic 280
-SubTopic 10
-Name Accounting Standards Codification
-Section 50
-Paragraph 31
-Publisher FASB
-URI https://asc.fasb.org//1943274/2147482810/280-10-50-31
Reference 4: http://www.xbrl.org/2003/role/disclosureRef
-Topic 280
-SubTopic 10
-Name Accounting Standards Codification
-Section 50
-Paragraph 32
-Subparagraph (d)
-Publisher FASB
-URI https://asc.fasb.org//1943274/2147482810/280-10-50-32
Reference 5: http://www.xbrl.org/2003/role/disclosureRef
-Topic 280
-SubTopic 10
-Name Accounting Standards Codification
-Section 50
-Paragraph 42
-Publisher FASB
-URI https://asc.fasb.org//1943274/2147482810/280-10-50-42
Reference 6: http://www.xbrl.org/2003/role/disclosureRef
-Topic 280
-SubTopic 10
-Name Accounting Standards Codification
-Section 50
-Paragraph 32
-Subparagraph (f)
-Publisher FASB
-URI https://asc.fasb.org//1943274/2147482810/280-10-50-32
Reference 7: http://www.xbrl.org/2003/role/disclosureRef
-Topic 280
-SubTopic 10
-Name Accounting Standards Codification
-Section 50
-Paragraph 40
-Publisher FASB
-URI https://asc.fasb.org//1943274/2147482810/280-10-50-40
Reference 8: http://www.xbrl.org/2003/role/disclosureRef
-Topic 280
-Name Accounting Standards Codification
-Publisher FASB
-URI https://asc.fasb.org//280/tableOfContent
Reference 9: http://www.xbrl.org/2003/role/disclosureRef
-Topic 280
-SubTopic 10
-Name Accounting Standards Codification
-Section 50
-Paragraph 26
-Publisher FASB
-URI https://asc.fasb.org//1943274/2147482810/280-10-50-26
Reference 10: http://www.xbrl.org/2003/role/disclosureRef
-Topic 280
-SubTopic 10
-Name Accounting Standards Codification
-Section 50
-Paragraph 34
-Publisher FASB
-URI https://asc.fasb.org//1943274/2147482810/280-10-50-34
Reference 11: http://www.xbrl.org/2003/role/disclosureRef
-Topic 280
-SubTopic 10
-Name Accounting Standards Codification
-Section 50
-Paragraph 41
-Publisher FASB
-URI https://asc.fasb.org//1943274/2147482810/280-10-50-41
Reference 12: http://www.xbrl.org/2003/role/disclosureRef
-Topic 280
-SubTopic 10
-Name Accounting Standards Codification
-Section 50
-Paragraph 21
-Subparagraph (a)
-Publisher FASB
-URI https://asc.fasb.org//1943274/2147482810/280-10-50-21
Reference 13: http://www.xbrl.org/2003/role/disclosureRef
-Topic 280
-SubTopic 10
-Name Accounting Standards Codification
-Section 50
-Paragraph 21
-Subparagraph (b)
-Publisher FASB
-URI https://asc.fasb.org//1943274/2147482810/280-10-50-21
Reference 14: http://www.xbrl.org/2003/role/disclosureRef
-Topic 280
-SubTopic 10
-Name Accounting Standards Codification
-Section 50
-Paragraph 32
-Subparagraph (e)
-Publisher FASB
-URI https://asc.fasb.org//1943274/2147482810/280-10-50-32
| Name: |
us-gaap_SegmentReportingDisclosureTextBlock |
| Namespace Prefix: |
us-gaap_ |
| Data Type: |
dtr-types:textBlockItemType |
| Balance Type: |
na |
| Period Type: |
duration |
|
v3.23.3
SUBSEQUENT EVENTS
|
12 Months Ended |
Jul. 31, 2023 |
|---|
| Subsequent Events [Abstract] |
|
| SUBSEQUENT EVENTS |
20.
SUBSEQUENT EVENTS
In
accordance with ASC Topic 855, “Subsequent Events”, which establishes general standards of accounting for and disclosure
of events that occur after the balance sheet date but before financial statements are issued, the Company has evaluated all subsequent
events through the filing date of this Form 10-K with the SEC, to ensure that this filing includes appropriate disclosure of events both
recognized in the financial statements as of July 31, 2023, and events which occurred subsequently but were not recognized in the financial
statements. During the year, there was no subsequent event that required recognition or disclosure.
|
| X |
- References
+ Details
| Name: |
us-gaap_SubsequentEventsAbstract |
| Namespace Prefix: |
us-gaap_ |
| Data Type: |
xbrli:stringItemType |
| Balance Type: |
na |
| Period Type: |
duration |
|
| X |
- DefinitionThe entire disclosure for significant events or transactions that occurred after the balance sheet date through the date the financial statements were issued or the date the financial statements were available to be issued. Examples include: the sale of a capital stock issue, purchase of a business, settlement of litigation, catastrophic loss, significant foreign exchange rate changes, loans to insiders or affiliates, and transactions not in the ordinary course of business. Reference 1: http://www.xbrl.org/2003/role/disclosureRef
-Topic 855
-Name Accounting Standards Codification
-Publisher FASB
-URI https://asc.fasb.org//855/tableOfContent
Reference 2: http://www.xbrl.org/2003/role/disclosureRef
-Topic 855
-SubTopic 10
-Name Accounting Standards Codification
-Section 50
-Paragraph 2
-Subparagraph (a)
-Publisher FASB
-URI https://asc.fasb.org//1943274/2147483399/855-10-50-2
| Name: |
us-gaap_SubsequentEventsTextBlock |
| Namespace Prefix: |
us-gaap_ |
| Data Type: |
dtr-types:textBlockItemType |
| Balance Type: |
na |
| Period Type: |
duration |
|
v3.23.3
SUMMARY OF SIGNIFICANT ACCOUNTING POLICIES (Policies)
|
12 Months Ended |
Jul. 31, 2023 |
|---|
| Accounting Policies [Abstract] |
|
| Basis of presentation |
Basis
of presentation
These
accompanying consolidated financial statements have been prepared in accordance with generally accepted accounting principles in the
United States of America (“US GAAP”).
The
Company has adopted its fiscal year-end to be July 31.
|
| Basis of consolidation |
Basis
of consolidation
The
consolidated financial statements include the accounts of the Company and its subsidiaries. All inter-company accounts and transactions
have been eliminated upon consolidation.
|
| Use of estimates |
Use
of estimates
Management
uses estimates and assumptions in preparing these financial statements in accordance with US GAAP. Those estimates and assumptions affect
the reported amounts of assets and liabilities, the disclosure of contingent assets and liabilities in the balance sheets, and the reported
revenue and expenses during the periods reported. Actual results may differ from these estimates.
|
| Revenue recognition |
Revenue
recognition
Financial
Accounting Standards Board, or FASB, issued ASC 606. The standard is a comprehensive new revenue recognition model that requires revenue
to be recognized in a manner to depict the transfer of goods or services to a customer at an amount that reflects the consideration expected
to be received in exchange for those goods or services.
Revenue
is measured at the fair value of the consideration received or receivable, net of discounts and taxes applicable to the revenue. The
Company derives its revenue from provision of wellness and beauty services to customers via Company owned outlets, franchised outlets
or distribution of our product to third party wellness and beauty salon.
|
| Cost of revenue |
Cost
of revenue
Cost
of revenue includes the cost of services and product incurred to provide wellness and beauty services and purchase of products.
|
| Cash and cash equivalents |
Cash
and cash equivalents
Cash
and cash equivalents are carried at cost and represent cash on hand, demand deposits placed with banks or other financial institutions
and all highly liquid investments with an original maturity of three months or less as of the purchase date of such investments.
|
| Property, plant and equipment |
Property,
plant and equipment
Property,
plant and equipment are stated at cost less accumulated depreciation and accumulated impairment losses, if any. Depreciation is calculated
on the straight-line basis over the following expected useful lives from the date on which they become fully operational:
SCHEDULE
OF PROPERTY, PLANT AND EQUIPMENT ESTIMATED LIFE
| Classification |
|
Estimated
useful life |
| Leasable
equipment |
|
5
years |
| Computer
hardware and software |
|
3
years |
| Office
equipment |
|
3
years |
| Outlet
design fee and equipment |
|
3
years |
| Application
development fee |
|
3
years |
Expenditures
for maintenance and repairs are expensed as incurred. The gain or loss on the disposal of property, plant and equipment is the difference
between the net sales proceeds and the carrying amount of the relevant assets and is recognized in the Consolidated Statements of Operations
and Comprehensive Loss.
|
| Impairment of long-live assets |
Impairment
of long-live assets
Long-lived
assets primarily include trademark of the Company. In accordance with the provision of ASC Topic 360, Impairment or Disposal of Long-Lived
Assets, the Company generally conducts its annual impairment evaluation to its long-lived assets, usually in the fourth quarter of
each fiscal year, or more frequently if indicators of impairment exist, such as significant sustained change in the business climate.
The recoverability of long-lived assets is measured at the lowest level group. If the total of the expected undiscounted future net cash
flows is less than the carrying amount of the asset, a loss is recognized for the difference between the fair value and carrying amount
of the asset.
|
| Leases |
Leases
The
Company recognizes lease payments for its short-term lease on a straight-line basis over the lease term in accordance with ASC 842.
The
right-of-use asset is initially measured at cost, which comprises the initial amount of the lease liability adjusted for lease payments
made at or before the lease commencement date, plus any initial direct costs incurred less any lease incentives received. Costs associated
with operating lease assets are recognized on a straight-line basis within operating expenses over the term of the lease.
In
determining the present value of the unpaid lease payments, ASC 842 requires a lessee to discount its unpaid lease payments using the
interest rate implicit in the lease or, if that rate cannot be readily determined, its incremental borrowing rate. As most of the Company
leases do not provide an implicit rate, the Company uses its incremental borrowing rate as the discount rate for the lease. The Company
incremental borrowing rate is estimated to approximate the interest rate on a collateralized basis with similar terms and payments.
|
| Inventories |
Inventories
Inventories
consisting of products available for sell, are stated at the lower of cost or market value. Cost of inventory is determined using the
first-in, first-out (FIFO) method. Inventory reserve is recorded to write down the cost of inventory to the estimated market value due
to slow-moving merchandise and damaged goods, which is dependent upon factors such as historical and forecasted consumer demand, and
promotional environment. The Company takes ownership, risks and rewards of the products purchased. Write downs are recorded in cost of
revenues in the Consolidated Statements of Operations and Comprehensive Loss.
|
| Income taxes |
Income
taxes
Income
taxes are determined in accordance with the provisions of ASC Topic 740, “Income Taxes” (“ASC 740”). Under this
method, deferred tax assets and liabilities are recognized for the future tax consequences attributable to differences between the financial
statement carrying amounts of existing assets and liabilities and their respective tax basis. Deferred tax assets and liabilities are
measured using enacted income tax rates expected to apply to taxable income in the periods in which those temporary differences are expected
to be recovered or settled. Any effect on deferred tax assets and liabilities of a change in tax rates is recognized in income in the
period that includes the enactment date.
ASC
740 prescribes a comprehensive model for how companies should recognize, measure, present, and disclose in their financial statements
uncertain tax positions taken or expected to be taken on a tax return. Under ASC 740, tax positions must initially be recognized in the
financial statements when it is more likely than not the position will be sustained upon examination by the tax authorities. Such tax
positions must initially and subsequently be measured as the largest amount of tax benefit that has a greater than 50% likelihood of
being realized upon ultimate settlement with the tax authority assuming full knowledge of the position and relevant facts.
The
Company conducts major businesses in China and is subject to tax in this jurisdiction. As a result of its business activities, the Company
will file tax returns that are subject to examination by the foreign tax authority.
|
| Going concern |
Going
concern
The
accompanying financial statements have been prepared using the going concern basis of accounting, which contemplates the realization
of assets and the satisfaction of liabilities in the normal course of business.
For
the year ended July 31, 2023, the Company has generated revenue of $146,252 and continuously incurred a net loss of $68,827. As of July
31, 2023, the Company suffered an accumulated deficit of $2,458,008, capital deficiency of $583,975 and negative operating cash flows
of $63,517. The Company’s ability to continue as a going concern is dependent upon improving the profitability and the continuing
financial support from its shareholders and director. Management believes the existing shareholders, director or external financing will
provide the additional cash to meet the Company’s obligations as they become due.
These
and other factors raise substantial doubt about the Company’s ability to continue as a going concern. These financial statements
do not include any adjustments to reflect the possible future effects on the recoverability and classification of assets or the amounts
and classification of liabilities that may result in the Company not being able to continue as a going concern.
|
| Net loss per share |
Net
loss per share
The
Company calculates net loss per share in accordance with ASC Topic 260 “Earnings Per Share”. Basic loss per share
is computed by dividing the net loss by the weighted average number of common shares outstanding during the period. Diluted loss per
share is computed similar to basic loss per share except that the denominator is increased to include the number of additional common
shares that would have been outstanding if the potential common stock equivalents had been issued and if the additional common shares
were dilutive.
|
| Foreign currencies translation |
Foreign
currencies translation
Transactions
denominated in currencies other than the functional currency are translated into the functional currency at the exchange rates prevailing
at the dates of the transaction. Monetary assets and liabilities denominated in currencies other than the functional currency are translated
into the functional currency using the applicable exchange rates at the balance sheet dates. The resulting exchange differences are recorded
in the Consolidated Statements of Operations and Comprehensive loss.
The
functional currency of the parent Company is United States dollar and the functional currency of the subsidiaries MU Worldwide Group
Limited (Seychelles) and MU Global Holding Limited (Hong Kong) is United States dollar. MU Global Health Management (Shanghai) Limited
is in Renminbi.
The
reporting currency of the Company and its subsidiary is United States Dollars (“US$”) and the accompanying financial statements
have been expressed in US$.
In
general, for consolidation purposes, assets and liabilities of its subsidiaries whose functional currency is not US$ are translated into
US$, in accordance with ASC Topic 830-30, “Translation of Financial Statement”, using the exchange rate on the balance
sheet date. Revenues and expenses are translated at average rates prevailing during the period. The gains and losses resulting from translation
of financial statements of foreign subsidiary are recorded as a separate component of accumulated other comprehensive loss within the
statements of stockholders’ equity.
Translation
of amounts from RMB, TWD and HK$ into US$1 has been made at the following exchange rates for the respective periods:
SCHEDULE
OF FOREIGN EXCHANGE RATES TRANSLATION
| | |
As of and for the year ended July 31, | |
| | |
2023 | | |
2022 | |
| Year-end RMB : US$1 exchange rate | |
| 7.136 | | |
| 6.744 | |
| Year-average RMB : US$1 exchange rate | |
| 6.989 | | |
| 6.476 | |
| Year-end HK$ : US$1 exchange rate | |
| 7.799 | | |
| 7.850 | |
| Year-average HK$ : US$1 exchange rate | |
| 7.835 | | |
| 7.811 | |
| Year-end TWD : US$1 exchange rate | |
| 31.461 | | |
| 30.044 | |
| Year-average TWD : US$1 exchange rate | |
| 30.805 | | |
| 28.500 | |
|
| Related parties |
Related
parties
Parties,
which can be a corporation or individual, are considered to be related if the Company has the ability, directly or indirectly, to control
the other party or exercise significant influence over the other party in making financial and operating decisions. Companies are also
considered to be related if they are subject to common control or common significant influence.
|
| Fair value of financial instruments |
Fair
value of financial instruments:
The
carrying value of the Company’s financial instruments: cash and cash equivalents, subscription receivables, prepayment and deposits,
accounts payable, and other payables and accrued liabilities approximate at their fair values because of the short-term nature of these
financial instruments.
The
Company also follows the guidance of the ASC Topic 820-10, “Fair Value Measurements and Disclosures” (“ASC 820-10”),
with respect to financial assets and liabilities that are measured at fair value. ASC 820-10 establishes a three-tier fair value hierarchy
that prioritizes the inputs used in measuring fair value as follows:
| |
Level
1: Observable inputs such as quoted prices in active markets; |
| |
|
| |
Level
2: Inputs, other than the quoted prices in active markets, that are observable either directly or indirectly; and |
| |
|
| |
Level
3: Unobservable inputs in which there is little or no market data, which require the reporting entity to develop its own assumptions. |
|
| Recently Adopted Accounting Standards |
Recently
Adopted Accounting Standards
In
June 2016, the FASB issued Accounting Standards Update No. 2016-13, Financial Instruments – Credit Losses (Topics 326): Measurement
of Credit Losses on Financial Instruments, which introduced the expected credit losses methodology for the measurement of credit losses
on financial assets measured at amortized cost basis, replacing the previous incurred loss methodology. In November 2019, the FASB issued
ASU 2019-10 highlighted the adoption timeline. For smaller reporting entities, Topic 326 is effective for annual periods beginning after
December 15, 2022, including interim period within those fiscal years, of which is effective for the Company on January 1, 2023.
Credit
loss rate is determined by historical collection based on aging schedule, adjusted for current conditions using reasonable and supportable
forecast. Based on the aging categorization and the adjusted loss per category, an allowance for credit losses is calculated by multiplying
the adjusted loss rate with the amortized cost in the respective age category.
Recent
accounting pronouncements
The
Company has implemented all new accounting pronouncements that are in effect. These pronouncements did not have any material impact on
the financial statements unless otherwise disclosed, and the Company does not believe that there are any other new accounting pronouncements
that have been issued that might have a material impact on its financial position or results of operations.
|
| X |
- DefinitionGoing Concern [Policy Text Block]
| Name: |
MUGH_GoingConcernPolicyTextBlock |
| Namespace Prefix: |
MUGH_ |
| Data Type: |
dtr-types:textBlockItemType |
| Balance Type: |
na |
| Period Type: |
duration |
|
| X |
- DefinitionRelated Parties [Policy Text Block]
| Name: |
MUGH_RelatedPartiesPolicyTextBlock |
| Namespace Prefix: |
MUGH_ |
| Data Type: |
dtr-types:textBlockItemType |
| Balance Type: |
na |
| Period Type: |
duration |
|
| X |
- References
+ Details
| Name: |
us-gaap_AccountingPoliciesAbstract |
| Namespace Prefix: |
us-gaap_ |
| Data Type: |
xbrli:stringItemType |
| Balance Type: |
na |
| Period Type: |
duration |
|
| X |
- DefinitionDisclosure of accounting policy for basis of accounting, or basis of presentation, used to prepare the financial statements (for example, US Generally Accepted Accounting Principles, Other Comprehensive Basis of Accounting, IFRS).
| Name: |
us-gaap_BasisOfAccountingPolicyPolicyTextBlock |
| Namespace Prefix: |
us-gaap_ |
| Data Type: |
dtr-types:textBlockItemType |
| Balance Type: |
na |
| Period Type: |
duration |
|
| X |
- DefinitionDisclosure of accounting policy for cash and cash equivalents, including the policy for determining which items are treated as cash equivalents. Other information that may be disclosed includes (1) the nature of any restrictions on the entity's use of its cash and cash equivalents, (2) whether the entity's cash and cash equivalents are insured or expose the entity to credit risk, (3) the classification of any negative balance accounts (overdrafts), and (4) the carrying basis of cash equivalents (for example, at cost) and whether the carrying amount of cash equivalents approximates fair value. Reference 1: http://fasb.org/us-gaap/role/ref/legacyRef
-Name Accounting Standards Codification
-Topic 230
-SubTopic 10
-Section 50
-Paragraph 1
-Publisher FASB
-URI https://asc.fasb.org//1943274/2147482913/230-10-50-1
| Name: |
us-gaap_CashAndCashEquivalentsPolicyTextBlock |
| Namespace Prefix: |
us-gaap_ |
| Data Type: |
dtr-types:textBlockItemType |
| Balance Type: |
na |
| Period Type: |
duration |
|
| X |
- DefinitionDisclosure of accounting policy regarding (1) the principles it follows in consolidating or combining the separate financial statements, including the principles followed in determining the inclusion or exclusion of subsidiaries or other entities in the consolidated or combined financial statements and (2) its treatment of interests (for example, common stock, a partnership interest or other means of exerting influence) in other entities, for example consolidation or use of the equity or cost methods of accounting. The accounting policy may also address the accounting treatment for intercompany accounts and transactions, noncontrolling interest, and the income statement treatment in consolidation for issuances of stock by a subsidiary. Reference 1: http://www.xbrl.org/2003/role/exampleRef
-Topic 235
-SubTopic 10
-Name Accounting Standards Codification
-Section 50
-Paragraph 4
-Subparagraph (a)
-Publisher FASB
-URI https://asc.fasb.org//1943274/2147483426/235-10-50-4
Reference 2: http://fasb.org/us-gaap/role/ref/legacyRef
-Name Accounting Standards Codification
-Topic 810
-SubTopic 10
-Section 50
-Paragraph 1
-Publisher FASB
-URI https://asc.fasb.org//1943274/2147481203/810-10-50-1
| Name: |
us-gaap_ConsolidationPolicyTextBlock |
| Namespace Prefix: |
us-gaap_ |
| Data Type: |
dtr-types:textBlockItemType |
| Balance Type: |
na |
| Period Type: |
duration |
|
| X |
- DefinitionDisclosure of accounting policy for cost of product sold and service rendered. Reference 1: http://www.xbrl.org/2009/role/commonPracticeRef
-Name Accounting Standards Codification
-Topic 705
-Publisher FASB
-URI https://asc.fasb.org//705/tableOfContent
| Name: |
us-gaap_CostOfSalesPolicyTextBlock |
| Namespace Prefix: |
us-gaap_ |
| Data Type: |
dtr-types:textBlockItemType |
| Balance Type: |
na |
| Period Type: |
duration |
|
| X |
- DefinitionDisclosure of accounting policy for computing basic and diluted earnings or loss per share for each class of common stock and participating security. Addresses all significant policy factors, including any antidilutive items that have been excluded from the computation and takes into account stock dividends, splits and reverse splits that occur after the balance sheet date of the latest reporting period but before the issuance of the financial statements. Reference 1: http://fasb.org/us-gaap/role/ref/legacyRef
-Name Accounting Standards Codification
-Topic 260
-SubTopic 10
-Section 50
-Paragraph 1
-Subparagraph (c)
-Publisher FASB
-URI https://asc.fasb.org//1943274/2147482662/260-10-50-1
Reference 2: http://fasb.org/us-gaap/role/ref/legacyRef
-Name Accounting Standards Codification
-Topic 260
-SubTopic 10
-Section 50
-Paragraph 2
-Publisher FASB
-URI https://asc.fasb.org//1943274/2147482662/260-10-50-2
| Name: |
us-gaap_EarningsPerSharePolicyTextBlock |
| Namespace Prefix: |
us-gaap_ |
| Data Type: |
dtr-types:textBlockItemType |
| Balance Type: |
na |
| Period Type: |
duration |
|
| X |
- DefinitionDisclosure of accounting policy for determining the fair value of financial instruments. Reference 1: http://fasb.org/us-gaap/role/ref/legacyRef
-Name Accounting Standards Codification
-Section 60
-Paragraph 1
-SubTopic 10
-Topic 820
-Publisher FASB
-URI https://asc.fasb.org//1943274/2147482053/820-10-60-1
Reference 2: http://fasb.org/us-gaap/role/ref/legacyRef
-Name Accounting Standards Codification
-Section 50
-Paragraph 1
-SubTopic 10
-Topic 825
-Publisher FASB
-URI https://asc.fasb.org//1943274/2147482907/825-10-50-1
| Name: |
us-gaap_FairValueOfFinancialInstrumentsPolicy |
| Namespace Prefix: |
us-gaap_ |
| Data Type: |
dtr-types:textBlockItemType |
| Balance Type: |
na |
| Period Type: |
duration |
|
| X |
- DefinitionDisclosure of accounting policy for (1) transactions denominated in a currency other than the reporting enterprise's functional currency, (2) translating foreign currency financial statements that are incorporated into the financial statements of the reporting enterprise by consolidation, combination, or the equity method of accounting, and (3) remeasurement of the financial statements of a foreign reporting enterprise in a hyperinflationary economy. Reference 1: http://www.xbrl.org/2003/role/disclosureRef
-Topic 830
-Name Accounting Standards Codification
-Publisher FASB
-URI https://asc.fasb.org//830/tableOfContent
| Name: |
us-gaap_ForeignCurrencyTransactionsAndTranslationsPolicyTextBlock |
| Namespace Prefix: |
us-gaap_ |
| Data Type: |
dtr-types:textBlockItemType |
| Balance Type: |
na |
| Period Type: |
duration |
|
| X |
- DefinitionDisclosure of accounting policy for the impairment and disposal of long-lived assets including goodwill and other intangible assets.
| Name: |
us-gaap_ImpairmentOrDisposalOfLongLivedAssetsIncludingIntangibleAssetsPolicyPolicyTextBlock |
| Namespace Prefix: |
us-gaap_ |
| Data Type: |
dtr-types:textBlockItemType |
| Balance Type: |
na |
| Period Type: |
duration |
|
| X |
- DefinitionDisclosure of accounting policy for income taxes, which may include its accounting policies for recognizing and measuring deferred tax assets and liabilities and related valuation allowances, recognizing investment tax credits, operating loss carryforwards, tax credit carryforwards, and other carryforwards, methodologies for determining its effective income tax rate and the characterization of interest and penalties in the financial statements. Reference 1: http://www.xbrl.org/2003/role/disclosureRef
-Topic 946
-SubTopic 10
-Name Accounting Standards Codification
-Section S99
-Paragraph 3
-Subparagraph (SX 210.6-03(h)(1))
-Publisher FASB
-URI https://asc.fasb.org//1943274/2147479886/946-10-S99-3
Reference 2: http://www.xbrl.org/2003/role/disclosureRef
-Topic 740
-SubTopic 10
-Name Accounting Standards Codification
-Section 50
-Paragraph 17
-Subparagraph (b)
-Publisher FASB
-URI https://asc.fasb.org//1943274/2147482685/740-10-50-17
Reference 3: http://www.xbrl.org/2003/role/disclosureRef
-Topic 740
-SubTopic 10
-Name Accounting Standards Codification
-Section 50
-Paragraph 9
-Publisher FASB
-URI https://asc.fasb.org//1943274/2147482685/740-10-50-9
Reference 4: http://www.xbrl.org/2003/role/disclosureRef
-Topic 740
-SubTopic 10
-Name Accounting Standards Codification
-Section 45
-Paragraph 25
-Publisher FASB
-URI https://asc.fasb.org//1943274/2147482525/740-10-45-25
Reference 5: http://www.xbrl.org/2003/role/disclosureRef
-Topic 740
-SubTopic 10
-Name Accounting Standards Codification
-Section 45
-Paragraph 28
-Publisher FASB
-URI https://asc.fasb.org//1943274/2147482525/740-10-45-28
Reference 6: http://www.xbrl.org/2003/role/disclosureRef
-Topic 740
-SubTopic 10
-Name Accounting Standards Codification
-Section 50
-Paragraph 19
-Publisher FASB
-URI https://asc.fasb.org//1943274/2147482685/740-10-50-19
Reference 7: http://www.xbrl.org/2003/role/disclosureRef
-Topic 220
-SubTopic 10
-Name Accounting Standards Codification
-Section 50
-Paragraph 1
-Publisher FASB
-URI https://asc.fasb.org//1943274/2147482765/220-10-50-1
Reference 8: http://www.xbrl.org/2003/role/disclosureRef
-Topic 740
-SubTopic 10
-Name Accounting Standards Codification
-Section 50
-Paragraph 20
-Publisher FASB
-URI https://asc.fasb.org//1943274/2147482685/740-10-50-20
| Name: |
us-gaap_IncomeTaxPolicyTextBlock |
| Namespace Prefix: |
us-gaap_ |
| Data Type: |
dtr-types:textBlockItemType |
| Balance Type: |
na |
| Period Type: |
duration |
|
| X |
- DefinitionDisclosure of inventory accounting policy for inventory classes, including, but not limited to, basis for determining inventory amounts, methods by which amounts are added and removed from inventory classes, loss recognition on impairment of inventories, and situations in which inventories are stated above cost. Reference 1: http://www.xbrl.org/2003/role/disclosureRef
-Topic 210
-SubTopic 10
-Name Accounting Standards Codification
-Section 50
-Paragraph 1
-Publisher FASB
-URI https://asc.fasb.org//1943274/2147483489/210-10-50-1
Reference 2: http://www.xbrl.org/2003/role/disclosureRef
-Topic 210
-SubTopic 10
-Name Accounting Standards Codification
-Section S99
-Paragraph 1
-Subparagraph (SX 210.5-02(6)(b))
-Publisher FASB
-URI https://asc.fasb.org//1943274/2147480566/210-10-S99-1
Reference 3: http://www.xbrl.org/2003/role/exampleRef
-Topic 235
-SubTopic 10
-Name Accounting Standards Codification
-Section 50
-Paragraph 4
-Subparagraph (d)
-Publisher FASB
-URI https://asc.fasb.org//1943274/2147483426/235-10-50-4
Reference 4: http://www.xbrl.org/2003/role/disclosureRef
-Topic 912
-SubTopic 330
-Name Accounting Standards Codification
-Section 50
-Paragraph 1
-Publisher FASB
-URI https://asc.fasb.org//1943274/2147482105/912-330-50-1
Reference 5: http://www.xbrl.org/2003/role/disclosureRef
-Topic 330
-Name Accounting Standards Codification
-Publisher FASB
-URI https://asc.fasb.org//330/tableOfContent
Reference 6: http://www.xbrl.org/2003/role/disclosureRef
-Topic 330
-SubTopic 10
-Name Accounting Standards Codification
-Section 50
-Paragraph 1
-Publisher FASB
-URI https://asc.fasb.org//1943274/2147483080/330-10-50-1
Reference 7: http://www.xbrl.org/2003/role/disclosureRef
-Topic 330
-SubTopic 10
-Name Accounting Standards Codification
-Section 50
-Paragraph 4
-Publisher FASB
-URI https://asc.fasb.org//1943274/2147483080/330-10-50-4
Reference 8: http://www.xbrl.org/2003/role/disclosureRef
-Name Accounting Standards Codification
-Section 45
-Paragraph 6
-Subparagraph (a)
-SubTopic 10
-Topic 270
-Publisher FASB
-URI https://asc.fasb.org//1943274/2147482989/270-10-45-6
| Name: |
us-gaap_InventoryPolicyTextBlock |
| Namespace Prefix: |
us-gaap_ |
| Data Type: |
dtr-types:textBlockItemType |
| Balance Type: |
na |
| Period Type: |
duration |
|
| X |
- DefinitionDisclosure of accounting policy for leasing arrangement entered into by lessee. Reference 1: http://www.xbrl.org/2003/role/disclosureRef
-Topic 842
-SubTopic 20
-Name Accounting Standards Codification
-Section 50
-Paragraph 1
-Subparagraph (b)
-Publisher FASB
-URI https://asc.fasb.org//1943274/2147478964/842-20-50-1
| Name: |
us-gaap_LesseeLeasesPolicyTextBlock |
| Namespace Prefix: |
us-gaap_ |
| Data Type: |
dtr-types:textBlockItemType |
| Balance Type: |
na |
| Period Type: |
duration |
|
| X |
- DefinitionDisclosure of accounting policy pertaining to new accounting pronouncements that may impact the entity's financial reporting. Includes, but is not limited to, quantification of the expected or actual impact.
| Name: |
us-gaap_NewAccountingPronouncementsPolicyPolicyTextBlock |
| Namespace Prefix: |
us-gaap_ |
| Data Type: |
dtr-types:textBlockItemType |
| Balance Type: |
na |
| Period Type: |
duration |
|
| X |
- DefinitionDisclosure of accounting policy for long-lived, physical asset used in normal conduct of business and not intended for resale. Includes, but is not limited to, work of art, historical treasure, and similar asset classified as collections. Reference 1: http://fasb.org/us-gaap/role/ref/legacyRef
-Name Accounting Standards Codification
-Section 50
-Paragraph 1
-SubTopic 10
-Topic 360
-Publisher FASB
-URI https://asc.fasb.org//1943274/2147482099/360-10-50-1
Reference 2: http://www.xbrl.org/2003/role/disclosureRef
-Topic 944
-SubTopic 210
-Name Accounting Standards Codification
-Section S99
-Paragraph 1
-Subparagraph (SX 210.7-03(a)(8)(a))
-Publisher FASB
-URI https://asc.fasb.org//1943274/2147479440/944-210-S99-1
Reference 3: http://www.xbrl.org/2003/role/disclosureRef
-Name Accounting Standards Codification
-Section 50
-Paragraph 6
-SubTopic 360
-Topic 958
-Publisher FASB
-URI https://asc.fasb.org//1943274/2147480321/958-360-50-6
Reference 4: http://www.xbrl.org/2003/role/disclosureRef
-Name Accounting Standards Codification
-Section 50
-Paragraph 1
-Subparagraph (d)
-SubTopic 360
-Topic 958
-Publisher FASB
-URI https://asc.fasb.org//1943274/2147480321/958-360-50-1
| Name: |
us-gaap_PropertyPlantAndEquipmentPolicyTextBlock |
| Namespace Prefix: |
us-gaap_ |
| Data Type: |
dtr-types:textBlockItemType |
| Balance Type: |
na |
| Period Type: |
duration |
|
| X |
- DefinitionDisclosure of accounting policy for revenue from contract with customer. Reference 1: http://www.xbrl.org/2003/role/disclosureRef
-Topic 606
-SubTopic 10
-Name Accounting Standards Codification
-Section 50
-Paragraph 17
-Publisher FASB
-URI https://asc.fasb.org//1943274/2147479806/606-10-50-17
Reference 2: http://www.xbrl.org/2003/role/disclosureRef
-Topic 606
-SubTopic 10
-Name Accounting Standards Codification
-Section 50
-Paragraph 19
-Publisher FASB
-URI https://asc.fasb.org//1943274/2147479806/606-10-50-19
Reference 3: http://www.xbrl.org/2003/role/disclosureRef
-Topic 606
-SubTopic 10
-Name Accounting Standards Codification
-Section 50
-Paragraph 18
-Subparagraph (a)
-Publisher FASB
-URI https://asc.fasb.org//1943274/2147479806/606-10-50-18
Reference 4: http://www.xbrl.org/2003/role/disclosureRef
-Topic 606
-SubTopic 10
-Name Accounting Standards Codification
-Section 50
-Paragraph 18
-Subparagraph (b)
-Publisher FASB
-URI https://asc.fasb.org//1943274/2147479806/606-10-50-18
Reference 5: http://www.xbrl.org/2003/role/disclosureRef
-Topic 606
-SubTopic 10
-Name Accounting Standards Codification
-Section 50
-Paragraph 20
-Subparagraph (a)
-Publisher FASB
-URI https://asc.fasb.org//1943274/2147479806/606-10-50-20
Reference 6: http://www.xbrl.org/2003/role/disclosureRef
-Topic 606
-SubTopic 10
-Name Accounting Standards Codification
-Section 50
-Paragraph 20
-Subparagraph (b)
-Publisher FASB
-URI https://asc.fasb.org//1943274/2147479806/606-10-50-20
Reference 7: http://www.xbrl.org/2003/role/disclosureRef
-Topic 606
-SubTopic 10
-Name Accounting Standards Codification
-Section 50
-Paragraph 20
-Subparagraph (c)
-Publisher FASB
-URI https://asc.fasb.org//1943274/2147479806/606-10-50-20
Reference 8: http://www.xbrl.org/2003/role/disclosureRef
-Topic 606
-SubTopic 10
-Name Accounting Standards Codification
-Section 50
-Paragraph 20
-Subparagraph (d)
-Publisher FASB
-URI https://asc.fasb.org//1943274/2147479806/606-10-50-20
Reference 9: http://www.xbrl.org/2003/role/exampleRef
-Name Accounting Standards Codification
-Section 50
-Paragraph 4
-Subparagraph (e)
-SubTopic 10
-Topic 235
-Publisher FASB
-URI https://asc.fasb.org//1943274/2147483426/235-10-50-4
Reference 10: http://www.xbrl.org/2003/role/disclosureRef
-Name Accounting Standards Codification
-Topic 606
-Publisher FASB
-URI https://asc.fasb.org//606/tableOfContent
| Name: |
us-gaap_RevenueFromContractWithCustomerPolicyTextBlock |
| Namespace Prefix: |
us-gaap_ |
| Data Type: |
dtr-types:textBlockItemType |
| Balance Type: |
na |
| Period Type: |
duration |
|
| X |
- DefinitionDisclosure of accounting policy for the use of estimates in the preparation of financial statements in conformity with generally accepted accounting principles. Reference 1: http://fasb.org/us-gaap/role/ref/legacyRef
-Name Accounting Standards Codification
-Topic 275
-SubTopic 10
-Section 50
-Paragraph 9
-Publisher FASB
-URI https://asc.fasb.org//1943274/2147482861/275-10-50-9
Reference 2: http://fasb.org/us-gaap/role/ref/legacyRef
-Name Accounting Standards Codification
-Topic 275
-SubTopic 10
-Section 50
-Paragraph 4
-Publisher FASB
-URI https://asc.fasb.org//1943274/2147482861/275-10-50-4
Reference 3: http://www.xbrl.org/2003/role/disclosureRef
-Name Accounting Standards Codification
-Section 50
-Paragraph 1
-Subparagraph (b)
-SubTopic 10
-Topic 275
-Publisher FASB
-URI https://asc.fasb.org//1943274/2147482861/275-10-50-1
Reference 4: http://www.xbrl.org/2003/role/disclosureRef
-Name Accounting Standards Codification
-Section 50
-Paragraph 1
-Subparagraph (c)
-SubTopic 10
-Topic 275
-Publisher FASB
-URI https://asc.fasb.org//1943274/2147482861/275-10-50-1
Reference 5: http://www.xbrl.org/2003/role/disclosureRef
-Name Accounting Standards Codification
-Section 50
-Paragraph 11
-SubTopic 10
-Topic 275
-Publisher FASB
-URI https://asc.fasb.org//1943274/2147482861/275-10-50-11
Reference 6: http://www.xbrl.org/2003/role/disclosureRef
-Name Accounting Standards Codification
-Section 50
-Paragraph 12
-SubTopic 10
-Topic 275
-Publisher FASB
-URI https://asc.fasb.org//1943274/2147482861/275-10-50-12
Reference 7: http://fasb.org/us-gaap/role/ref/legacyRef
-Name Accounting Standards Codification
-Topic 275
-SubTopic 10
-Section 50
-Paragraph 8
-Publisher FASB
-URI https://asc.fasb.org//1943274/2147482861/275-10-50-8
| Name: |
us-gaap_UseOfEstimates |
| Namespace Prefix: |
us-gaap_ |
| Data Type: |
dtr-types:textBlockItemType |
| Balance Type: |
na |
| Period Type: |
duration |
|
v3.23.3
ORGANIZATION AND BUSINESS BACKGROUND (Tables)
|
12 Months Ended |
Jul. 31, 2023 |
|---|
| Organization, Consolidation and Presentation of Financial Statements [Abstract] |
|
| SCHEDULE OF COMPANY’S SUBSIDIARY |
Details
of the Company’s subsidiaries:
SCHEDULE
OF COMPANY’S SUBSIDIARY
| | |
Company name | |
Place and
date of incorporation | |
Particulars of issued capital | |
Principal
activities | |
Proportional
of ownership interest and voting power held | |
| 1. | |
MU Worldwide Group Limited | |
Seychelles, June 7, 2018 | |
100 shares of ordinary share of US$1 each | |
Investment holding | |
| 100 | % |
| 2. | |
MU Global Holding Limited | |
Hong Kong, January 30, 2018 | |
1 share of ordinary share of HK$1 each | |
Providing SPA and wellness service in Hong Kong | |
| 100 | % |
| 3. | |
MU Global Health Management (Shanghai) Limited | |
Shanghai, August 16, 2018 | |
RMB 7,405,866 | |
Providing SPA and wellness service in China | |
| 100 | % |
|
| X |
- References
+ Details
| Name: |
us-gaap_OrganizationConsolidationAndPresentationOfFinancialStatementsAbstract |
| Namespace Prefix: |
us-gaap_ |
| Data Type: |
xbrli:stringItemType |
| Balance Type: |
na |
| Period Type: |
duration |
|
| X |
- DefinitionTabular disclosure of the key aspects of a subsidiary (partnership, corporation, or other entity) of the limited liability company or limited partnership.
| Name: |
us-gaap_ScheduleOfSubsidiaryOfLimitedLiabilityCompanyOrLimitedPartnershipDescriptionTextBlock |
| Namespace Prefix: |
us-gaap_ |
| Data Type: |
dtr-types:textBlockItemType |
| Balance Type: |
na |
| Period Type: |
duration |
|
v3.23.3
SUMMARY OF SIGNIFICANT ACCOUNTING POLICIES (Tables)
|
12 Months Ended |
Jul. 31, 2023 |
|---|
| Accounting Policies [Abstract] |
|
| SCHEDULE OF PROPERTY, PLANT AND EQUIPMENT ESTIMATED LIFE |
SCHEDULE
OF PROPERTY, PLANT AND EQUIPMENT ESTIMATED LIFE
| Classification |
|
Estimated
useful life |
| Leasable
equipment |
|
5
years |
| Computer
hardware and software |
|
3
years |
| Office
equipment |
|
3
years |
| Outlet
design fee and equipment |
|
3
years |
| Application
development fee |
|
3
years |
|
| SCHEDULE OF FOREIGN EXCHANGE RATES TRANSLATION |
Translation
of amounts from RMB, TWD and HK$ into US$1 has been made at the following exchange rates for the respective periods:
SCHEDULE
OF FOREIGN EXCHANGE RATES TRANSLATION
| | |
As of and for the year ended July 31, | |
| | |
2023 | | |
2022 | |
| Year-end RMB : US$1 exchange rate | |
| 7.136 | | |
| 6.744 | |
| Year-average RMB : US$1 exchange rate | |
| 6.989 | | |
| 6.476 | |
| Year-end HK$ : US$1 exchange rate | |
| 7.799 | | |
| 7.850 | |
| Year-average HK$ : US$1 exchange rate | |
| 7.835 | | |
| 7.811 | |
| Year-end TWD : US$1 exchange rate | |
| 31.461 | | |
| 30.044 | |
| Year-average TWD : US$1 exchange rate | |
| 30.805 | | |
| 28.500 | |
|
| X |
- DefinitionSchedule of Property Plant and Equipment Estimated Life [Table Text Block]
| Name: |
MUGH_ScheduleOfPropertyPlantAndEquipmentEstimatedLifeTableTextBlock |
| Namespace Prefix: |
MUGH_ |
| Data Type: |
dtr-types:textBlockItemType |
| Balance Type: |
na |
| Period Type: |
duration |
|
| X |
- References
+ Details
| Name: |
us-gaap_AccountingPoliciesAbstract |
| Namespace Prefix: |
us-gaap_ |
| Data Type: |
xbrli:stringItemType |
| Balance Type: |
na |
| Period Type: |
duration |
|
| X |
- DefinitionTabular disclosure of the presentation of foreign exchange contracts on the statement of financial position, including the fair value amounts and location of such amounts. Reference 1: http://fasb.org/us-gaap/role/ref/legacyRef
-Name Accounting Standards Codification
-Topic 815
-SubTopic 10
-Section 50
-Paragraph 4B
-Subparagraph (c)(1)
-Publisher FASB
-URI https://asc.fasb.org//1943274/2147480434/815-10-50-4B
| Name: |
us-gaap_ScheduleOfForeignExchangeContractsStatementOfFinancialPositionTableTextBlock |
| Namespace Prefix: |
us-gaap_ |
| Data Type: |
dtr-types:textBlockItemType |
| Balance Type: |
na |
| Period Type: |
duration |
|
v3.23.3
PROPERTY, PLANT AND EQUIPMENT (Tables)
|
12 Months Ended |
Jul. 31, 2023 |
|---|
| Property, Plant and Equipment [Abstract] |
|
| SCHEDULE OF PROPERTY, PLANT AND EQUIPMENT |
SCHEDULE OF PROPERTY, PLANT AND EQUIPMENT
| | |
As of
July 31, 2023 | | |
As of
July 31, 2022 | |
| | |
(Audited) | | |
(Audited) | |
| Computer hardware and software | |
$ | 129,301 | | |
$ | 129,301 | |
| Office equipment | |
| 120,569 | | |
| 120,569 | |
| Leasable equipment1 | |
| 216,378 | | |
| 229,405 | |
| Outlet design fee and equipment | |
| 16,763 | | |
| 16,763 | |
| Application development fee | |
| 37,413 | | |
| 37,413 | |
| Total | |
| 520,424 | | |
| 533,451 | |
| Accumulated depreciation2 | |
| (395,140 | ) | |
| (401,797 | ) |
| Impairment | |
| (143,182 | ) | |
| (149,552 | ) |
| Foreign currency translation adjustment | |
| 17,898 | | |
| 17,898 | |
| Property, plant and equipment, net | |
$ | - | | |
| - | |
| 1 |
For
the year ended July 31, 2023, $13,027 of equipment was disposed. |
| 2 |
Depreciation
expense for the year ended July 31, 2023 and July 31, 2022 was $0 and $94,600 respectively. |
|
| SCHEDULE OF WRITE OFF OF PROPERTY, PLANT AND EQUIPMENT |
WRITE
OFF OF PROPERTY, PLANT AND EQUIPMENT
SCHEDULE OF WRITE OFF OF PROPERTY, PLANT AND EQUIPMENT
| | |
| | |
| |
| | |
As of July 31, 2023 (Audited) | | |
As of July 31, 2022 (Audited) | |
| Write off of property and equipment | |
$ | - | | |
$ | 1,686 | |
| Accumulated depreciation | |
| - | | |
| (1,624 | ) |
| Foreign currency translation adjustment | |
| - | | |
| 38 | |
| Total write off of property and equipment | |
$ | - | | |
$ | 100 | |
|
| SCHEDULE OF DISPOSAL OF PROPERTY, PLANT AND EQUIPMENT |
DISPOSAL
OF PROPERTY, PLANT AND EQUIPMENT
SCHEDULE OF DISPOSAL OF PROPERTY, PLANT AND EQUIPMENT
| | |
| | |
| |
| | |
As of July 31, 2023 (Audited) | | |
As of July 31, 2022 (Audited) | |
| Proceed from disposal of property, plant and equipment | |
$ | 20,514 | | |
$ | 44,340 | |
| Disposal of equipment at cost | |
| - | | |
| (27,726 | ) |
| Disposal of equipment written off at net book value | |
| (6 | ) | |
| - | |
| Disposal of equipment impaired at net book value | |
| (6,364 | ) | |
| - | |
| Accumulated depreciation | |
| - | | |
| 10,965 | |
| Foreign currency translation adjustment | |
| - | | |
| (40 | ) |
| Total gain on disposal | |
$ | 14,144 | | |
$ | 27,539 | |
|
| X |
- DefinitionSchedule of Write Off of Property Plant and Equipment [Table Text Block]
| Name: |
MUGH_ScheduleOfWriteOffOfPropertyPlantAndEquipmentTableTextBlock |
| Namespace Prefix: |
MUGH_ |
| Data Type: |
dtr-types:textBlockItemType |
| Balance Type: |
na |
| Period Type: |
duration |
|
| X |
- DefinitionTabular disclosure of long lived assets held for sale. Disclosure may include the description of the facts and circumstances leading to the expected disposal, manner and timing of disposal, the carrying value of the assets held for sale, the gain (loss) recognized in the income statement and the income statement caption that includes that gain (loss). Reference 1: http://fasb.org/us-gaap/role/ref/legacyRef
-Name Accounting Standards Codification
-Section 50
-Paragraph 3
-SubTopic 10
-Topic 360
-Publisher FASB
-URI https://asc.fasb.org//1943274/2147482099/360-10-50-3
| Name: |
us-gaap_DisclosureOfLongLivedAssetsHeldForSaleTextBlock |
| Namespace Prefix: |
us-gaap_ |
| Data Type: |
dtr-types:textBlockItemType |
| Balance Type: |
na |
| Period Type: |
duration |
|
| X |
- References
+ Details
| Name: |
us-gaap_PropertyPlantAndEquipmentAbstract |
| Namespace Prefix: |
us-gaap_ |
| Data Type: |
xbrli:stringItemType |
| Balance Type: |
na |
| Period Type: |
duration |
|
| X |
- DefinitionTabular disclosure of physical assets used in the normal conduct of business and not intended for resale. Includes, but is not limited to, balances by class of assets, depreciation and depletion expense and method used, including composite depreciation, and accumulated deprecation. Reference 1: http://fasb.org/us-gaap/role/ref/legacyRef
-Name Accounting Standards Codification
-Section 50
-Paragraph 1
-SubTopic 10
-Topic 360
-Publisher FASB
-URI https://asc.fasb.org//1943274/2147482099/360-10-50-1
| Name: |
us-gaap_PropertyPlantAndEquipmentTextBlock |
| Namespace Prefix: |
us-gaap_ |
| Data Type: |
dtr-types:textBlockItemType |
| Balance Type: |
na |
| Period Type: |
duration |
|
v3.23.3
LEASE (Tables)
|
12 Months Ended |
Jul. 31, 2023 |
|---|
| Lease |
|
| SCHEDULE OF RECOGNITION OF OPERATING LEASE RIGHT AND LEASE LIABILITY |
The
initial recognition of operating lease right and lease liability as follow:
SCHEDULE OF RECOGNITION OF OPERATING LEASE RIGHT AND LEASE LIABILITY
| | |
| | |
| Gross lease payable | |
$ | 12,048 | |
| Less: Imputed interest | |
| (467 | ) |
| Initial recognition | |
$ | 11,581 | |
| Less: Remeasurement of existing lease | |
| (843 | ) |
| Balance | |
$ | 10,738 | |
|
| SCHEDULE OF OPERATING LEASE RIGHT OF USE ASSET |
As
of July 31, 2023 and July 31, 2022 operating lease right of use asset as follow:
SCHEDULE OF OPERATING LEASE RIGHT OF USE ASSET
| | |
As of July 31, 2023 (Audited) | | |
As of July 31, 2022 (Audited) | |
| Balance | |
| 6,267 | | |
| 12,966 | |
| Less: Termination of lease | |
| - | | |
| (10,285 | ) |
| Add: New operating lease liability | |
| 5,223 | | |
| 10,738 | |
| Foreign exchange translation loss | |
| (246 | ) | |
| (407 | ) |
| Amortization | |
| (4,837 | ) | |
| (6,745 | ) |
| Balance end of the year | |
$ | 6,407 | | |
$ | 6,267 | |
|
| SCHEDULE OF OPERATING LEASE LIABILITY |
As
of July 31, 2023 and July 31, 2022 operating lease liability as follow:
SCHEDULE
OF OPERATING LEASE LIABILITY
| | |
As of July 31, 2023 (Audited) | | |
As of July 31, 2022 (Audited) | |
| As of August 1 | |
$ | 6,559 | | |
$ | 2,647 | |
| Less: Termination of lease | |
| - | | |
| (2,647 | ) |
| Add: New operating lease liability | |
| 5,223 | | |
| 11,581 | |
| Less: Remeasurement of existing lease | |
| - | | |
| (843 | ) |
| Less: Gross repayment | |
| (5,509 | ) | |
| (3,892 | ) |
| Add: Imputed interest | |
| 176 | | |
| 278 | |
| Foreign exchange translation loss | |
| (250 | ) | |
| (565 | ) |
| Balance end of the period/year | |
$ | 6,199 | | |
$ | 6,559 | |
|
| SCHEDULE OF MATURITIES OF OPERATING LEASE OBLIGATION |
Maturities
of operating lease obligation as follow:
SCHEDULE
OF MATURITIES OF OPERATING LEASE OBLIGATION
| | |
| | |
| Year ending | |
| | |
| July 31, 2024 (12 months) | |
| 5,223 | |
| October 31, 2024 (3 months) | |
| 976 | |
| Total | |
$ | 6,199 | |
|
| SCHEDULE OF OTHER INFORMATION |
Other
information:
SCHEDULE
OF OTHER INFORMATION
| | |
Year ended | | |
Year ended | |
| | |
July 31, 2023 | | |
July 31, 2022 | |
| | |
(Audited) | | |
(Audited) | |
| Cash paid for amounts included in the measurement of lease liabilities: | |
| | | |
| | |
| Operating cash flow from operating lease | |
$ | 5,395 | | |
$ | 6,185 | |
| Right-of-use assets obtained in exchange for operating lease liabilities | |
$ | 6,407 | | |
$ | 6,267 | |
| Remaining lease term for operating lease (years) | |
| 1.25 | | |
| 1.25 | |
| Weighted average discount rate for operating lease | |
| 4.35 | % | |
| 4.35 | % |
|
| X |
- References
+ Details
| Name: |
MUGH_DisclosureLeaseAbstract |
| Namespace Prefix: |
MUGH_ |
| Data Type: |
xbrli:stringItemType |
| Balance Type: |
na |
| Period Type: |
duration |
|
| X |
- DefinitionSchedule of Operating Lease Right of Use Asset [Table Text Block]
| Name: |
MUGH_ScheduleOfOperatingLeaseRightOfUseAssetTableTextBlock |
| Namespace Prefix: |
MUGH_ |
| Data Type: |
dtr-types:textBlockItemType |
| Balance Type: |
na |
| Period Type: |
duration |
|
| X |
- DefinitionSchedule of Recognition of Operating Lease Right and Lease Liability [Table Text Block]
| Name: |
MUGH_ScheduleOfRecognitionOfOperatingLeaseRightAndLeaseLiabilityTableTextBlock |
| Namespace Prefix: |
MUGH_ |
| Data Type: |
dtr-types:textBlockItemType |
| Balance Type: |
na |
| Period Type: |
duration |
|
| X |
- DefinitionSchedule Operating Leases of Lessee [Table Text Block]
| Name: |
MUGH_ScheduleOperatingLeasesOfLesseeTableTextBlock |
| Namespace Prefix: |
MUGH_ |
| Data Type: |
dtr-types:textBlockItemType |
| Balance Type: |
na |
| Period Type: |
duration |
|
| X |
- DefinitionTabular disclosure of lessee's lease cost. Includes, but is not limited to, interest expense for finance lease, amortization of right-of-use asset for finance lease, operating lease cost, short-term lease cost, variable lease cost and sublease income. Reference 1: http://www.xbrl.org/2009/role/commonPracticeRef
-Topic 842
-SubTopic 20
-Name Accounting Standards Codification
-Section 50
-Paragraph 4
-Publisher FASB
-URI https://asc.fasb.org//1943274/2147478964/842-20-50-4
| Name: |
us-gaap_LeaseCostTableTextBlock |
| Namespace Prefix: |
us-gaap_ |
| Data Type: |
dtr-types:textBlockItemType |
| Balance Type: |
na |
| Period Type: |
duration |
|
| X |
- DefinitionTabular disclosure of undiscounted cash flows of lessee's operating lease liability. Includes, but is not limited to, reconciliation of undiscounted cash flows to operating lease liability recognized in statement of financial position. Reference 1: http://www.xbrl.org/2009/role/commonPracticeRef
-Topic 842
-SubTopic 20
-Name Accounting Standards Codification
-Section 50
-Paragraph 6
-Publisher FASB
-URI https://asc.fasb.org//1943274/2147478964/842-20-50-6
| Name: |
us-gaap_LesseeOperatingLeaseLiabilityMaturityTableTextBlock |
| Namespace Prefix: |
us-gaap_ |
| Data Type: |
dtr-types:textBlockItemType |
| Balance Type: |
na |
| Period Type: |
duration |
|
v3.23.3
PATENT AND TRADEMARK (Tables)
|
12 Months Ended |
Jul. 31, 2023 |
|---|
| Goodwill and Intangible Assets Disclosure [Abstract] |
|
| SCHEDULE OF TRADEMARK |
SCHEDULE
OF TRADEMARK
| | |
As of | | |
As of | |
| | |
July 31, 2023 | | |
July 31, 2022 | |
| | |
(Audited) | | |
(Audited) | |
| Patent and trademark1 | |
$ | 35,988 | | |
$ | 32,404 | |
| Accumulated amortization | |
| (6,986 | ) | |
| (6,986 | ) |
| Impairment | |
| (28,976 | ) | |
| (25,392 | ) |
| Foreign currency translation adjustment | |
| (26 | ) | |
| (26 | ) |
| Trademark, net | |
$ | - | | |
$ | - | |
| 1 |
The
trademarks are held under the Company’s subsidiaries in Hong Kong and Shanghai, China. |
|
| X |
- References
+ Details
| Name: |
us-gaap_GoodwillAndIntangibleAssetsDisclosureAbstract |
| Namespace Prefix: |
us-gaap_ |
| Data Type: |
xbrli:stringItemType |
| Balance Type: |
na |
| Period Type: |
duration |
|
| X |
- DefinitionTabular disclosure of assets, excluding financial assets and goodwill, lacking physical substance with a finite life, by either major class or business segment. Reference 1: http://fasb.org/us-gaap/role/ref/legacyRef
-Name Accounting Standards Codification
-Topic 350
-SubTopic 30
-Section 50
-Paragraph 1
-Subparagraph (a)
-Publisher FASB
-URI https://asc.fasb.org//1943274/2147482665/350-30-50-1
Reference 2: http://fasb.org/us-gaap/role/ref/legacyRef
-Name Accounting Standards Codification
-Topic 350
-SubTopic 30
-Section 50
-Paragraph 2
-Subparagraph (a)
-Publisher FASB
-URI https://asc.fasb.org//1943274/2147482665/350-30-50-2
| Name: |
us-gaap_ScheduleOfFiniteLivedIntangibleAssetsTableTextBlock |
| Namespace Prefix: |
us-gaap_ |
| Data Type: |
dtr-types:textBlockItemType |
| Balance Type: |
na |
| Period Type: |
duration |
|
v3.23.3
PREPAYMENTS AND DEPOSITS (Tables)
|
12 Months Ended |
Jul. 31, 2023 |
|---|
| Prepayments And Deposits |
|
| SCHEDULE OF PREPAYMENTS AND DEPOSITS |
SCHEDULE
OF PREPAYMENTS AND DEPOSITS
| | |
As of | | |
As of | |
| | |
July 31, 2023 | | |
July 31, 2022 | |
| | |
(Audited) | | |
(Audited) | |
| Prepayments | |
$ | 4,017 | | |
$ | 40,382 | |
| Deposits | |
| 5,247 | | |
| 4,712 | |
| Total prepayments and deposits | |
$ | 9,264 | | |
$ | 45,094 | |
|
| X |
- References
+ Details
| Name: |
MUGH_DisclosurePrepaymentsAndDepositsAbstract |
| Namespace Prefix: |
MUGH_ |
| Data Type: |
xbrli:stringItemType |
| Balance Type: |
na |
| Period Type: |
duration |
|
| X |
- DefinitionSchedule of Prepayments and Deposits [Table Text Block]
| Name: |
MUGH_ScheduleOfPrepaymentsAndDepositsTableTextBlock |
| Namespace Prefix: |
MUGH_ |
| Data Type: |
dtr-types:textBlockItemType |
| Balance Type: |
na |
| Period Type: |
duration |
|
v3.23.3
AMOUNT DUE FROM RELATED PARTY (Tables)
|
12 Months Ended |
Jul. 31, 2023 |
|---|
| Amount Due From Related Party |
|
| SCHEDULE OF DUE FROM RELATED PARTY |
SCHEDULE OF DUE FROM RELATED PARTY
| | |
As of | | |
As of | |
| | |
July 31, 2023 | | |
July 31, 2022 | |
| | |
(Audited) | | |
(Audited) | |
| Tien Mu International Co., Ltd1 | |
$ | 2,112 | | |
$ | 11,295 | |
| Total amount due from related party | |
$ | 2,112 | | |
$ | 11,295 | |
| 1 |
Tien
Mu International Co., Ltd is owned by Ms. Niu Yen-Yen, the Director and Chief Executive Officer of the Company. Tien Mu International
Co., Ltd is an operating agent of the Company’s operation in Taiwan, which collects deposits from franchisees on behalf of
the Company. |
|
| X |
- DefinitionSchedule of Due From Related Party [Table Text Block]
| Name: |
MUGH_ScheduleOfDueFromRelatedPartyTableTextBlock |
| Namespace Prefix: |
MUGH_ |
| Data Type: |
dtr-types:textBlockItemType |
| Balance Type: |
na |
| Period Type: |
duration |
|
v3.23.3
| X |
- References
+ Details
| Name: |
us-gaap_InventoryDisclosureAbstract |
| Namespace Prefix: |
us-gaap_ |
| Data Type: |
xbrli:stringItemType |
| Balance Type: |
na |
| Period Type: |
duration |
|
| X |
- DefinitionTabular disclosure of the carrying amount as of the balance sheet date of merchandise, goods, commodities, or supplies held for future sale or to be used in manufacturing, servicing or production process. Reference 1: http://fasb.org/us-gaap/role/ref/legacyRef
-Topic 210
-SubTopic 10
-Name Accounting Standards Codification
-Section S99
-Paragraph 1
-Subparagraph (SX 210.5-02(6)(a))
-Publisher FASB
-URI https://asc.fasb.org//1943274/2147480566/210-10-S99-1
Reference 2: http://fasb.org/us-gaap/role/ref/legacyRef
-Topic 210
-SubTopic 10
-Name Accounting Standards Codification
-Section S99
-Paragraph 1
-Subparagraph (SX 210.5-02(6)(b))
-Publisher FASB
-URI https://asc.fasb.org//1943274/2147480566/210-10-S99-1
Reference 3: http://fasb.org/us-gaap/role/ref/legacyRef
-Topic 210
-SubTopic 10
-Name Accounting Standards Codification
-Section S99
-Paragraph 1
-Subparagraph (SX 210.5-02(6)(c))
-Publisher FASB
-URI https://asc.fasb.org//1943274/2147480566/210-10-S99-1
Reference 4: http://fasb.org/us-gaap/role/ref/legacyRef
-Name Accounting Standards Codification
-Topic 210
-SubTopic 10
-Section 50
-Paragraph 1
-Publisher FASB
-URI https://asc.fasb.org//1943274/2147483489/210-10-50-1
| Name: |
us-gaap_ScheduleOfInventoryCurrentTableTextBlock |
| Namespace Prefix: |
us-gaap_ |
| Data Type: |
dtr-types:textBlockItemType |
| Balance Type: |
na |
| Period Type: |
duration |
|
v3.23.3
LOAN FROM RELATED PARTY (Tables)
|
12 Months Ended |
Jul. 31, 2023 |
|---|
| Loan From Related Party |
|
| SCHEDULE OF LOAN FROM RELATED PARTY |
SCHEDULE
OF LOAN FROM RELATED PARTY
| | |
As of July 31, 2023 | | |
As of July 31, 2022 | |
| | |
(Audited) | | |
(Audited) | |
| Hong Ting Network Technology (Xiamen) Limited1 | |
| | | |
| | |
| Current | |
$ | - | | |
$ | 43,175 | |
| Total loan from related party | |
$ | - | | |
$ | 43,175 | |
| 1 |
Hong
Ting Network Technology (Xiamen) Limited is wholly-owned by Ms. Niu Yen-Yen, who is also the Director and Chief Executive Officer
of the Company. The loan is unsecured, interest-free and repayable on May 31, 2021 and further extended to May 31, 2023 with a loan
agreement entered on September 2, 2021. The remaining loan was being waived by Hong Ting Network Technology (Xiamen) Limited pursuant
to a debt waiver letter on June 1, 2023. |
|
| X |
- DefinitionSchedule of Loans From Related Party [Table Text Block]
| Name: |
MUGH_ScheduleOfLoansFromRelatedPartyTableTextBlock |
| Namespace Prefix: |
MUGH_ |
| Data Type: |
dtr-types:textBlockItemType |
| Balance Type: |
na |
| Period Type: |
duration |
|
v3.23.3
LOAN FROM THIRD PARTY (Tables)
|
12 Months Ended |
Jul. 31, 2023 |
|---|
| Loan From Third Party |
|
| SCHEDULE OF LOAN FROM THIRD PARTY |
SCHEDULE OF LOAN FROM THIRD PARTY
| | |
As of July 31, 2023 | | |
As of July 31, 2022 | |
| | |
(Audited) | | |
(Audited) | |
| Shang Hai Shi Ba Enterprise Management Centre | |
$ | 95,988 | | |
$ | 77,064 | |
| Total loan from third party | |
$ | 95,988 | | |
$ | 77,064 | |
|
| X |
- References
+ Details
| Name: |
MUGH_DisclosureLoanFromThirdPartyAbstract |
| Namespace Prefix: |
MUGH_ |
| Data Type: |
xbrli:stringItemType |
| Balance Type: |
na |
| Period Type: |
duration |
|
| X |
- DefinitionSchedule of Loans From Third Party [Table Text Block]
| Name: |
MUGH_ScheduleOfLoansFromThirdPartyTableTextBlock |
| Namespace Prefix: |
MUGH_ |
| Data Type: |
dtr-types:textBlockItemType |
| Balance Type: |
na |
| Period Type: |
duration |
|
v3.23.3
LOAN FROM DIRECTOR (Tables)
|
12 Months Ended |
Jul. 31, 2023 |
|---|
| Loan From Director |
|
| SCHEDULE OF LOAN FROM DIRECTOR |
SCHEDULE OF LOAN FROM DIRECTOR
| | |
As of July 31, 2023 | | |
As of July 31, 2022 | |
| | |
(Audited) | | |
(Audited) | |
| Current | |
$ | 170,805 | | |
$ | 146,439 | |
| Non-current | |
| 110,985 | | |
| 122,652 | |
| Total loan from director | |
$ | 281,790 | | |
$ | 269,091 | |
|
| X |
- References
+ Details
| Name: |
MUGH_DisclosureLoanFromDirectorAbstract |
| Namespace Prefix: |
MUGH_ |
| Data Type: |
xbrli:stringItemType |
| Balance Type: |
na |
| Period Type: |
duration |
|
| X |
- DefinitionSchedule of Loan From Director [Table Table Block]
| Name: |
MUGH_MUGH_ScheduleOfLoanFromDirectorTableTableBlock |
| Namespace Prefix: |
MUGH_ |
| Data Type: |
dtr-types:textBlockItemType |
| Balance Type: |
na |
| Period Type: |
duration |
|
v3.23.3
OTHER PAYABLES AND ACCRUED LIABILITIES (Tables)
|
12 Months Ended |
Jul. 31, 2023 |
|---|
| Payables and Accruals [Abstract] |
|
| SCHEDULE OF OTHER PAYABLES AND ACCRUED LIABILITIES |
SCHEDULE OF OTHER PAYABLES AND ACCRUED LIABILITIES
| | |
As of | | |
As of | |
| | |
July 31, 2023 | | |
July 31, 2022 | |
| | |
(Audited) | | |
(Audited) | |
| Other payables | |
$ | 40,854 | | |
$ | 45,865 | |
| Accrued audit fees | |
| 15,000 | | |
| 15,000 | |
| Accrued professional fees | |
| 9,600 | | |
| 5,000 | |
| Total other payables and accrued liabilities | |
$ | 65,454 | | |
$ | 65,865 | |
|
| X |
- References
+ Details
| Name: |
us-gaap_PayablesAndAccrualsAbstract |
| Namespace Prefix: |
us-gaap_ |
| Data Type: |
xbrli:stringItemType |
| Balance Type: |
na |
| Period Type: |
duration |
|
| X |
- DefinitionTabular disclosure of the (a) carrying value as of the balance sheet date of liabilities incurred (and for which invoices have typically been received) and payable to vendors for goods and services received that are used in an entity's business (accounts payable); (b) other payables; and (c) accrued liabilities. Examples include taxes, interest, rent and utilities. Used to reflect the current portion of the liabilities (due within one year or within the normal operating cycle if longer). An alternative caption includes accrued expenses.
| Name: |
us-gaap_ScheduleOfAccountsPayableAndAccruedLiabilitiesTableTextBlock |
| Namespace Prefix: |
us-gaap_ |
| Data Type: |
dtr-types:textBlockItemType |
| Balance Type: |
na |
| Period Type: |
duration |
|
v3.23.3
AMOUNT DUE TO RELATED PARTY (Tables)
|
12 Months Ended |
Jul. 31, 2023 |
|---|
| Amount Due To Related Party |
|
| SCHEDULE OF DUE TO RELATED PARTIES |
SCHEDULE OF DUE TO RELATED PARTIES
| | |
As of July 31, 2023 | | |
As of July 31, 2022 | |
| | |
(Audited) | | |
(Audited) | |
| Hsieh, Chang-Chung1 | |
| 93,176 | | |
| 85,076 | |
| | |
$ | 93,176 | | |
$ | 85,076 | |
As
of July 31, 2023, the balance $93,176 represented an outstanding payable to related party.
| 1 | Hsieh,
Chang-Chung is the Chief Financial Officer (“Principal Financial Officer”, “Principal Accounting Officer”)
of the Company, and the amount represents the salary expense accrued. On November 1, 2022, Mr. Hsieh resigned as Chief Financial
Officer of the Company. |
|
| X |
- DefinitionSchedule of Amount Due to Related Parties [Table Text Block]
| Name: |
MUGH_ScheduleOfAmountDueToRelatedPartiesTableTextBlock |
| Namespace Prefix: |
MUGH_ |
| Data Type: |
dtr-types:textBlockItemType |
| Balance Type: |
na |
| Period Type: |
duration |
|
v3.23.3
INCOME TAXES (Tables)
|
12 Months Ended |
Jul. 31, 2023 |
|---|
| Income Tax Disclosure [Abstract] |
|
| SCHEDULE OF LOSS BEFORE INCOME TAX |
For
the year ended July 31, 2023 and July 31, 2022, the local (United States) and foreign components of (loss)/profit before income taxes
were comprised of the following:
SCHEDULE
OF LOSS BEFORE INCOME TAX
| | |
Year ended
July 31, 2023 | | |
Year ended
July 31, 2022 | |
| | |
(Audited) | | |
(Audited) | |
| Tax jurisdictions from: | |
| | | |
| | |
| - Local | |
$ | (53,650 | ) | |
$ | (52,675 | ) |
| - Foreign, representing | |
| | | |
| | |
| Seychelles | |
| (1,600 | ) | |
| (2,101 | ) |
| Hong Kong | |
| 13,363 | | |
| (97,033 | ) |
| People’s Republic of China (“PRC”) | |
| (26,940 | ) | |
| (205,524 | ) |
| Loss before income tax | |
$ | ) | |
$ | ) |
|
| SCHEDULE OF PROVISION FOR INCOME TAXES |
The
provision for income taxes consisted of the following:
SCHEDULE
OF PROVISION FOR INCOME TAXES
| | |
Year ended
July 31, 2023 | | |
Year ended
July 31, 2022 | |
| | |
(Audited) | | |
(Audited) | |
| Current: | |
| | | |
| | |
| - Local | |
$ | - | | |
$ | - | |
| - Foreign | |
| - | | |
| - | |
| | |
| | | |
| | |
| Deferred: | |
| | | |
| | |
| - Local | |
| - | | |
| - | |
| - Foreign | |
| - | | |
| - | |
| | |
| | | |
| | |
| Income tax expense | |
$ | - | | |
$ | - | |
|
| X |
- DefinitionTabular disclosure of the components of income tax expense attributable to continuing operations for each year presented including, but not limited to: current tax expense (benefit), deferred tax expense (benefit), investment tax credits, government grants, the benefits of operating loss carryforwards, tax expense that results from allocating certain tax benefits either directly to contributed capital or to reduce goodwill or other noncurrent intangible assets of an acquired entity, adjustments of a deferred tax liability or asset for enacted changes in tax laws or rates or a change in the tax status of the entity, and adjustments of the beginning-of-the-year balances of a valuation allowance because of a change in circumstances that causes a change in judgment about the realizability of the related deferred tax asset in future years. Reference 1: http://fasb.org/us-gaap/role/ref/legacyRef
-Topic 740
-SubTopic 10
-Name Accounting Standards Codification
-Paragraph 9
-Section 50
-Publisher FASB
-URI https://asc.fasb.org//1943274/2147482685/740-10-50-9
| Name: |
us-gaap_ScheduleOfComponentsOfIncomeTaxExpenseBenefitTableTextBlock |
| Namespace Prefix: |
us-gaap_ |
| Data Type: |
dtr-types:textBlockItemType |
| Balance Type: |
na |
| Period Type: |
duration |
|
| X |
- DefinitionTabular disclosure of income before income tax between domestic and foreign jurisdictions. Reference 1: http://www.xbrl.org/2009/role/commonPracticeRef
-Topic 235
-SubTopic 10
-Name Accounting Standards Codification
-Section S99
-Paragraph 1
-Subparagraph (SX 210.4-08(h)(1)(Note 1))
-Publisher FASB
-URI https://asc.fasb.org//1943274/2147480678/235-10-S99-1
| Name: |
us-gaap_ScheduleOfIncomeBeforeIncomeTaxDomesticAndForeignTableTextBlock |
| Namespace Prefix: |
us-gaap_ |
| Data Type: |
dtr-types:textBlockItemType |
| Balance Type: |
na |
| Period Type: |
duration |
|
v3.23.3
CONCENTRATIONS OF RISKS (Tables)
|
12 Months Ended |
Jul. 31, 2023 |
|---|
| Risks and Uncertainties [Abstract] |
|
| SCHEDULE OF CONCENTRATION OF RISK |
For
the year ended July 31, 2023 and 2022, the customers who accounted for 10% or more of the Company’s revenues and its accounts receivable
balance at year end are presented as follows:
SCHEDULE
OF CONCENTRATION OF RISK
| | |
2023 | | |
2022 | | |
2023 | | |
2022 | | |
2023 | | |
2022 | |
| | |
Revenues | | |
Percentage of
revenues | | |
Accounts
receivable, trade | |
| | |
(Audited) | | |
(Audited) | | |
(Audited) | |
| | |
| | |
| | |
| | |
| | |
| | |
| |
| Customer A | |
$ | - | | |
$ | 37,062 | | |
| - | % | |
| 79 | % | |
$ | - | | |
$ | - | |
| Customer B | |
| 120,938 | | |
| - | | |
| 83 | % | |
| - | % | |
| - | | |
| - | |
| Customer C | |
| 17,171 | | |
| - | | |
| 12 | % | |
| - | % | |
| - | | |
| - | |
| | |
$ | 138,109 | | |
$ | 37,062 | | |
| 95 | % | |
| 79 | % | |
$ | - | | |
$ | - | |
(b)
Major suppliers
For
the year ended July 31, 2023 and 2022, the vendors who accounted for 10% or more of the Company’s purchase and its accounts payable
balances at year end are presented as follows:
| | |
2023 | | |
2022 | | |
2023 | | |
2022 | | |
2023 | | |
2022 | |
| | |
Purchases | | |
Percentage of
purchases | | |
Accounts
payable, trade | |
| | |
(Audited) | | |
(Audited) | | |
(Audited) | |
| | |
| | |
| | |
| | |
| | |
| | |
| |
| Vendor A | |
$ | 108,844 | | |
$ | - | | |
| 100 | % | |
| - | % | |
$ | - | | |
$ | - | |
| | |
$ | 108,844 | | |
$ | - | | |
| 100 | % | |
| - | % | |
$ | - | | |
$ | - | |
|
| X |
- References
+ Details
| Name: |
us-gaap_RisksAndUncertaintiesAbstract |
| Namespace Prefix: |
us-gaap_ |
| Data Type: |
xbrli:stringItemType |
| Balance Type: |
na |
| Period Type: |
duration |
|
| X |
- DefinitionTabular disclosure of the nature of a concentration, a benchmark to which it is compared, and the percentage that the risk is to the benchmark. Reference 1: http://fasb.org/us-gaap/role/ref/legacyRef
-Topic 825
-SubTopic 10
-Name Accounting Standards Codification
-Section 50
-Paragraph 21
-Publisher FASB
-URI https://asc.fasb.org//1943274/2147482907/825-10-50-21
Reference 2: http://fasb.org/us-gaap/role/ref/legacyRef
-Name Accounting Standards Codification
-Topic 825
-SubTopic 10
-Section 50
-Paragraph 20
-Publisher FASB
-URI https://asc.fasb.org//1943274/2147482907/825-10-50-20
Reference 3: http://fasb.org/us-gaap/role/ref/legacyRef
-Name Accounting Standards Codification
-Topic 275
-SubTopic 10
-Section 50
-Paragraph 18
-Publisher FASB
-URI https://asc.fasb.org//1943274/2147482861/275-10-50-18
Reference 4: http://fasb.org/us-gaap/role/ref/legacyRef
-Name Accounting Standards Codification
-Topic 275
-SubTopic 10
-Section 50
-Paragraph 20
-Publisher FASB
-URI https://asc.fasb.org//1943274/2147482861/275-10-50-20
Reference 5: http://fasb.org/us-gaap/role/ref/legacyRef
-Name Accounting Standards Codification
-Topic 275
-SubTopic 10
-Section 50
-Paragraph 16
-Publisher FASB
-URI https://asc.fasb.org//1943274/2147482861/275-10-50-16
Reference 6: http://fasb.org/us-gaap/role/ref/legacyRef
-Name Accounting Standards Codification
-Topic 275
-SubTopic 10
-Section 50
-Paragraph 21
-Publisher FASB
-URI https://asc.fasb.org//1943274/2147482861/275-10-50-21
| Name: |
us-gaap_SchedulesOfConcentrationOfRiskByRiskFactorTextBlock |
| Namespace Prefix: |
us-gaap_ |
| Data Type: |
dtr-types:textBlockItemType |
| Balance Type: |
na |
| Period Type: |
duration |
|
v3.23.3
| X |
- DefinitionSchedule of aggregate minimal rent payments [Table Text Block]
| Name: |
MUGH_ScheduleOfAggregateMinimalRentPaymentsTableTextBlock |
| Namespace Prefix: |
MUGH_ |
| Data Type: |
dtr-types:textBlockItemType |
| Balance Type: |
na |
| Period Type: |
duration |
|
| X |
- References
+ Details
| Name: |
us-gaap_CommitmentsAndContingenciesDisclosureAbstract |
| Namespace Prefix: |
us-gaap_ |
| Data Type: |
xbrli:stringItemType |
| Balance Type: |
na |
| Period Type: |
duration |
|
v3.23.3
RELATED PARTY TRANSACTIONS (Tables)
|
12 Months Ended |
Jul. 31, 2023 |
|---|
| Related Party Transactions [Abstract] |
|
| SCHEDULE OF OUTSTANDING PAYABLE TO RELATED PARTY |
For
the year ended July 31, 2023 and 2022, the Company has following transactions with related parties:
SCHEDULE
OF OUTSTANDING PAYABLE TO RELATED PARTY
| | |
Year ended
July 31, 2023 | | |
Year ended
July 31, 2022 | |
| | |
(Audited) | | |
(Audited) | |
| Professional fee paid: | |
| | | |
| | |
| - Related party A | |
$ | 16,080 | | |
$ | 16,580 | |
| | |
| | | |
| | |
| Consultation fee paid: | |
| | | |
| | |
| - Related party B | |
$ | 8,100 | | |
$ | 32,400 | |
| | |
| | | |
| | |
| Total | |
$ | 24,180 | | |
$ | 48,980 | |
|
| X |
- DefinitionTabular disclosure of related party transactions. Examples of related party transactions include, but are not limited to, transactions between (a) a parent company and its subsidiary; (b) subsidiaries of a common parent; (c) and entity and its principal owners and (d) affiliates.
| Name: |
us-gaap_ScheduleOfRelatedPartyTransactionsTableTextBlock |
| Namespace Prefix: |
us-gaap_ |
| Data Type: |
dtr-types:textBlockItemType |
| Balance Type: |
na |
| Period Type: |
duration |
|
v3.23.3
SEGMENT INFORMATION (Tables)
|
12 Months Ended |
Jul. 31, 2023 |
|---|
| Segment Reporting [Abstract] |
|
| SCHEDULE OF SEGMENT REPORTING INFORMATION |
The
Company had no inter-segment sales for the years presented. Summarized financial information concerning the Company’s reportable
segments is shown as below:
SCHEDULE
OF SEGMENT REPORTING INFORMATION
By
Geography:
| | |
Nevada | | |
Seychelles | | |
Hong Kong | | |
China | | |
Total | |
| | |
For the year ended July 31, 2023 | |
| | |
Nevada | | |
Seychelles | | |
Hong Kong | | |
China | | |
Total | |
| | |
| | |
| | |
| | |
| | |
| |
| Revenue | |
$ | - | | |
$ | - | | |
$ | 120,938 | | |
$ | 25,314 | | |
$ | 146,252 | |
| Cost of revenue | |
| - | | |
| - | | |
| (108,844 | ) | |
| (14,244 | ) | |
| (123,088 | ) |
| Other income | |
| - | | |
| - | | |
| 14,038 | | |
| 58,813 | | |
| 72,851 | |
| Selling and marketing expenses | |
| - | | |
| - | | |
| (200 | ) | |
| (1,331 | ) | |
| (1,531 | ) |
| General and administrative expenses | |
| (53,650 | ) | |
| (1,600 | ) | |
| (12,569 | ) | |
| (95,492 | ) | |
| (163,311 | ) |
| | |
| | | |
| | | |
| | | |
| | | |
| | |
| Total assets | |
$ | 3,150 | | |
$ | 1 | | |
$ | 8,254 | | |
$ | 12,136 | | |
$ | 23,541 | |
| | |
Nevada | | |
Seychelles | | |
Hong Kong | | |
China | | |
Total | |
| | |
For the year ended July 31, 2022 | |
| | |
Nevada | | |
Seychelles | | |
Hong Kong | | |
China | | |
Total | |
| | |
| | |
| | |
| | |
| | |
| |
| Revenue | |
$ | - | | |
$ | - | | |
$ | - | | |
$ | 46,702 | | |
$ | 46,702 | |
| Cost of revenue | |
| - | | |
| - | | |
| - | | |
| (21,891 | ) | |
| (21,891 | ) |
| Other income | |
| - | | |
| - | | |
| 27,781 | | |
| 22,255 | | |
| 50,036 | |
| Selling and marketing expenses | |
| - | | |
| (13 | ) | |
| (103 | ) | |
| (3,354 | ) | |
| (3,470 | ) |
| General and administrative expenses | |
| (52,675 | ) | |
| (2,088 | ) | |
| (124,711 | ) | |
| (249,236 | ) | |
| (428,710 | ) |
| | |
| | | |
| | | |
| | | |
| | | |
| | |
| Total assets | |
$ | 3,075 | | |
$ | 1 | | |
$ | 15,551 | | |
$ | 63,421 | | |
$ | 82,048 | |
|
| X |
- DefinitionTabular disclosure of the profit or loss and total assets for each reportable segment. An entity discloses certain information on each reportable segment if the amounts (a) are included in the measure of segment profit or loss reviewed by the chief operating decision maker or (b) are otherwise regularly provided to the chief operating decision maker, even if not included in that measure of segment profit or loss. Reference 1: http://fasb.org/us-gaap/role/ref/legacyRef
-Name Accounting Standards Codification
-Topic 350
-SubTopic 20
-Section 50
-Paragraph 1
-Publisher FASB
-URI https://asc.fasb.org//1943274/2147482573/350-20-50-1
Reference 2: http://fasb.org/us-gaap/role/ref/legacyRef
-Name Accounting Standards Codification
-Topic 280
-SubTopic 10
-Section 50
-Paragraph 25
-Publisher FASB
-URI https://asc.fasb.org//1943274/2147482810/280-10-50-25
Reference 3: http://fasb.org/us-gaap/role/ref/legacyRef
-Name Accounting Standards Codification
-Topic 280
-SubTopic 10
-Section 50
-Paragraph 22
-Publisher FASB
-URI https://asc.fasb.org//1943274/2147482810/280-10-50-22
Reference 4: http://fasb.org/us-gaap/role/ref/legacyRef
-Name Accounting Standards Codification
-Topic 280
-SubTopic 10
-Section 50
-Paragraph 30
-Publisher FASB
-URI https://asc.fasb.org//1943274/2147482810/280-10-50-30
| Name: |
us-gaap_ScheduleOfSegmentReportingInformationBySegmentTextBlock |
| Namespace Prefix: |
us-gaap_ |
| Data Type: |
dtr-types:textBlockItemType |
| Balance Type: |
na |
| Period Type: |
duration |
|
| X |
- References
+ Details
| Name: |
us-gaap_SegmentReportingAbstract |
| Namespace Prefix: |
us-gaap_ |
| Data Type: |
xbrli:stringItemType |
| Balance Type: |
na |
| Period Type: |
duration |
|
v3.23.3
| X |
- DefinitionParticulars of issued capital.
| Name: |
MUGH_ParticularsOfIssuedCapital |
| Namespace Prefix: |
MUGH_ |
| Data Type: |
xbrli:stringItemType |
| Balance Type: |
na |
| Period Type: |
duration |
|
| X |
- DefinitionPlace and date of incorporation.
| Name: |
MUGH_PlaceAndDateOfIncorporation |
| Namespace Prefix: |
MUGH_ |
| Data Type: |
xbrli:stringItemType |
| Balance Type: |
na |
| Period Type: |
duration |
|
| X |
- DefinitionThe percentage of ownership of common stock or equity participation in the investee accounted for under the equity method of accounting. Reference 1: http://www.xbrl.org/2003/role/disclosureRef
-Topic 323
-SubTopic 10
-Name Accounting Standards Codification
-Section 50
-Paragraph 3
-Subparagraph (a)(1)
-Publisher FASB
-URI https://asc.fasb.org//1943274/2147481687/323-10-50-3
| Name: |
us-gaap_EquityMethodInvestmentOwnershipPercentage |
| Namespace Prefix: |
us-gaap_ |
| Data Type: |
dtr-types:percentItemType |
| Balance Type: |
na |
| Period Type: |
instant |
|
| X |
- Details
| Name: |
srt_ScheduleOfEquityMethodInvestmentEquityMethodInvesteeNameAxis=MUGH_MUWorldwideGroupLimitedMember |
| Namespace Prefix: |
|
| Data Type: |
na |
| Balance Type: |
|
| Period Type: |
|
|
| X |
- Details
| Name: |
srt_ScheduleOfEquityMethodInvestmentEquityMethodInvesteeNameAxis=MUGH_MUGlobalHoldingLimitedMember |
| Namespace Prefix: |
|
| Data Type: |
na |
| Balance Type: |
|
| Period Type: |
|
|
| X |
- Details
| Name: |
srt_ScheduleOfEquityMethodInvestmentEquityMethodInvesteeNameAxis=MUGH_MUGlobalHealthManagementShanghaiLimitedMember |
| Namespace Prefix: |
|
| Data Type: |
na |
| Balance Type: |
|
| Period Type: |
|
|
v3.23.3
ORGANIZATION AND BUSINESS BACKGROUND (Details Narrative) - USD ($)
|
|
|
12 Months Ended |
|
Apr. 08, 2021 |
Jun. 29, 2018 |
Jul. 31, 2023 |
Jul. 31, 2022 |
Jul. 31, 2020 |
Jul. 31, 2021 |
| Consolidation, Less than Wholly Owned Subsidiary, Parent Ownership Interest, Effects of Changes, Net [Line Items] |
|
|
|
|
|
|
| Net income loss |
|
|
$ 68,827
|
$ 357,333
|
|
|
| Working capital |
|
|
382,433
|
|
|
|
| Accumulated deficit |
|
|
2,458,008
|
2,389,181
|
|
|
| Stockholders equity |
|
|
583,975
|
533,364
|
|
$ 190,907
|
| Net cash provided operating activities |
|
|
$ 63,517
|
$ 4,169
|
|
|
| Market expansion description |
|
|
the Company has been focusing to expand in the Chinese market, with other country also under consideration as target
destinations. As an emerging industry in China, the beauty and wellness industry are still in the early stage as there is a huge potential
for the industry to growth significantly. According to a report published by the Chinese State Department, the beauty and wellness industry
of the country is expected reach the market value of China 8 trillion Chinese Yuan by 2020, accounting for 6.5% of the country Gross
Domestic Product (GDP)
|
|
|
|
| Covid-19 [Member] |
|
|
|
|
|
|
| Consolidation, Less than Wholly Owned Subsidiary, Parent Ownership Interest, Effects of Changes, Net [Line Items] |
|
|
|
|
|
|
| Market expansion description |
based on Mckinsey and Company research report on April 8, 2021, shows that consumers
care deeply about wellness—and that their interest is growing and estimate the global wellness market at more than US$1.5 trillion,
with annual growth of 5 to 10 percent. A rise in both consumer interest and purchasing power presents tremendous opportunities for companies,
particularly as spending on personal wellness rebounds after stagnating or even declining during the COVID-19 crisis
|
|
|
|
In
year 2020, COVID-19 crisis has resulted the sales of the global beauty and wellness industry weak due to consumers have had limited access
to retail outlets and supply chain bottlenecks have reduced product availability. In China, the industry’s February sales fell
up to 80 percent compared with 2019.
|
|
| MU Worldwide Group Limited [Member] |
|
|
|
|
|
|
| Consolidation, Less than Wholly Owned Subsidiary, Parent Ownership Interest, Effects of Changes, Net [Line Items] |
|
|
|
|
|
|
| Acquired interest for private limited liability |
|
100.00%
|
|
|
|
|
| X |
- DefinitionMarket expansion description.
| Name: |
MUGH_MarketExpansionDescription |
| Namespace Prefix: |
MUGH_ |
| Data Type: |
xbrli:stringItemType |
| Balance Type: |
na |
| Period Type: |
duration |
|
| X |
- DefinitionLine items represent financial concepts included in a table. These concepts are used to disclose reportable information associated with domain members defined in one or many axes to the table.
| Name: |
us-gaap_ConsolidationLessThanWhollyOwnedSubsidiaryParentOwnershipInterestEffectsOfChangesNetLineItems |
| Namespace Prefix: |
us-gaap_ |
| Data Type: |
xbrli:stringItemType |
| Balance Type: |
na |
| Period Type: |
duration |
|
| X |
- DefinitionPercentage investment held by members or limited partners of limited liability company (LLC) or limited partnership (LP). Reference 1: http://fasb.org/us-gaap/role/ref/legacyRef
-Name Accounting Standards Codification
-Topic 272
-SubTopic 10
-Section 50
-Paragraph 3
-Subparagraph (b)
-Publisher FASB
-URI https://asc.fasb.org//1943274/2147482987/272-10-50-3
| Name: |
us-gaap_LimitedLiabilityCompanyLLCOrLimitedPartnershipLPMembersOrLimitedPartnersOwnershipInterest |
| Namespace Prefix: |
us-gaap_ |
| Data Type: |
dtr-types:percentItemType |
| Balance Type: |
na |
| Period Type: |
duration |
|
| X |
- DefinitionAmount of cash inflow (outflow) from operating activities, including discontinued operations. Operating activity cash flows include transactions, adjustments, and changes in value not defined as investing or financing activities. Reference 1: http://fasb.org/us-gaap/role/ref/legacyRef
-Topic 230
-SubTopic 10
-Name Accounting Standards Codification
-Section 45
-Paragraph 28
-Publisher FASB
-URI https://asc.fasb.org//1943274/2147482740/230-10-45-28
Reference 2: http://fasb.org/us-gaap/role/ref/legacyRef
-Topic 230
-SubTopic 10
-Name Accounting Standards Codification
-Section 45
-Paragraph 24
-Publisher FASB
-URI https://asc.fasb.org//1943274/2147482740/230-10-45-24
Reference 3: http://fasb.org/us-gaap/role/ref/legacyRef
-Topic 230
-SubTopic 10
-Name Accounting Standards Codification
-Section 45
-Paragraph 25
-Publisher FASB
-URI https://asc.fasb.org//1943274/2147482740/230-10-45-25
| Name: |
us-gaap_NetCashProvidedByUsedInOperatingActivities |
| Namespace Prefix: |
us-gaap_ |
| Data Type: |
xbrli:monetaryItemType |
| Balance Type: |
na |
| Period Type: |
duration |
|
| X |
- DefinitionThe portion of profit or loss for the period, net of income taxes, which is attributable to the parent. Reference 1: http://www.xbrl.org/2003/role/disclosureRef
-Topic 235
-SubTopic 10
-Name Accounting Standards Codification
-Section S99
-Paragraph 1
-Subparagraph (SX 210.4-08(g)(1)(ii))
-Publisher FASB
-URI https://asc.fasb.org//1943274/2147480678/235-10-S99-1
Reference 2: http://www.xbrl.org/2003/role/disclosureRef
-Topic 323
-SubTopic 10
-Name Accounting Standards Codification
-Section 50
-Paragraph 3
-Subparagraph (c)
-Publisher FASB
-URI https://asc.fasb.org//1943274/2147481687/323-10-50-3
Reference 3: http://www.xbrl.org/2003/role/disclosureRef
-Topic 825
-SubTopic 10
-Name Accounting Standards Codification
-Section 50
-Paragraph 28
-Subparagraph (f)
-Publisher FASB
-URI https://asc.fasb.org//1943274/2147482907/825-10-50-28
Reference 4: http://www.xbrl.org/2003/role/disclosureRef
-Topic 220
-SubTopic 10
-Name Accounting Standards Codification
-Section 50
-Paragraph 6
-Publisher FASB
-URI https://asc.fasb.org//1943274/2147482765/220-10-50-6
Reference 5: http://www.xbrl.org/2003/role/disclosureRef
-Topic 250
-SubTopic 10
-Name Accounting Standards Codification
-Section 50
-Paragraph 3
-Publisher FASB
-URI https://asc.fasb.org//1943274/2147483443/250-10-50-3
Reference 6: http://www.xbrl.org/2003/role/disclosureRef
-Topic 250
-SubTopic 10
-Name Accounting Standards Codification
-Section 50
-Paragraph 1
-Subparagraph (b)(2)
-Publisher FASB
-URI https://asc.fasb.org//1943274/2147483443/250-10-50-1
Reference 7: http://www.xbrl.org/2003/role/disclosureRef
-Topic 815
-SubTopic 40
-Name Accounting Standards Codification
-Section 65
-Paragraph 1
-Subparagraph (f)
-Publisher FASB
-URI https://asc.fasb.org//1943274/2147480175/815-40-65-1
Reference 8: http://www.xbrl.org/2003/role/disclosureRef
-Topic 250
-SubTopic 10
-Name Accounting Standards Codification
-Section 50
-Paragraph 8
-Publisher FASB
-URI https://asc.fasb.org//1943274/2147483443/250-10-50-8
Reference 9: http://www.xbrl.org/2003/role/disclosureRef
-Topic 250
-SubTopic 10
-Name Accounting Standards Codification
-Section 50
-Paragraph 9
-Publisher FASB
-URI https://asc.fasb.org//1943274/2147483443/250-10-50-9
Reference 10: http://www.xbrl.org/2003/role/disclosureRef
-Topic 250
-SubTopic 10
-Name Accounting Standards Codification
-Section 50
-Paragraph 11
-Subparagraph (a)
-Publisher FASB
-URI https://asc.fasb.org//1943274/2147483443/250-10-50-11
Reference 11: http://www.xbrl.org/2003/role/disclosureRef
-Topic 250
-SubTopic 10
-Name Accounting Standards Codification
-Section 50
-Paragraph 11
-Subparagraph (b)
-Publisher FASB
-URI https://asc.fasb.org//1943274/2147483443/250-10-50-11
Reference 12: http://www.xbrl.org/2003/role/disclosureRef
-Topic 250
-SubTopic 10
-Name Accounting Standards Codification
-Section 50
-Paragraph 4
-Publisher FASB
-URI https://asc.fasb.org//1943274/2147483443/250-10-50-4
Reference 13: http://www.xbrl.org/2003/role/exampleRef
-Topic 946
-SubTopic 830
-Name Accounting Standards Codification
-Section 55
-Paragraph 10
-Publisher FASB
-URI https://asc.fasb.org//1943274/2147480167/946-830-55-10
Reference 14: http://www.xbrl.org/2003/role/disclosureRef
-Topic 946
-SubTopic 220
-Name Accounting Standards Codification
-Section 45
-Paragraph 7
-Publisher FASB
-URI https://asc.fasb.org//1943274/2147483581/946-220-45-7
Reference 15: http://www.xbrl.org/2003/role/disclosureRef
-Topic 944
-SubTopic 220
-Name Accounting Standards Codification
-Section S99
-Paragraph 1
-Subparagraph (SX 210.7-04(18))
-Publisher FASB
-URI https://asc.fasb.org//1943274/2147483586/944-220-S99-1
Reference 16: http://www.xbrl.org/2003/role/disclosureRef
-Topic 280
-SubTopic 10
-Name Accounting Standards Codification
-Section 50
-Paragraph 22
-Publisher FASB
-URI https://asc.fasb.org//1943274/2147482810/280-10-50-22
Reference 17: http://www.xbrl.org/2003/role/disclosureRef
-Topic 946
-SubTopic 220
-Name Accounting Standards Codification
-Section S99
-Paragraph 1
-Subparagraph (SX 210.6-07(9))
-Publisher FASB
-URI https://asc.fasb.org//1943274/2147483575/946-220-S99-1
Reference 18: http://www.xbrl.org/2003/role/disclosureRef
-Topic 946
-SubTopic 220
-Name Accounting Standards Codification
-Section S99
-Paragraph 3
-Subparagraph (SX 210.6-09(1)(d))
-Publisher FASB
-URI https://asc.fasb.org//1943274/2147483575/946-220-S99-3
Reference 19: http://www.xbrl.org/2003/role/disclosureRef
-Topic 470
-SubTopic 10
-Name Accounting Standards Codification
-Section S99
-Paragraph 1A
-Subparagraph (SX 210.13-01(a)(4)(i))
-Publisher FASB
-URI https://asc.fasb.org//1943274/2147480097/470-10-S99-1A
Reference 20: http://www.xbrl.org/2009/role/commonPracticeRef
-Topic 470
-SubTopic 10
-Name Accounting Standards Codification
-Section S99
-Paragraph 1A
-Subparagraph (SX 210.13-01(a)(4)(ii))
-Publisher FASB
-URI https://asc.fasb.org//1943274/2147480097/470-10-S99-1A
Reference 21: http://www.xbrl.org/2003/role/disclosureRef
-Topic 470
-SubTopic 10
-Name Accounting Standards Codification
-Section S99
-Paragraph 1A
-Subparagraph (SX 210.13-01(a)(4)(iii)(A))
-Publisher FASB
-URI https://asc.fasb.org//1943274/2147480097/470-10-S99-1A
Reference 22: http://www.xbrl.org/2003/role/disclosureRef
-Topic 470
-SubTopic 10
-Name Accounting Standards Codification
-Section S99
-Paragraph 1A
-Subparagraph (SX 210.13-01(a)(4)(iv))
-Publisher FASB
-URI https://asc.fasb.org//1943274/2147480097/470-10-S99-1A
Reference 23: http://www.xbrl.org/2003/role/disclosureRef
-Topic 470
-SubTopic 10
-Name Accounting Standards Codification
-Section S99
-Paragraph 1A
-Subparagraph (SX 210.13-01(a)(5))
-Publisher FASB
-URI https://asc.fasb.org//1943274/2147480097/470-10-S99-1A
Reference 24: http://www.xbrl.org/2003/role/disclosureRef
-Topic 470
-SubTopic 10
-Name Accounting Standards Codification
-Section S99
-Paragraph 1B
-Subparagraph (SX 210.13-02(a)(4)(i))
-Publisher FASB
-URI https://asc.fasb.org//1943274/2147480097/470-10-S99-1B
Reference 25: http://www.xbrl.org/2003/role/disclosureRef
-Topic 470
-SubTopic 10
-Name Accounting Standards Codification
-Section S99
-Paragraph 1B
-Subparagraph (SX 210.13-02(a)(4)(iii)(A))
-Publisher FASB
-URI https://asc.fasb.org//1943274/2147480097/470-10-S99-1B
Reference 26: http://www.xbrl.org/2003/role/disclosureRef
-Topic 470
-SubTopic 10
-Name Accounting Standards Codification
-Section S99
-Paragraph 1B
-Subparagraph (SX 210.13-02(a)(4)(iii)(B))
-Publisher FASB
-URI https://asc.fasb.org//1943274/2147480097/470-10-S99-1B
Reference 27: http://www.xbrl.org/2003/role/disclosureRef
-Topic 470
-SubTopic 10
-Name Accounting Standards Codification
-Section S99
-Paragraph 1B
-Subparagraph (SX 210.13-02(a)(4)(iv))
-Publisher FASB
-URI https://asc.fasb.org//1943274/2147480097/470-10-S99-1B
Reference 28: http://www.xbrl.org/2003/role/disclosureRef
-Topic 470
-SubTopic 10
-Name Accounting Standards Codification
-Section S99
-Paragraph 1B
-Subparagraph (SX 210.13-02(a)(5))
-Publisher FASB
-URI https://asc.fasb.org//1943274/2147480097/470-10-S99-1B
Reference 29: http://www.xbrl.org/2003/role/disclosureRef
-Topic 280
-SubTopic 10
-Name Accounting Standards Codification
-Section 50
-Paragraph 30
-Subparagraph (b)
-Publisher FASB
-URI https://asc.fasb.org//1943274/2147482810/280-10-50-30
Reference 30: http://www.xbrl.org/2003/role/disclosureRef
-Topic 280
-SubTopic 10
-Name Accounting Standards Codification
-Section 50
-Paragraph 32
-Subparagraph (f)
-Publisher FASB
-URI https://asc.fasb.org//1943274/2147482810/280-10-50-32
Reference 31: http://www.xbrl.org/2003/role/disclosureRef
-Topic 260
-SubTopic 10
-Name Accounting Standards Codification
-Section 45
-Paragraph 60B
-Subparagraph (a)
-Publisher FASB
-URI https://asc.fasb.org//1943274/2147482689/260-10-45-60B
Reference 32: http://www.xbrl.org/2003/role/exampleRef
-Topic 280
-SubTopic 10
-Name Accounting Standards Codification
-Section 50
-Paragraph 31
-Publisher FASB
-URI https://asc.fasb.org//1943274/2147482810/280-10-50-31
Reference 33: http://www.xbrl.org/2003/role/disclosureRef
-Topic 280
-SubTopic 10
-Name Accounting Standards Codification
-Section 50
-Paragraph 32
-Subparagraph (c)
-Publisher FASB
-URI https://asc.fasb.org//1943274/2147482810/280-10-50-32
Reference 34: http://www.xbrl.org/2003/role/disclosureRef
-Topic 205
-SubTopic 20
-Name Accounting Standards Codification
-Section 50
-Paragraph 7
-Publisher FASB
-URI https://asc.fasb.org//1943274/2147483499/205-20-50-7
Reference 35: http://fasb.org/us-gaap/role/ref/legacyRef
-Topic 230
-SubTopic 10
-Name Accounting Standards Codification
-Section 45
-Paragraph 28
-Publisher FASB
-URI https://asc.fasb.org//1943274/2147482740/230-10-45-28
Reference 36: http://www.xbrl.org/2003/role/disclosureRef
-Topic 220
-SubTopic 10
-Name Accounting Standards Codification
-Section 45
-Paragraph 1A
-Subparagraph (a)
-Publisher FASB
-URI https://asc.fasb.org//1943274/2147482790/220-10-45-1A
Reference 37: http://www.xbrl.org/2003/role/disclosureRef
-Topic 220
-SubTopic 10
-Name Accounting Standards Codification
-Section 45
-Paragraph 1B
-Subparagraph (a)
-Publisher FASB
-URI https://asc.fasb.org//1943274/2147482790/220-10-45-1B
Reference 38: http://fasb.org/us-gaap/role/ref/legacyRef
-Topic 220
-SubTopic 10
-Name Accounting Standards Codification
-Section S99
-Paragraph 2
-Subparagraph (SX 210.5-03(20))
-Publisher FASB
-URI https://asc.fasb.org//1943274/2147483621/220-10-S99-2
Reference 39: http://fasb.org/us-gaap/role/ref/legacyRef
-Topic 942
-SubTopic 220
-Name Accounting Standards Codification
-Section S99
-Paragraph 1
-Subparagraph (SX 210.9-04(22))
-Publisher FASB
-URI https://asc.fasb.org//1943274/2147483589/942-220-S99-1
| Name: |
us-gaap_NetIncomeLoss |
| Namespace Prefix: |
us-gaap_ |
| Data Type: |
xbrli:monetaryItemType |
| Balance Type: |
credit |
| Period Type: |
duration |
|
| X |
- DefinitionAmount of accumulated undistributed earnings (deficit). Reference 1: http://www.xbrl.org/2003/role/exampleRef
-Topic 852
-SubTopic 10
-Name Accounting Standards Codification
-Section 55
-Paragraph 10
-Publisher FASB
-URI https://asc.fasb.org//1943274/2147481372/852-10-55-10
Reference 2: http://www.xbrl.org/2003/role/disclosureRef
-Topic 944
-SubTopic 40
-Name Accounting Standards Codification
-Section 65
-Paragraph 2
-Subparagraph (g)(2)(i)
-Publisher FASB
-URI https://asc.fasb.org//1943274/2147480016/944-40-65-2
Reference 3: http://www.xbrl.org/2003/role/disclosureRef
-Topic 944
-SubTopic 40
-Name Accounting Standards Codification
-Section 65
-Paragraph 2
-Subparagraph (h)(2)
-Publisher FASB
-URI https://asc.fasb.org//1943274/2147480016/944-40-65-2
Reference 4: http://www.xbrl.org/2003/role/disclosureRef
-Topic 946
-SubTopic 20
-Name Accounting Standards Codification
-Section 50
-Paragraph 11
-Publisher FASB
-URI https://asc.fasb.org//1943274/2147480990/946-20-50-11
Reference 5: http://www.xbrl.org/2003/role/disclosureRef
-Topic 944
-SubTopic 210
-Name Accounting Standards Codification
-Section S99
-Paragraph 1
-Subparagraph (SX 210.7-03(a)(23)(a)(4))
-Publisher FASB
-URI https://asc.fasb.org//1943274/2147479440/944-210-S99-1
Reference 6: http://www.xbrl.org/2003/role/disclosureRef
-Topic 946
-SubTopic 210
-Name Accounting Standards Codification
-Section S99
-Paragraph 1
-Subparagraph (SX 210.6-04(17))
-Publisher FASB
-URI https://asc.fasb.org//1943274/2147479617/946-210-S99-1
Reference 7: http://fasb.org/us-gaap/role/ref/legacyRef
-Topic 505
-SubTopic 10
-Name Accounting Standards Codification
-Section S99
-Paragraph 1
-Subparagraph (SX 210.3-04)
-Publisher FASB
-URI https://asc.fasb.org//1943274/2147480008/505-10-S99-1
Reference 8: http://fasb.org/us-gaap/role/ref/legacyRef
-Topic 210
-SubTopic 10
-Name Accounting Standards Codification
-Section S99
-Paragraph 1
-Subparagraph (SX 210.5-02(30)(a)(3))
-Publisher FASB
-URI https://asc.fasb.org//1943274/2147480566/210-10-S99-1
| Name: |
us-gaap_RetainedEarningsAccumulatedDeficit |
| Namespace Prefix: |
us-gaap_ |
| Data Type: |
xbrli:monetaryItemType |
| Balance Type: |
credit |
| Period Type: |
instant |
|
| X |
- DefinitionAmount of equity (deficit) attributable to parent. Excludes temporary equity and equity attributable to noncontrolling interest. Reference 1: http://www.xbrl.org/2003/role/exampleRef
-Topic 852
-SubTopic 10
-Name Accounting Standards Codification
-Section 55
-Paragraph 10
-Publisher FASB
-URI https://asc.fasb.org//1943274/2147481372/852-10-55-10
Reference 2: http://www.xbrl.org/2003/role/exampleRef
-Topic 946
-SubTopic 830
-Name Accounting Standards Codification
-Section 55
-Paragraph 12
-Publisher FASB
-URI https://asc.fasb.org//1943274/2147480167/946-830-55-12
Reference 3: http://www.xbrl.org/2003/role/disclosureRef
-Topic 946
-SubTopic 210
-Name Accounting Standards Codification
-Section S99
-Paragraph 1
-Subparagraph (SX 210.6-04(19))
-Publisher FASB
-URI https://asc.fasb.org//1943274/2147479617/946-210-S99-1
Reference 4: http://www.xbrl.org/2003/role/disclosureRef
-Topic 946
-SubTopic 210
-Name Accounting Standards Codification
-Section S99
-Paragraph 2
-Subparagraph (SX 210.6-05(4))
-Publisher FASB
-URI https://asc.fasb.org//1943274/2147479617/946-210-S99-2
Reference 5: http://www.xbrl.org/2009/role/commonPracticeRef
-Topic 946
-SubTopic 220
-Name Accounting Standards Codification
-Section S99
-Paragraph 3
-Subparagraph (SX 210.6-09(4)(b))
-Publisher FASB
-URI https://asc.fasb.org//1943274/2147483575/946-220-S99-3
Reference 6: http://www.xbrl.org/2003/role/disclosureRef
-Topic 946
-SubTopic 220
-Name Accounting Standards Codification
-Section S99
-Paragraph 3
-Subparagraph (SX 210.6-09(6))
-Publisher FASB
-URI https://asc.fasb.org//1943274/2147483575/946-220-S99-3
Reference 7: http://www.xbrl.org/2003/role/disclosureRef
-Topic 946
-SubTopic 220
-Name Accounting Standards Codification
-Section S99
-Paragraph 3
-Subparagraph (SX 210.6-09(7))
-Publisher FASB
-URI https://asc.fasb.org//1943274/2147483575/946-220-S99-3
Reference 8: http://www.xbrl.org/2009/role/commonPracticeRef
-Topic 235
-SubTopic 10
-Name Accounting Standards Codification
-Section S99
-Paragraph 1
-Subparagraph (SX 210.4-08(g)(1)(ii))
-Publisher FASB
-URI https://asc.fasb.org//1943274/2147480678/235-10-S99-1
Reference 9: http://www.xbrl.org/2009/role/commonPracticeRef
-Topic 323
-SubTopic 10
-Name Accounting Standards Codification
-Section 50
-Paragraph 3
-Subparagraph (c)
-Publisher FASB
-URI https://asc.fasb.org//1943274/2147481687/323-10-50-3
Reference 10: http://www.xbrl.org/2009/role/commonPracticeRef
-Topic 825
-SubTopic 10
-Name Accounting Standards Codification
-Section 50
-Paragraph 28
-Subparagraph (f)
-Publisher FASB
-URI https://asc.fasb.org//1943274/2147482907/825-10-50-28
Reference 11: http://fasb.org/us-gaap/role/ref/legacyRef
-Topic 210
-SubTopic 10
-Name Accounting Standards Codification
-Section S99
-Paragraph 1
-Subparagraph (SX 210.5-02(29))
-Publisher FASB
-URI https://asc.fasb.org//1943274/2147480566/210-10-S99-1
Reference 12: http://fasb.org/us-gaap/role/ref/legacyRef
-Topic 210
-SubTopic 10
-Name Accounting Standards Codification
-Section S99
-Paragraph 1
-Subparagraph (SX 210.5-02(31))
-Publisher FASB
-URI https://asc.fasb.org//1943274/2147480566/210-10-S99-1
Reference 13: http://fasb.org/us-gaap/role/ref/legacyRef
-Topic 210
-SubTopic 10
-Name Accounting Standards Codification
-Section S99
-Paragraph 1
-Subparagraph (SX 210.5-02(30))
-Publisher FASB
-URI https://asc.fasb.org//1943274/2147480566/210-10-S99-1
Reference 14: http://fasb.org/us-gaap/role/ref/legacyRef
-Topic 310
-SubTopic 10
-Name Accounting Standards Codification
-Section S99
-Paragraph 2
-Subparagraph (SAB Topic 4.E)
-Publisher FASB
-URI https://asc.fasb.org//1943274/2147480418/310-10-S99-2
| Name: |
us-gaap_StockholdersEquity |
| Namespace Prefix: |
us-gaap_ |
| Data Type: |
xbrli:monetaryItemType |
| Balance Type: |
credit |
| Period Type: |
instant |
|
| X |
- Details
| Name: |
srt_StatementScenarioAxis=MUGH_CovidNineteenMember |
| Namespace Prefix: |
|
| Data Type: |
na |
| Balance Type: |
|
| Period Type: |
|
|
| X |
- Details
| Name: |
srt_OwnershipAxis=MUGH_MUWorldwideGroupLimitedMember |
| Namespace Prefix: |
|
| Data Type: |
na |
| Balance Type: |
|
| Period Type: |
|
|
v3.23.3
| X |
- DefinitionLine items represent financial concepts included in a table. These concepts are used to disclose reportable information associated with domain members defined in one or many axes to the table.
| Name: |
us-gaap_PropertyPlantAndEquipmentLineItems |
| Namespace Prefix: |
us-gaap_ |
| Data Type: |
xbrli:stringItemType |
| Balance Type: |
na |
| Period Type: |
duration |
|
| X |
- DefinitionUseful life of long lived, physical assets used in the normal conduct of business and not intended for resale, in 'PnYnMnDTnHnMnS' format, for example, 'P1Y5M13D' represents the reported fact of one year, five months, and thirteen days. Examples include, but not limited to, land, buildings, machinery and equipment, office equipment, furniture and fixtures, and computer equipment.
| Name: |
us-gaap_PropertyPlantAndEquipmentUsefulLife |
| Namespace Prefix: |
us-gaap_ |
| Data Type: |
xbrli:durationItemType |
| Balance Type: |
na |
| Period Type: |
instant |
|
| X |
- Details
| Name: |
us-gaap_PropertyPlantAndEquipmentByTypeAxis=MUGH_LeasableEquipmentMember |
| Namespace Prefix: |
|
| Data Type: |
na |
| Balance Type: |
|
| Period Type: |
|
|
| X |
- Details
| Name: |
us-gaap_PropertyPlantAndEquipmentByTypeAxis=us-gaap_ComputerEquipmentMember |
| Namespace Prefix: |
|
| Data Type: |
na |
| Balance Type: |
|
| Period Type: |
|
|
| X |
- Details
| Name: |
us-gaap_PropertyPlantAndEquipmentByTypeAxis=MUGH_OutletEquipmentMember |
| Namespace Prefix: |
|
| Data Type: |
na |
| Balance Type: |
|
| Period Type: |
|
|
| X |
- Details
| Name: |
us-gaap_PropertyPlantAndEquipmentByTypeAxis=MUGH_OutletDesignFeeAndEquipmentMember |
| Namespace Prefix: |
|
| Data Type: |
na |
| Balance Type: |
|
| Period Type: |
|
|
| X |
- Details
| Name: |
us-gaap_PropertyPlantAndEquipmentByTypeAxis=MUGH_ApplicationDevelopmentFeeMember |
| Namespace Prefix: |
|
| Data Type: |
na |
| Balance Type: |
|
| Period Type: |
|
|
v3.23.3
SCHEDULE OF FOREIGN EXCHANGE RATES TRANSLATION (Details)
|
Jul. 31, 2023 |
Jul. 31, 2022 |
| Year End RMB: US$1 Exchange Rate [Member] |
|
|
| Trading Activity, Gains and Losses, Net [Line Items] |
|
|
| Foreign currency exchange rate, translation |
7.136
|
6.744
|
| Year Average RMB: US$1 Exchange Rate [Member] |
|
|
| Trading Activity, Gains and Losses, Net [Line Items] |
|
|
| Foreign currency exchange rate, translation |
6.989
|
6.476
|
| Year End HKD: US$1 Exchange Rate [Member] |
|
|
| Trading Activity, Gains and Losses, Net [Line Items] |
|
|
| Foreign currency exchange rate, translation |
7.799
|
7.850
|
| Year Average HKD: US$1 Exchange Rate [Member] |
|
|
| Trading Activity, Gains and Losses, Net [Line Items] |
|
|
| Foreign currency exchange rate, translation |
7.835
|
7.811
|
| Year End TWD: US$1 Exchange Rate [Member] |
|
|
| Trading Activity, Gains and Losses, Net [Line Items] |
|
|
| Foreign currency exchange rate, translation |
31.461
|
30.044
|
| Year Average TWD: US$1 Exchange Rate [Member] |
|
|
| Trading Activity, Gains and Losses, Net [Line Items] |
|
|
| Foreign currency exchange rate, translation |
30.805
|
28.500
|
| X |
- DefinitionForeign exchange rate used to translate amounts denominated in functional currency to reporting currency. Reference 1: http://www.xbrl.org/2003/role/disclosureRef
-Topic 830
-SubTopic 30
-Name Accounting Standards Codification
-Section 50
-Paragraph 2
-Publisher FASB
-URI https://asc.fasb.org//1943274/2147481674/830-30-50-2
Reference 2: http://www.xbrl.org/2003/role/disclosureRef
-Topic 830
-SubTopic 30
-Name Accounting Standards Codification
-Section S99
-Paragraph 1
-Publisher FASB
-URI https://asc.fasb.org//1943274/2147479424/830-30-S99-1
| Name: |
us-gaap_ForeignCurrencyExchangeRateTranslation1 |
| Namespace Prefix: |
us-gaap_ |
| Data Type: |
xbrli:pureItemType |
| Balance Type: |
na |
| Period Type: |
instant |
|
| X |
- DefinitionLine items represent financial concepts included in a table. These concepts are used to disclose reportable information associated with domain members defined in one or many axes to the table.
| Name: |
us-gaap_TradingActivityGainsAndLossesLineItems |
| Namespace Prefix: |
us-gaap_ |
| Data Type: |
xbrli:stringItemType |
| Balance Type: |
na |
| Period Type: |
duration |
|
| X |
- Details
| Name: |
us-gaap_TradingActivityByTypeAxis=MUGH_YearEndRMBUSDollarExchangeRateMember |
| Namespace Prefix: |
|
| Data Type: |
na |
| Balance Type: |
|
| Period Type: |
|
|
| X |
- Details
| Name: |
us-gaap_TradingActivityByTypeAxis=MUGH_YearAverageRMBUSDollarExchangeRateMember |
| Namespace Prefix: |
|
| Data Type: |
na |
| Balance Type: |
|
| Period Type: |
|
|
| X |
- Details
| Name: |
us-gaap_TradingActivityByTypeAxis=MUGH_YearEndHKUSDollarExchangeRateMember |
| Namespace Prefix: |
|
| Data Type: |
na |
| Balance Type: |
|
| Period Type: |
|
|
| X |
- Details
| Name: |
us-gaap_TradingActivityByTypeAxis=MUGH_YearAverageHKUSDollarExchangeRateMember |
| Namespace Prefix: |
|
| Data Type: |
na |
| Balance Type: |
|
| Period Type: |
|
|
| X |
- Details
| Name: |
us-gaap_TradingActivityByTypeAxis=MUGH_YearEndTWDUSDollarExchangeRateMember |
| Namespace Prefix: |
|
| Data Type: |
na |
| Balance Type: |
|
| Period Type: |
|
|
| X |
- Details
| Name: |
us-gaap_TradingActivityByTypeAxis=MUGH_YearAverageTWDUSDollarExchangeRateMember |
| Namespace Prefix: |
|
| Data Type: |
na |
| Balance Type: |
|
| Period Type: |
|
|
v3.23.3
SUMMARY OF SIGNIFICANT ACCOUNTING POLICIES (Details Narrative) - USD ($)
|
12 Months Ended |
|
Jul. 31, 2023 |
Jul. 31, 2022 |
Jul. 31, 2021 |
| Accounting Policies [Abstract] |
|
|
|
| Income tax description for likelihood |
tax positions taken or expected to be taken on a tax return. Under ASC 740, tax positions must initially be recognized in the
financial statements when it is more likely than not the position will be sustained upon examination by the tax authorities. Such tax
positions must initially and subsequently be measured as the largest amount of tax benefit that has a greater than 50% likelihood of
being realized upon ultimate settlement with the tax authority assuming full knowledge of the position and relevant facts.
|
|
|
| Revenue |
$ 146,252
|
$ 46,702
|
|
| Accumulated deficit |
2,458,008
|
2,389,181
|
|
| Capital deficiency |
583,975
|
533,364
|
$ 190,907
|
| Net cash provided by used in operating activities |
$ 63,517
|
$ 4,169
|
|
| X |
- References
+ Details
| Name: |
us-gaap_AccountingPoliciesAbstract |
| Namespace Prefix: |
us-gaap_ |
| Data Type: |
xbrli:stringItemType |
| Balance Type: |
na |
| Period Type: |
duration |
|
| X |
- DefinitionAmount of cash inflow (outflow) from operating activities, including discontinued operations. Operating activity cash flows include transactions, adjustments, and changes in value not defined as investing or financing activities. Reference 1: http://fasb.org/us-gaap/role/ref/legacyRef
-Topic 230
-SubTopic 10
-Name Accounting Standards Codification
-Section 45
-Paragraph 28
-Publisher FASB
-URI https://asc.fasb.org//1943274/2147482740/230-10-45-28
Reference 2: http://fasb.org/us-gaap/role/ref/legacyRef
-Topic 230
-SubTopic 10
-Name Accounting Standards Codification
-Section 45
-Paragraph 24
-Publisher FASB
-URI https://asc.fasb.org//1943274/2147482740/230-10-45-24
Reference 3: http://fasb.org/us-gaap/role/ref/legacyRef
-Topic 230
-SubTopic 10
-Name Accounting Standards Codification
-Section 45
-Paragraph 25
-Publisher FASB
-URI https://asc.fasb.org//1943274/2147482740/230-10-45-25
| Name: |
us-gaap_NetCashProvidedByUsedInOperatingActivities |
| Namespace Prefix: |
us-gaap_ |
| Data Type: |
xbrli:monetaryItemType |
| Balance Type: |
na |
| Period Type: |
duration |
|
| X |
- DefinitionAmount of accumulated undistributed earnings (deficit). Reference 1: http://www.xbrl.org/2003/role/exampleRef
-Topic 852
-SubTopic 10
-Name Accounting Standards Codification
-Section 55
-Paragraph 10
-Publisher FASB
-URI https://asc.fasb.org//1943274/2147481372/852-10-55-10
Reference 2: http://www.xbrl.org/2003/role/disclosureRef
-Topic 944
-SubTopic 40
-Name Accounting Standards Codification
-Section 65
-Paragraph 2
-Subparagraph (g)(2)(i)
-Publisher FASB
-URI https://asc.fasb.org//1943274/2147480016/944-40-65-2
Reference 3: http://www.xbrl.org/2003/role/disclosureRef
-Topic 944
-SubTopic 40
-Name Accounting Standards Codification
-Section 65
-Paragraph 2
-Subparagraph (h)(2)
-Publisher FASB
-URI https://asc.fasb.org//1943274/2147480016/944-40-65-2
Reference 4: http://www.xbrl.org/2003/role/disclosureRef
-Topic 946
-SubTopic 20
-Name Accounting Standards Codification
-Section 50
-Paragraph 11
-Publisher FASB
-URI https://asc.fasb.org//1943274/2147480990/946-20-50-11
Reference 5: http://www.xbrl.org/2003/role/disclosureRef
-Topic 944
-SubTopic 210
-Name Accounting Standards Codification
-Section S99
-Paragraph 1
-Subparagraph (SX 210.7-03(a)(23)(a)(4))
-Publisher FASB
-URI https://asc.fasb.org//1943274/2147479440/944-210-S99-1
Reference 6: http://www.xbrl.org/2003/role/disclosureRef
-Topic 946
-SubTopic 210
-Name Accounting Standards Codification
-Section S99
-Paragraph 1
-Subparagraph (SX 210.6-04(17))
-Publisher FASB
-URI https://asc.fasb.org//1943274/2147479617/946-210-S99-1
Reference 7: http://fasb.org/us-gaap/role/ref/legacyRef
-Topic 505
-SubTopic 10
-Name Accounting Standards Codification
-Section S99
-Paragraph 1
-Subparagraph (SX 210.3-04)
-Publisher FASB
-URI https://asc.fasb.org//1943274/2147480008/505-10-S99-1
Reference 8: http://fasb.org/us-gaap/role/ref/legacyRef
-Topic 210
-SubTopic 10
-Name Accounting Standards Codification
-Section S99
-Paragraph 1
-Subparagraph (SX 210.5-02(30)(a)(3))
-Publisher FASB
-URI https://asc.fasb.org//1943274/2147480566/210-10-S99-1
| Name: |
us-gaap_RetainedEarningsAccumulatedDeficit |
| Namespace Prefix: |
us-gaap_ |
| Data Type: |
xbrli:monetaryItemType |
| Balance Type: |
credit |
| Period Type: |
instant |
|
| X |
- DefinitionAmount, excluding tax collected from customer, of revenue from satisfaction of performance obligation by transferring promised good or service to customer. Tax collected from customer is tax assessed by governmental authority that is both imposed on and concurrent with specific revenue-producing transaction, including, but not limited to, sales, use, value added and excise. Reference 1: http://www.xbrl.org/2003/role/disclosureRef
-Topic 924
-SubTopic 10
-Name Accounting Standards Codification
-Section S99
-Paragraph 1
-Subparagraph (SAB Topic 11.L)
-Publisher FASB
-URI https://asc.fasb.org//1943274/2147479941/924-10-S99-1
Reference 2: http://www.xbrl.org/2003/role/disclosureRef
-Topic 606
-SubTopic 10
-Name Accounting Standards Codification
-Section 50
-Paragraph 5
-Publisher FASB
-URI https://asc.fasb.org//1943274/2147479806/606-10-50-5
Reference 3: http://www.xbrl.org/2003/role/disclosureRef
-Topic 280
-SubTopic 10
-Name Accounting Standards Codification
-Section 50
-Paragraph 30
-Subparagraph (a)
-Publisher FASB
-URI https://asc.fasb.org//1943274/2147482810/280-10-50-30
Reference 4: http://www.xbrl.org/2003/role/disclosureRef
-Topic 280
-SubTopic 10
-Name Accounting Standards Codification
-Section 50
-Paragraph 42
-Publisher FASB
-URI https://asc.fasb.org//1943274/2147482810/280-10-50-42
Reference 5: http://www.xbrl.org/2003/role/disclosureRef
-Topic 280
-SubTopic 10
-Name Accounting Standards Codification
-Section 50
-Paragraph 22
-Subparagraph (b)
-Publisher FASB
-URI https://asc.fasb.org//1943274/2147482810/280-10-50-22
Reference 6: http://www.xbrl.org/2003/role/disclosureRef
-Topic 280
-SubTopic 10
-Name Accounting Standards Codification
-Section 50
-Paragraph 32
-Subparagraph (b)
-Publisher FASB
-URI https://asc.fasb.org//1943274/2147482810/280-10-50-32
Reference 7: http://www.xbrl.org/2003/role/disclosureRef
-Topic 280
-SubTopic 10
-Name Accounting Standards Codification
-Section 50
-Paragraph 40
-Publisher FASB
-URI https://asc.fasb.org//1943274/2147482810/280-10-50-40
Reference 8: http://www.xbrl.org/2003/role/disclosureRef
-Topic 280
-SubTopic 10
-Name Accounting Standards Codification
-Section 50
-Paragraph 22
-Subparagraph (a)
-Publisher FASB
-URI https://asc.fasb.org//1943274/2147482810/280-10-50-22
Reference 9: http://www.xbrl.org/2003/role/disclosureRef
-Topic 280
-SubTopic 10
-Name Accounting Standards Codification
-Section 50
-Paragraph 32
-Subparagraph (a)
-Publisher FASB
-URI https://asc.fasb.org//1943274/2147482810/280-10-50-32
Reference 10: http://www.xbrl.org/2003/role/disclosureRef
-Topic 280
-SubTopic 10
-Name Accounting Standards Codification
-Section 50
-Paragraph 41
-Subparagraph (a)
-Publisher FASB
-URI https://asc.fasb.org//1943274/2147482810/280-10-50-41
Reference 11: http://www.xbrl.org/2003/role/disclosureRef
-Topic 606
-SubTopic 10
-Name Accounting Standards Codification
-Section 50
-Paragraph 4
-Subparagraph (a)
-Publisher FASB
-URI https://asc.fasb.org//1943274/2147479806/606-10-50-4
| Name: |
us-gaap_RevenueFromContractWithCustomerExcludingAssessedTax |
| Namespace Prefix: |
us-gaap_ |
| Data Type: |
xbrli:monetaryItemType |
| Balance Type: |
credit |
| Period Type: |
duration |
|
| X |
- DefinitionAmount of equity (deficit) attributable to parent. Excludes temporary equity and equity attributable to noncontrolling interest. Reference 1: http://www.xbrl.org/2003/role/exampleRef
-Topic 852
-SubTopic 10
-Name Accounting Standards Codification
-Section 55
-Paragraph 10
-Publisher FASB
-URI https://asc.fasb.org//1943274/2147481372/852-10-55-10
Reference 2: http://www.xbrl.org/2003/role/exampleRef
-Topic 946
-SubTopic 830
-Name Accounting Standards Codification
-Section 55
-Paragraph 12
-Publisher FASB
-URI https://asc.fasb.org//1943274/2147480167/946-830-55-12
Reference 3: http://www.xbrl.org/2003/role/disclosureRef
-Topic 946
-SubTopic 210
-Name Accounting Standards Codification
-Section S99
-Paragraph 1
-Subparagraph (SX 210.6-04(19))
-Publisher FASB
-URI https://asc.fasb.org//1943274/2147479617/946-210-S99-1
Reference 4: http://www.xbrl.org/2003/role/disclosureRef
-Topic 946
-SubTopic 210
-Name Accounting Standards Codification
-Section S99
-Paragraph 2
-Subparagraph (SX 210.6-05(4))
-Publisher FASB
-URI https://asc.fasb.org//1943274/2147479617/946-210-S99-2
Reference 5: http://www.xbrl.org/2009/role/commonPracticeRef
-Topic 946
-SubTopic 220
-Name Accounting Standards Codification
-Section S99
-Paragraph 3
-Subparagraph (SX 210.6-09(4)(b))
-Publisher FASB
-URI https://asc.fasb.org//1943274/2147483575/946-220-S99-3
Reference 6: http://www.xbrl.org/2003/role/disclosureRef
-Topic 946
-SubTopic 220
-Name Accounting Standards Codification
-Section S99
-Paragraph 3
-Subparagraph (SX 210.6-09(6))
-Publisher FASB
-URI https://asc.fasb.org//1943274/2147483575/946-220-S99-3
Reference 7: http://www.xbrl.org/2003/role/disclosureRef
-Topic 946
-SubTopic 220
-Name Accounting Standards Codification
-Section S99
-Paragraph 3
-Subparagraph (SX 210.6-09(7))
-Publisher FASB
-URI https://asc.fasb.org//1943274/2147483575/946-220-S99-3
Reference 8: http://www.xbrl.org/2009/role/commonPracticeRef
-Topic 235
-SubTopic 10
-Name Accounting Standards Codification
-Section S99
-Paragraph 1
-Subparagraph (SX 210.4-08(g)(1)(ii))
-Publisher FASB
-URI https://asc.fasb.org//1943274/2147480678/235-10-S99-1
Reference 9: http://www.xbrl.org/2009/role/commonPracticeRef
-Topic 323
-SubTopic 10
-Name Accounting Standards Codification
-Section 50
-Paragraph 3
-Subparagraph (c)
-Publisher FASB
-URI https://asc.fasb.org//1943274/2147481687/323-10-50-3
Reference 10: http://www.xbrl.org/2009/role/commonPracticeRef
-Topic 825
-SubTopic 10
-Name Accounting Standards Codification
-Section 50
-Paragraph 28
-Subparagraph (f)
-Publisher FASB
-URI https://asc.fasb.org//1943274/2147482907/825-10-50-28
Reference 11: http://fasb.org/us-gaap/role/ref/legacyRef
-Topic 210
-SubTopic 10
-Name Accounting Standards Codification
-Section S99
-Paragraph 1
-Subparagraph (SX 210.5-02(29))
-Publisher FASB
-URI https://asc.fasb.org//1943274/2147480566/210-10-S99-1
Reference 12: http://fasb.org/us-gaap/role/ref/legacyRef
-Topic 210
-SubTopic 10
-Name Accounting Standards Codification
-Section S99
-Paragraph 1
-Subparagraph (SX 210.5-02(31))
-Publisher FASB
-URI https://asc.fasb.org//1943274/2147480566/210-10-S99-1
Reference 13: http://fasb.org/us-gaap/role/ref/legacyRef
-Topic 210
-SubTopic 10
-Name Accounting Standards Codification
-Section S99
-Paragraph 1
-Subparagraph (SX 210.5-02(30))
-Publisher FASB
-URI https://asc.fasb.org//1943274/2147480566/210-10-S99-1
Reference 14: http://fasb.org/us-gaap/role/ref/legacyRef
-Topic 310
-SubTopic 10
-Name Accounting Standards Codification
-Section S99
-Paragraph 2
-Subparagraph (SAB Topic 4.E)
-Publisher FASB
-URI https://asc.fasb.org//1943274/2147480418/310-10-S99-2
| Name: |
us-gaap_StockholdersEquity |
| Namespace Prefix: |
us-gaap_ |
| Data Type: |
xbrli:monetaryItemType |
| Balance Type: |
credit |
| Period Type: |
instant |
|
v3.23.3
COMMON STOCK (Details Narrative) - USD ($)
|
|
|
|
|
|
|
|
|
|
|
3 Months Ended |
4 Months Ended |
12 Months Ended |
May 07, 2019 |
Jul. 31, 2018 |
Jul. 26, 2018 |
Jul. 25, 2018 |
Jul. 11, 2018 |
Jul. 10, 2018 |
Jul. 09, 2018 |
Jul. 07, 2018 |
Jul. 06, 2018 |
Jun. 04, 2018 |
Jul. 31, 2019 |
Dec. 13, 2018 |
Jul. 31, 2023 |
Jul. 31, 2022 |
Jul. 31, 2021 |
| Subsidiary, Sale of Stock [Line Items] |
|
|
|
|
|
|
|
|
|
|
|
|
|
|
|
| Common stock, shares issued |
|
|
|
|
|
|
|
|
|
|
|
|
59,434,838
|
59,434,838
|
|
| Server Intl Co Ltd [Member] |
|
|
|
|
|
|
|
|
|
|
|
|
|
|
|
| Subsidiary, Sale of Stock [Line Items] |
|
|
|
|
|
|
|
|
|
|
|
|
|
|
|
| Number of restricted common stock issued |
|
|
|
|
|
|
|
|
11,000,000
|
|
|
|
|
|
|
| GreenPro Asia Strategic SPC [Member] |
|
|
|
|
|
|
|
|
|
|
|
|
|
|
|
| Subsidiary, Sale of Stock [Line Items] |
|
|
|
|
|
|
|
|
|
|
|
|
|
|
|
| Number of restricted common stock issued |
|
|
|
|
|
|
2,835,000
|
|
|
|
|
|
|
|
|
| GreenPro Venture Capital Limited [Member] |
|
|
|
|
|
|
|
|
|
|
|
|
|
|
|
| Subsidiary, Sale of Stock [Line Items] |
|
|
|
|
|
|
|
|
|
|
|
|
|
|
|
| Number of restricted common stock issued |
|
|
|
|
|
|
2,165,000
|
|
|
|
|
|
|
|
|
| Share issued price per shares |
|
|
|
|
|
|
$ 0.0001
|
|
|
|
|
|
|
|
|
| Consideration amount |
|
|
|
|
|
|
$ 500
|
|
|
|
|
|
|
|
|
| Dezign Format Pte Ltd and Cheng Young-Chien [Member] |
|
|
|
|
|
|
|
|
|
|
|
|
|
|
|
| Subsidiary, Sale of Stock [Line Items] |
|
|
|
|
|
|
|
|
|
|
|
|
|
|
|
| Number of restricted common stock issued |
|
2,000,000
|
|
|
|
|
|
|
|
|
|
|
|
|
|
| Share issued price per shares |
|
$ 0.20
|
|
|
|
|
|
|
|
|
|
|
|
|
|
| Consideration amount |
|
$ 800,000
|
|
|
|
|
|
|
|
|
|
|
|
|
|
| Ms Niu Yen Yen [Member] |
|
|
|
|
|
|
|
|
|
|
|
|
|
|
|
| Subsidiary, Sale of Stock [Line Items] |
|
|
|
|
|
|
|
|
|
|
|
|
|
|
|
| Number of restricted common stock issued |
|
|
|
|
|
|
|
|
25,000,000
|
100,000
|
|
|
|
|
|
| Share issued price per shares |
|
|
|
|
|
|
|
|
$ 0.0001
|
$ 0.0001
|
|
|
|
|
|
| Consideration amount |
|
|
|
|
|
|
|
|
|
$ 10
|
|
|
|
|
|
| Ms Niu Yen Yen [Member] | Server Intl Co Ltd [Member] |
|
|
|
|
|
|
|
|
|
|
|
|
|
|
|
| Subsidiary, Sale of Stock [Line Items] |
|
|
|
|
|
|
|
|
|
|
|
|
|
|
|
| Consideration amount |
|
|
|
|
|
|
|
|
$ 3,600
|
|
|
|
|
|
|
| Chang Chun Ying [Member] |
|
|
|
|
|
|
|
|
|
|
|
|
|
|
|
| Subsidiary, Sale of Stock [Line Items] |
|
|
|
|
|
|
|
|
|
|
|
|
|
|
|
| Number of restricted common stock issued |
|
|
|
|
|
|
|
4,300,000
|
|
|
|
|
|
|
|
| Chang Su-Fen [Member] |
|
|
|
|
|
|
|
|
|
|
|
|
|
|
|
| Subsidiary, Sale of Stock [Line Items] |
|
|
|
|
|
|
|
|
|
|
|
|
|
|
|
| Number of restricted common stock issued |
|
|
|
|
|
|
|
5,000,000
|
|
|
|
|
|
|
|
| Share issued price per shares |
|
|
|
|
|
|
|
$ 0.0001
|
|
|
|
|
|
|
|
| Chang Chun Ying and Chang Su Fen [Member] |
|
|
|
|
|
|
|
|
|
|
|
|
|
|
|
| Subsidiary, Sale of Stock [Line Items] |
|
|
|
|
|
|
|
|
|
|
|
|
|
|
|
| Consideration amount |
|
|
|
|
|
|
|
$ 930
|
|
|
|
|
|
|
|
| Three Non U S Residents [Member] |
|
|
|
|
|
|
|
|
|
|
|
|
|
|
|
| Subsidiary, Sale of Stock [Line Items] |
|
|
|
|
|
|
|
|
|
|
|
|
|
|
|
| Number of restricted common stock issued |
|
|
|
|
|
2,150,000
|
|
|
|
|
|
|
|
|
|
| Share issued price per shares |
|
|
|
|
|
$ 0.0001
|
|
|
|
|
|
|
|
|
|
| Consideration amount |
|
|
|
|
|
$ 215
|
|
|
|
|
|
|
|
|
|
| Number of shares transferred |
|
|
|
|
|
|
|
|
|
|
|
|
|
|
395,000
|
| Sale of stock transaction |
|
|
|
|
|
|
|
|
|
|
|
|
610,000
|
6,800,000
|
|
| Eight Non US Residents [Member] |
|
|
|
|
|
|
|
|
|
|
|
|
|
|
|
| Subsidiary, Sale of Stock [Line Items] |
|
|
|
|
|
|
|
|
|
|
|
|
|
|
|
| Number of shares transferred |
|
|
|
|
|
1,500,000
|
|
|
|
|
|
|
|
|
|
| Two Non US Residents [Member] |
|
|
|
|
|
|
|
|
|
|
|
|
|
|
|
| Subsidiary, Sale of Stock [Line Items] |
|
|
|
|
|
|
|
|
|
|
|
|
|
|
|
| Number of restricted common stock issued |
|
|
|
|
710,000
|
|
|
|
|
|
|
|
|
|
|
| Share issued price per shares |
|
|
|
|
$ 0.03
|
|
|
|
|
|
|
|
|
|
|
| Consideration amount |
|
|
|
|
$ 21,300
|
|
|
|
|
|
|
|
|
|
|
| Number of shares transferred |
|
|
|
|
|
|
|
|
|
|
|
|
|
55,522
|
|
| Ten Non US Residents [Member] |
|
|
|
|
|
|
|
|
|
|
|
|
|
|
|
| Subsidiary, Sale of Stock [Line Items] |
|
|
|
|
|
|
|
|
|
|
|
|
|
|
|
| Number of restricted common stock issued |
|
|
|
995,000
|
|
|
|
|
|
|
|
|
|
|
|
| Share issued price per shares |
|
|
|
$ 0.03
|
|
|
|
|
|
|
|
|
|
|
|
| Consideration amount |
|
|
|
$ 29,850
|
|
|
|
|
|
|
|
|
|
|
|
| One Non U S Residents [Member] |
|
|
|
|
|
|
|
|
|
|
|
|
|
|
|
| Subsidiary, Sale of Stock [Line Items] |
|
|
|
|
|
|
|
|
|
|
|
|
|
|
|
| Number of restricted common stock issued |
|
|
250,000
|
|
|
|
|
|
|
|
|
|
|
|
|
| Share issued price per shares |
|
|
$ 0.20
|
|
|
|
|
|
|
|
|
|
|
|
|
| Consideration amount |
|
|
$ 50,000
|
|
|
|
|
|
|
|
|
|
|
|
|
| Sixteen Non US Residents [Member] |
|
|
|
|
|
|
|
|
|
|
|
|
|
|
|
| Subsidiary, Sale of Stock [Line Items] |
|
|
|
|
|
|
|
|
|
|
|
|
|
|
|
| Number of shares transferred |
|
|
|
|
|
|
|
|
|
|
|
1,557,800
|
|
|
|
| Fourty Five Accredited Investors [Member] |
|
|
|
|
|
|
|
|
|
|
|
|
|
|
|
| Subsidiary, Sale of Stock [Line Items] |
|
|
|
|
|
|
|
|
|
|
|
|
|
|
|
| Convertible promissory note issued on conversion |
$ 779,125
|
|
|
|
|
|
|
|
|
|
|
|
|
|
|
| Conversion price per share |
$ 1
|
|
|
|
|
|
|
|
|
|
|
|
|
|
|
| Convertible promissory note issued on conversion, shares |
779,125
|
|
|
|
|
|
|
|
|
|
|
|
|
|
|
| Thirty Six Non US Residents [Member] | IPO [Member] |
|
|
|
|
|
|
|
|
|
|
|
|
|
|
|
| Subsidiary, Sale of Stock [Line Items] |
|
|
|
|
|
|
|
|
|
|
|
|
|
|
|
| Share issued price per shares |
|
|
|
|
|
|
|
|
|
|
$ 1.00
|
|
|
|
|
| Number of common stock issued |
|
|
|
|
|
|
|
|
|
|
150,317
|
|
|
|
|
| Twenty Non-US Residents [Member] |
|
|
|
|
|
|
|
|
|
|
|
|
|
|
|
| Subsidiary, Sale of Stock [Line Items] |
|
|
|
|
|
|
|
|
|
|
|
|
|
|
|
| Sale of stock transaction |
|
|
|
|
|
|
|
|
|
|
|
|
|
|
3,364,921
|
| X |
- DefinitionNumber of shares transferred.
| Name: |
MUGH_NumberOfSharesTransferred |
| Namespace Prefix: |
MUGH_ |
| Data Type: |
xbrli:sharesItemType |
| Balance Type: |
na |
| Period Type: |
duration |
|
| X |
- DefinitionTotal number of common shares of an entity that have been sold or granted to shareholders (includes common shares that were issued, repurchased and remain in the treasury). These shares represent capital invested by the firm's shareholders and owners, and may be all or only a portion of the number of shares authorized. Shares issued include shares outstanding and shares held in the treasury. Reference 1: http://fasb.org/us-gaap/role/ref/legacyRef
-Topic 210
-SubTopic 10
-Name Accounting Standards Codification
-Section S99
-Paragraph 1
-Subparagraph (SX 210.5-02(29))
-Publisher FASB
-URI https://asc.fasb.org//1943274/2147480566/210-10-S99-1
| Name: |
us-gaap_CommonStockSharesIssued |
| Namespace Prefix: |
us-gaap_ |
| Data Type: |
xbrli:sharesItemType |
| Balance Type: |
na |
| Period Type: |
instant |
|
| X |
- DefinitionThe value of the financial instrument(s) that the original debt is being converted into in a noncash (or part noncash) transaction. "Part noncash" refers to that portion of the transaction not resulting in cash receipts or cash payments in the period. Reference 1: http://fasb.org/us-gaap/role/ref/legacyRef
-Name Accounting Standards Codification
-Topic 230
-SubTopic 10
-Section 50
-Paragraph 3
-Publisher FASB
-URI https://asc.fasb.org//1943274/2147482913/230-10-50-3
Reference 2: http://fasb.org/us-gaap/role/ref/legacyRef
-Name Accounting Standards Codification
-Topic 230
-SubTopic 10
-Section 50
-Paragraph 5
-Publisher FASB
-URI https://asc.fasb.org//1943274/2147482913/230-10-50-5
| Name: |
us-gaap_DebtConversionConvertedInstrumentAmount1 |
| Namespace Prefix: |
us-gaap_ |
| Data Type: |
xbrli:monetaryItemType |
| Balance Type: |
credit |
| Period Type: |
duration |
|
| X |
- DefinitionThe number of shares issued in exchange for the original debt being converted in a noncash (or part noncash) transaction. "Part noncash" refers to that portion of the transaction not resulting in cash receipts or payments in the period. Reference 1: http://fasb.org/us-gaap/role/ref/legacyRef
-Name Accounting Standards Codification
-Topic 230
-SubTopic 10
-Section 50
-Paragraph 3
-Publisher FASB
-URI https://asc.fasb.org//1943274/2147482913/230-10-50-3
Reference 2: http://fasb.org/us-gaap/role/ref/legacyRef
-Name Accounting Standards Codification
-Topic 230
-SubTopic 10
-Section 50
-Paragraph 5
-Publisher FASB
-URI https://asc.fasb.org//1943274/2147482913/230-10-50-5
| Name: |
us-gaap_DebtConversionConvertedInstrumentSharesIssued1 |
| Namespace Prefix: |
us-gaap_ |
| Data Type: |
xbrli:sharesItemType |
| Balance Type: |
na |
| Period Type: |
duration |
|
| X |
- DefinitionThe price per share of the conversion feature embedded in the debt instrument. Reference 1: http://www.xbrl.org/2003/role/disclosureRef
-Topic 470
-SubTopic 20
-Name Accounting Standards Codification
-Section 50
-Paragraph 1B
-Subparagraph (c)
-Publisher FASB
-URI https://asc.fasb.org//1943274/2147481139/470-20-50-1B
Reference 2: http://fasb.org/us-gaap/role/ref/legacyRef
-Topic 470
-SubTopic 20
-Name Accounting Standards Codification
-Section 50
-Paragraph 5
-Subparagraph (b)
-Publisher FASB
-URI https://asc.fasb.org//1943274/2147481139/470-20-50-5
| Name: |
us-gaap_DebtInstrumentConvertibleConversionPrice1 |
| Namespace Prefix: |
us-gaap_ |
| Data Type: |
dtr-types:perShareItemType |
| Balance Type: |
na |
| Period Type: |
instant |
|
| X |
- DefinitionThe number of shares issued or sold by the subsidiary or equity method investee per stock transaction.
| Name: |
us-gaap_SaleOfStockNumberOfSharesIssuedInTransaction |
| Namespace Prefix: |
us-gaap_ |
| Data Type: |
xbrli:sharesItemType |
| Balance Type: |
na |
| Period Type: |
duration |
|
| X |
- DefinitionPer share or per unit amount of equity securities issued.
| Name: |
us-gaap_SharesIssuedPricePerShare |
| Namespace Prefix: |
us-gaap_ |
| Data Type: |
dtr-types:perShareItemType |
| Balance Type: |
na |
| Period Type: |
instant |
|
| X |
- DefinitionNumber of new stock issued during the period. Reference 1: http://fasb.org/us-gaap/role/ref/legacyRef
-Name Accounting Standards Codification
-Section 50
-Paragraph 2
-SubTopic 10
-Topic 505
-Publisher FASB
-URI https://asc.fasb.org//1943274/2147481112/505-10-50-2
Reference 2: http://www.xbrl.org/2003/role/disclosureRef
-Topic 946
-SubTopic 505
-Name Accounting Standards Codification
-Section 50
-Paragraph 2
-Subparagraph (a)
-Publisher FASB
-URI https://asc.fasb.org//1943274/2147481004/946-505-50-2
Reference 3: http://www.xbrl.org/2003/role/disclosureRef
-Topic 946
-SubTopic 220
-Name Accounting Standards Codification
-Section S99
-Paragraph 3
-Subparagraph (SX 210.6-09(4)(b))
-Publisher FASB
-URI https://asc.fasb.org//1943274/2147483575/946-220-S99-3
Reference 4: http://www.xbrl.org/2003/role/disclosureRef
-Topic 946
-SubTopic 10
-Name Accounting Standards Codification
-Section S99
-Paragraph 3
-Subparagraph (SX 210.6-03(i)(1))
-Publisher FASB
-URI https://asc.fasb.org//1943274/2147479886/946-10-S99-3
Reference 5: http://fasb.org/us-gaap/role/ref/legacyRef
-Topic 210
-SubTopic 10
-Name Accounting Standards Codification
-Section S99
-Paragraph 1
-Subparagraph (SX 210.5-02(28))
-Publisher FASB
-URI https://asc.fasb.org//1943274/2147480566/210-10-S99-1
Reference 6: http://fasb.org/us-gaap/role/ref/legacyRef
-Topic 505
-SubTopic 10
-Name Accounting Standards Codification
-Section S99
-Paragraph 1
-Subparagraph (SX 210.3-04)
-Publisher FASB
-URI https://asc.fasb.org//1943274/2147480008/505-10-S99-1
Reference 7: http://fasb.org/us-gaap/role/ref/legacyRef
-Topic 210
-SubTopic 10
-Name Accounting Standards Codification
-Section S99
-Paragraph 1
-Subparagraph (SX 210.5-02(29))
-Publisher FASB
-URI https://asc.fasb.org//1943274/2147480566/210-10-S99-1
| Name: |
us-gaap_StockIssuedDuringPeriodSharesNewIssues |
| Namespace Prefix: |
us-gaap_ |
| Data Type: |
xbrli:sharesItemType |
| Balance Type: |
na |
| Period Type: |
duration |
|
| X |
- DefinitionTotal number of shares issued during the period, including shares forfeited, as a result of Restricted Stock Awards. Reference 1: http://fasb.org/us-gaap/role/ref/legacyRef
-Name Accounting Standards Codification
-Section 50
-Paragraph 2
-SubTopic 10
-Topic 505
-Publisher FASB
-URI https://asc.fasb.org//1943274/2147481112/505-10-50-2
Reference 2: http://fasb.org/us-gaap/role/ref/legacyRef
-Topic 505
-SubTopic 10
-Name Accounting Standards Codification
-Section S99
-Paragraph 1
-Subparagraph (SX 210.3-04)
-Publisher FASB
-URI https://asc.fasb.org//1943274/2147480008/505-10-S99-1
| Name: |
us-gaap_StockIssuedDuringPeriodSharesRestrictedStockAwardGross |
| Namespace Prefix: |
us-gaap_ |
| Data Type: |
xbrli:sharesItemType |
| Balance Type: |
na |
| Period Type: |
duration |
|
| X |
- DefinitionAggregate value of stock related to Restricted Stock Awards issued during the period. Reference 1: http://fasb.org/us-gaap/role/ref/legacyRef
-Name Accounting Standards Codification
-Section 50
-Paragraph 2
-SubTopic 10
-Topic 505
-Publisher FASB
-URI https://asc.fasb.org//1943274/2147481112/505-10-50-2
Reference 2: http://fasb.org/us-gaap/role/ref/legacyRef
-Topic 210
-SubTopic 10
-Name Accounting Standards Codification
-Section S99
-Paragraph 1
-Subparagraph (SX 210.5-02(28))
-Publisher FASB
-URI https://asc.fasb.org//1943274/2147480566/210-10-S99-1
Reference 3: http://fasb.org/us-gaap/role/ref/legacyRef
-Topic 505
-SubTopic 10
-Name Accounting Standards Codification
-Section S99
-Paragraph 1
-Subparagraph (SX 210.3-04)
-Publisher FASB
-URI https://asc.fasb.org//1943274/2147480008/505-10-S99-1
Reference 4: http://fasb.org/us-gaap/role/ref/legacyRef
-Topic 210
-SubTopic 10
-Name Accounting Standards Codification
-Section S99
-Paragraph 1
-Subparagraph (SX 210.5-02(29))
-Publisher FASB
-URI https://asc.fasb.org//1943274/2147480566/210-10-S99-1
| Name: |
us-gaap_StockIssuedDuringPeriodValueRestrictedStockAwardGross |
| Namespace Prefix: |
us-gaap_ |
| Data Type: |
xbrli:monetaryItemType |
| Balance Type: |
credit |
| Period Type: |
duration |
|
| X |
- DefinitionLine items represent financial concepts included in a table. These concepts are used to disclose reportable information associated with domain members defined in one or many axes to the table.
| Name: |
us-gaap_SubsidiarySaleOfStockLineItems |
| Namespace Prefix: |
us-gaap_ |
| Data Type: |
xbrli:stringItemType |
| Balance Type: |
na |
| Period Type: |
duration |
|
| X |
- Details
| Name: |
dei_LegalEntityAxis=MUGH_ServerIntlCoLtdMember |
| Namespace Prefix: |
|
| Data Type: |
na |
| Balance Type: |
|
| Period Type: |
|
|
| X |
- Details
| Name: |
dei_LegalEntityAxis=MUGH_GreenProAsiaStrategicSPCMember |
| Namespace Prefix: |
|
| Data Type: |
na |
| Balance Type: |
|
| Period Type: |
|
|
| X |
- Details
| Name: |
dei_LegalEntityAxis=MUGH_GreenProVentureCapitalLimitedMember |
| Namespace Prefix: |
|
| Data Type: |
na |
| Balance Type: |
|
| Period Type: |
|
|
| X |
- Details
| Name: |
srt_TitleOfIndividualAxis=MUGH_MsNiuYenYenMember |
| Namespace Prefix: |
|
| Data Type: |
na |
| Balance Type: |
|
| Period Type: |
|
|
| X |
- Details
| Name: |
srt_TitleOfIndividualAxis=MUGH_ChangChunYingMember |
| Namespace Prefix: |
|
| Data Type: |
na |
| Balance Type: |
|
| Period Type: |
|
|
| X |
- Details
| Name: |
srt_TitleOfIndividualAxis=MUGH_ChangSuFenMember |
| Namespace Prefix: |
|
| Data Type: |
na |
| Balance Type: |
|
| Period Type: |
|
|
| X |
- Details
| Name: |
srt_TitleOfIndividualAxis=MUGH_ChangChunYingAndChangSuFenMember |
| Namespace Prefix: |
|
| Data Type: |
na |
| Balance Type: |
|
| Period Type: |
|
|
| X |
- Details
| Name: |
srt_TitleOfIndividualAxis=MUGH_ThreeNonUSResidentsMember |
| Namespace Prefix: |
|
| Data Type: |
na |
| Balance Type: |
|
| Period Type: |
|
|
| X |
- Details
| Name: |
srt_TitleOfIndividualAxis=MUGH_EightNonUSResidentsMember |
| Namespace Prefix: |
|
| Data Type: |
na |
| Balance Type: |
|
| Period Type: |
|
|
| X |
- Details
| Name: |
srt_TitleOfIndividualAxis=MUGH_TwoNonUSResidentsMember |
| Namespace Prefix: |
|
| Data Type: |
na |
| Balance Type: |
|
| Period Type: |
|
|
| X |
- Details
| Name: |
srt_TitleOfIndividualAxis=MUGH_TenNonUSResidentsMember |
| Namespace Prefix: |
|
| Data Type: |
na |
| Balance Type: |
|
| Period Type: |
|
|
| X |
- Details
| Name: |
srt_TitleOfIndividualAxis=MUGH_OneNonUSResidentsMember |
| Namespace Prefix: |
|
| Data Type: |
na |
| Balance Type: |
|
| Period Type: |
|
|
| X |
- Details
| Name: |
srt_TitleOfIndividualAxis=MUGH_SixteenNonUSResidentsMember |
| Namespace Prefix: |
|
| Data Type: |
na |
| Balance Type: |
|
| Period Type: |
|
|
| X |
- Details
| Name: |
srt_TitleOfIndividualAxis=MUGH_FourtyFiveAccreditedInvestorsMember |
| Namespace Prefix: |
|
| Data Type: |
na |
| Balance Type: |
|
| Period Type: |
|
|
| X |
- Details
| Name: |
srt_TitleOfIndividualAxis=MUGH_ThirtySixNonUSResidentsMember |
| Namespace Prefix: |
|
| Data Type: |
na |
| Balance Type: |
|
| Period Type: |
|
|
| X |
- Details
| Name: |
us-gaap_SubsidiarySaleOfStockAxis=us-gaap_IPOMember |
| Namespace Prefix: |
|
| Data Type: |
na |
| Balance Type: |
|
| Period Type: |
|
|
| X |
- Details
| Name: |
srt_TitleOfIndividualAxis=MUGH_TwentyNonUSResidentsMember |
| Namespace Prefix: |
|
| Data Type: |
na |
| Balance Type: |
|
| Period Type: |
|
|
v3.23.3
SCHEDULE OF PROPERTY, PLANT AND EQUIPMENT (Details) - USD ($)
|
Jul. 31, 2023 |
Jul. 31, 2022 |
| Property, Plant and Equipment [Line Items] |
|
|
|
| Total |
|
$ 520,424
|
$ 533,451
|
| Accumulated depreciation |
[1] |
(395,140)
|
(401,797)
|
| Impairment |
|
(143,182)
|
(149,552)
|
| Foreign currency translation adjustment |
|
17,898
|
17,898
|
| Property, plant and equipment, net |
|
|
|
| Computer Equipment [Member] |
|
|
|
| Property, Plant and Equipment [Line Items] |
|
|
|
| Total |
|
129,301
|
129,301
|
| Office Equipment [Member] |
|
|
|
| Property, Plant and Equipment [Line Items] |
|
|
|
| Total |
|
120,569
|
120,569
|
| Leasable Equipment [Member] |
|
|
|
| Property, Plant and Equipment [Line Items] |
|
|
|
| Total |
[2] |
216,378
|
229,405
|
| Outlet Design Fee and Equipment [Member] |
|
|
|
| Property, Plant and Equipment [Line Items] |
|
|
|
| Total |
|
16,763
|
16,763
|
| Application Development Fee [Member] |
|
|
|
| Property, Plant and Equipment [Line Items] |
|
|
|
| Total |
|
$ 37,413
|
$ 37,413
|
|
|
| X |
- DefinitionForeign currency translation adjustments.
| Name: |
MUGH_ForeignCurrencyTranslationAdjustments |
| Namespace Prefix: |
MUGH_ |
| Data Type: |
xbrli:monetaryItemType |
| Balance Type: |
credit |
| Period Type: |
instant |
|
| X |
- DefinitionAmount of accumulated depreciation, depletion and amortization for physical assets used in the normal conduct of business to produce goods and services. Reference 1: http://www.xbrl.org/2003/role/disclosureRef
-Topic 944
-SubTopic 210
-Name Accounting Standards Codification
-Section S99
-Paragraph 1
-Subparagraph (SX 210.7-03(a)(8)(b))
-Publisher FASB
-URI https://asc.fasb.org//1943274/2147479440/944-210-S99-1
Reference 2: http://www.xbrl.org/2003/role/disclosureRef
-Topic 210
-SubTopic 10
-Name Accounting Standards Codification
-Section S99
-Paragraph 1
-Subparagraph (SX 210.5-02(14))
-Publisher FASB
-URI https://asc.fasb.org//1943274/2147480566/210-10-S99-1
Reference 3: http://fasb.org/us-gaap/role/ref/legacyRef
-Name Accounting Standards Codification
-Topic 360
-SubTopic 10
-Section 50
-Paragraph 1
-Subparagraph (c)
-Publisher FASB
-URI https://asc.fasb.org//1943274/2147482099/360-10-50-1
| Name: |
us-gaap_AccumulatedDepreciationDepletionAndAmortizationPropertyPlantAndEquipment |
| Namespace Prefix: |
us-gaap_ |
| Data Type: |
xbrli:monetaryItemType |
| Balance Type: |
credit |
| Period Type: |
instant |
|
| X |
- DefinitionAmount before accumulated depreciation, depletion and amortization of physical assets used in the normal conduct of business and not intended for resale. Examples include, but are not limited to, land, buildings, machinery and equipment, office equipment, and furniture and fixtures. Reference 1: http://www.xbrl.org/2003/role/disclosureRef
-Topic 944
-SubTopic 210
-Name Accounting Standards Codification
-Section S99
-Paragraph 1
-Subparagraph (SX 210.7-03(a)(8))
-Publisher FASB
-URI https://asc.fasb.org//1943274/2147479440/944-210-S99-1
Reference 2: http://www.xbrl.org/2003/role/disclosureRef
-Topic 210
-SubTopic 10
-Name Accounting Standards Codification
-Section S99
-Paragraph 1
-Subparagraph (SX 210.5-02(13))
-Publisher FASB
-URI https://asc.fasb.org//1943274/2147480566/210-10-S99-1
Reference 3: http://fasb.org/us-gaap/role/ref/legacyRef
-Topic 360
-SubTopic 10
-Name Accounting Standards Codification
-Section 50
-Paragraph 1
-Subparagraph (b)
-Publisher FASB
-URI https://asc.fasb.org//1943274/2147482099/360-10-50-1
| Name: |
us-gaap_PropertyPlantAndEquipmentGross |
| Namespace Prefix: |
us-gaap_ |
| Data Type: |
xbrli:monetaryItemType |
| Balance Type: |
debit |
| Period Type: |
instant |
|
| X |
- DefinitionLine items represent financial concepts included in a table. These concepts are used to disclose reportable information associated with domain members defined in one or many axes to the table.
| Name: |
us-gaap_PropertyPlantAndEquipmentLineItems |
| Namespace Prefix: |
us-gaap_ |
| Data Type: |
xbrli:stringItemType |
| Balance Type: |
na |
| Period Type: |
duration |
|
| X |
- DefinitionAmount after accumulated depreciation, depletion and amortization of physical assets used in the normal conduct of business to produce goods and services and not intended for resale. Examples include, but are not limited to, land, buildings, machinery and equipment, office equipment, and furniture and fixtures. Reference 1: http://fasb.org/us-gaap/role/ref/legacyRef
-Name Accounting Standards Codification
-Section 50
-Paragraph 1
-SubTopic 10
-Topic 360
-Publisher FASB
-URI https://asc.fasb.org//1943274/2147482099/360-10-50-1
Reference 2: http://www.xbrl.org/2003/role/exampleRef
-Topic 852
-SubTopic 10
-Name Accounting Standards Codification
-Section 55
-Paragraph 10
-Publisher FASB
-URI https://asc.fasb.org//1943274/2147481372/852-10-55-10
Reference 3: http://www.xbrl.org/2003/role/disclosureRef
-Topic 944
-SubTopic 210
-Name Accounting Standards Codification
-Section S99
-Paragraph 1
-Subparagraph (SX 210.7-03(a)(8))
-Publisher FASB
-URI https://asc.fasb.org//1943274/2147479440/944-210-S99-1
Reference 4: http://www.xbrl.org/2003/role/disclosureRef
-Topic 942
-SubTopic 360
-Name Accounting Standards Codification
-Section 50
-Paragraph 1
-Publisher FASB
-URI https://asc.fasb.org//1943274/2147480842/942-360-50-1
| Name: |
us-gaap_PropertyPlantAndEquipmentNet |
| Namespace Prefix: |
us-gaap_ |
| Data Type: |
xbrli:monetaryItemType |
| Balance Type: |
debit |
| Period Type: |
instant |
|
| X |
- Details
| Name: |
us-gaap_PropertyPlantAndEquipmentByTypeAxis=us-gaap_ComputerEquipmentMember |
| Namespace Prefix: |
|
| Data Type: |
na |
| Balance Type: |
|
| Period Type: |
|
|
| X |
- Details
| Name: |
us-gaap_PropertyPlantAndEquipmentByTypeAxis=us-gaap_OfficeEquipmentMember |
| Namespace Prefix: |
|
| Data Type: |
na |
| Balance Type: |
|
| Period Type: |
|
|
| X |
- Details
| Name: |
us-gaap_PropertyPlantAndEquipmentByTypeAxis=MUGH_LeasableEquipmentMember |
| Namespace Prefix: |
|
| Data Type: |
na |
| Balance Type: |
|
| Period Type: |
|
|
| X |
- Details
| Name: |
us-gaap_PropertyPlantAndEquipmentByTypeAxis=MUGH_OutletDesignFeeAndEquipmentMember |
| Namespace Prefix: |
|
| Data Type: |
na |
| Balance Type: |
|
| Period Type: |
|
|
| X |
- Details
| Name: |
us-gaap_PropertyPlantAndEquipmentByTypeAxis=MUGH_ApplicationDevelopmentFeeMember |
| Namespace Prefix: |
|
| Data Type: |
na |
| Balance Type: |
|
| Period Type: |
|
|
v3.23.3
| X |
- DefinitionAmount of write-down of assets recognized in the income statement. Includes, but is not limited to, losses from tangible assets, intangible assets and goodwill. Reference 1: http://fasb.org/us-gaap/role/ref/legacyRef
-Name Accounting Standards Codification
-Section 45
-Paragraph 28
-Subparagraph (b)
-SubTopic 10
-Topic 230
-Publisher FASB
-URI https://asc.fasb.org//1943274/2147482740/230-10-45-28
Reference 2: http://fasb.org/us-gaap/role/ref/legacyRef
-Name Accounting Standards Codification
-Topic 360
-SubTopic 10
-Section 45
-Paragraph 4
-Publisher FASB
-URI https://asc.fasb.org//1943274/2147482130/360-10-45-4
| Name: |
us-gaap_AssetImpairmentCharges |
| Namespace Prefix: |
us-gaap_ |
| Data Type: |
xbrli:monetaryItemType |
| Balance Type: |
debit |
| Period Type: |
duration |
|
| X |
- DefinitionThe amount of expense recognized in the current period that reflects the allocation of the cost of tangible assets over the assets' useful lives. Includes production and non-production related depreciation. Reference 1: http://fasb.org/us-gaap/role/ref/legacyRef
-Name Accounting Standards Codification
-Section 45
-Paragraph 28
-Subparagraph (b)
-SubTopic 10
-Topic 230
-Publisher FASB
-URI https://asc.fasb.org//1943274/2147482740/230-10-45-28
Reference 2: http://fasb.org/us-gaap/role/ref/legacyRef
-Name Accounting Standards Codification
-Topic 360
-SubTopic 10
-Section 50
-Paragraph 1
-Subparagraph (a)
-Publisher FASB
-URI https://asc.fasb.org//1943274/2147482099/360-10-50-1
| Name: |
us-gaap_Depreciation |
| Namespace Prefix: |
us-gaap_ |
| Data Type: |
xbrli:monetaryItemType |
| Balance Type: |
debit |
| Period Type: |
duration |
|
| X |
- DefinitionLine items represent financial concepts included in a table. These concepts are used to disclose reportable information associated with domain members defined in one or many axes to the table.
| Name: |
us-gaap_PropertyPlantAndEquipmentLineItems |
| Namespace Prefix: |
us-gaap_ |
| Data Type: |
xbrli:stringItemType |
| Balance Type: |
na |
| Period Type: |
duration |
|
| X |
- Details
| Name: |
us-gaap_PropertyPlantAndEquipmentByTypeAxis=MUGH_LeasableEquipmentMember |
| Namespace Prefix: |
|
| Data Type: |
na |
| Balance Type: |
|
| Period Type: |
|
|
v3.23.3
| X |
- DefinitionForeign currency translation adjustment.
| Name: |
MUGH_WirteOffForeignCurrencyTranslationAdjustment |
| Namespace Prefix: |
MUGH_ |
| Data Type: |
xbrli:monetaryItemType |
| Balance Type: |
debit |
| Period Type: |
instant |
|
| X |
- DefinitionAccumulated depreciation.
| Name: |
MUGH_WriteOffAccumulatedDepreciation |
| Namespace Prefix: |
MUGH_ |
| Data Type: |
xbrli:monetaryItemType |
| Balance Type: |
credit |
| Period Type: |
instant |
|
| X |
- DefinitionWrite off of property and equipment.
| Name: |
MUGH_WriteOffOfPropertyAndEquipment |
| Namespace Prefix: |
MUGH_ |
| Data Type: |
xbrli:monetaryItemType |
| Balance Type: |
debit |
| Period Type: |
instant |
|
| X |
- DefinitionTotal Write off of property and equipment.
| Name: |
MUGH_WriteOffOfPropertyAndEquipmentNet |
| Namespace Prefix: |
MUGH_ |
| Data Type: |
xbrli:monetaryItemType |
| Balance Type: |
debit |
| Period Type: |
instant |
|
| X |
- References
+ Details
| Name: |
us-gaap_PropertyPlantAndEquipmentAbstract |
| Namespace Prefix: |
us-gaap_ |
| Data Type: |
xbrli:stringItemType |
| Balance Type: |
na |
| Period Type: |
duration |
|
v3.23.3
SCHEDULE OF DISPOSAL OF PROPERTY, PLANT AND EQUIPMENT (Details) - USD ($)
|
12 Months Ended |
Jul. 31, 2023 |
Jul. 31, 2022 |
| Property, Plant and Equipment [Abstract] |
|
|
| Proceed from disposal of property, plant and equipment |
$ 20,514
|
$ 44,340
|
| Disposal of equipment at cost |
|
(27,726)
|
| Disposal of equipment written off at net book value |
(6)
|
|
| Disposal of equipment impaired at net book value |
(6,364)
|
|
| Accumulated depreciation |
|
10,965
|
| Foreign currency translation adjustment |
|
(40)
|
| Total gain on disposal |
$ 14,144
|
$ 27,539
|
| X |
- DefinitionAccumulated depreciation depletion and amortization sale of property plant and equipment.
| Name: |
MUGH_AccumulatedDepreciationDepletionAndAmortizationSaleOfPropertyPlantAndEquipment |
| Namespace Prefix: |
MUGH_ |
| Data Type: |
xbrli:monetaryItemType |
| Balance Type: |
credit |
| Period Type: |
duration |
|
| X |
- DefinitionDisposal of equipment impaired at net book value.
| Name: |
MUGH_DisposalOfEquipmentImpairedAtNetBookValue |
| Namespace Prefix: |
MUGH_ |
| Data Type: |
xbrli:monetaryItemType |
| Balance Type: |
credit |
| Period Type: |
duration |
|
| X |
- DefinitionDisposal of equipment written off at net book value.
| Name: |
MUGH_DisposalOfEquipmentWrittenOffAtNetBookValue |
| Namespace Prefix: |
MUGH_ |
| Data Type: |
xbrli:monetaryItemType |
| Balance Type: |
credit |
| Period Type: |
duration |
|
| X |
- DefinitionForeign currency translation adjustment.
| Name: |
MUGH_ForeignCurrencyTranslationAdjustment |
| Namespace Prefix: |
MUGH_ |
| Data Type: |
xbrli:monetaryItemType |
| Balance Type: |
credit |
| Period Type: |
duration |
|
| X |
- DefinitionProceed from disposal of property, plant and equipment.
| Name: |
MUGH_ProceedFromDisposalOfPropertyPlantAndEquipment |
| Namespace Prefix: |
MUGH_ |
| Data Type: |
xbrli:monetaryItemType |
| Balance Type: |
debit |
| Period Type: |
duration |
|
| X |
- DefinitionAmount of gain (loss) on sale or disposal of assets, including but not limited to property plant and equipment, intangible assets and equity in securities of subsidiaries or equity method investee. Reference 1: http://www.xbrl.org/2009/role/commonPracticeRef
-Topic 230
-SubTopic 10
-Name Accounting Standards Codification
-Section 45
-Paragraph 28
-Subparagraph (b)
-Publisher FASB
-URI https://asc.fasb.org//1943274/2147482740/230-10-45-28
| Name: |
us-gaap_GainLossOnDispositionOfAssets1 |
| Namespace Prefix: |
us-gaap_ |
| Data Type: |
xbrli:monetaryItemType |
| Balance Type: |
credit |
| Period Type: |
duration |
|
| X |
- DefinitionThe cash inflow from sale of machinery and equipment. Reference 1: http://fasb.org/us-gaap/role/ref/legacyRef
-Topic 230
-SubTopic 10
-Name Accounting Standards Codification
-Section 45
-Paragraph 12
-Subparagraph (c)
-Publisher FASB
-URI https://asc.fasb.org//1943274/2147482740/230-10-45-12
| Name: |
us-gaap_ProceedsFromSaleOfMachineryAndEquipment |
| Namespace Prefix: |
us-gaap_ |
| Data Type: |
xbrli:monetaryItemType |
| Balance Type: |
debit |
| Period Type: |
duration |
|
| X |
- References
+ Details
| Name: |
us-gaap_PropertyPlantAndEquipmentAbstract |
| Namespace Prefix: |
us-gaap_ |
| Data Type: |
xbrli:stringItemType |
| Balance Type: |
na |
| Period Type: |
duration |
|
v3.23.3
| X |
- Definition
+ References
+ Details
| Name: |
MUGH_AccumulatedImputedInterestOfOperatingLease |
| Namespace Prefix: |
MUGH_ |
| Data Type: |
xbrli:monetaryItemType |
| Balance Type: |
credit |
| Period Type: |
instant |
|
| X |
- References
+ Details
| Name: |
MUGH_DisclosureLeaseAbstract |
| Namespace Prefix: |
MUGH_ |
| Data Type: |
xbrli:stringItemType |
| Balance Type: |
na |
| Period Type: |
duration |
|
| X |
- Definition
+ References
+ Details
| Name: |
MUGH_InitialRecognitionOfOperatingLease |
| Namespace Prefix: |
MUGH_ |
| Data Type: |
xbrli:monetaryItemType |
| Balance Type: |
debit |
| Period Type: |
instant |
|
| X |
- DefinitionLess remeasurement of existing lease.
| Name: |
MUGH_LessRemeasurementOfExistingLease |
| Namespace Prefix: |
MUGH_ |
| Data Type: |
xbrli:monetaryItemType |
| Balance Type: |
credit |
| Period Type: |
instant |
|
| X |
- DefinitionOperating lease right and operating lease liability.
| Name: |
MUGH_OperatingLeaseRightAndOperatingLeaseLiability |
| Namespace Prefix: |
MUGH_ |
| Data Type: |
xbrli:monetaryItemType |
| Balance Type: |
debit |
| Period Type: |
instant |
|
v3.23.3
SCHEDULE OF OPERATING LEASE RIGHT OF USE ASSET (Details) - USD ($)
|
12 Months Ended |
Jul. 31, 2023 |
Jul. 31, 2022 |
| Lease |
|
|
| Balance |
$ 6,267
|
$ 12,966
|
| Less: Termination of lease |
|
(10,285)
|
| Add: New operating lease liability |
5,223
|
10,738
|
| Foreign exchange translation loss |
(246)
|
(407)
|
| Amortization |
(4,837)
|
(6,745)
|
| Balance end of the year |
$ 6,407
|
$ 6,267
|
| X |
- DefinitionBalance on initial recognition.
| Name: |
MUGH_BalanceOnInitialRecognition |
| Namespace Prefix: |
MUGH_ |
| Data Type: |
xbrli:monetaryItemType |
| Balance Type: |
debit |
| Period Type: |
duration |
|
| X |
- References
+ Details
| Name: |
MUGH_DisclosureLeaseAbstract |
| Namespace Prefix: |
MUGH_ |
| Data Type: |
xbrli:stringItemType |
| Balance Type: |
na |
| Period Type: |
duration |
|
| X |
- DefinitionOperating lease right of use asset accumulated amortization.
| Name: |
MUGH_OperatingLeaseRightOfUseAssetAccumulatedAmortization |
| Namespace Prefix: |
MUGH_ |
| Data Type: |
xbrli:monetaryItemType |
| Balance Type: |
debit |
| Period Type: |
duration |
|
| X |
- DefinitionLeased asset- right of use current.
| Name: |
MUGH_OperatingLeaseRightOfUseAssetCurrent |
| Namespace Prefix: |
MUGH_ |
| Data Type: |
xbrli:monetaryItemType |
| Balance Type: |
debit |
| Period Type: |
duration |
|
| X |
- DefinitionOperating lease right of use asset foreign exchange translation gain loss.
| Name: |
MUGH_OperatingLeaseRightOfUseAssetForeignExchangeTranslationGainLoss |
| Namespace Prefix: |
MUGH_ |
| Data Type: |
xbrli:monetaryItemType |
| Balance Type: |
credit |
| Period Type: |
duration |
|
| X |
- DefinitionOperating lease right of use asset new operating lease liability.
| Name: |
MUGH_OperatingLeaseRightOfUseAssetNewOperatingLeaseLiability |
| Namespace Prefix: |
MUGH_ |
| Data Type: |
xbrli:monetaryItemType |
| Balance Type: |
debit |
| Period Type: |
duration |
|
| X |
- DefinitionOperating lease right of use asset termination of lease.
| Name: |
MUGH_OperatingLeaseRightOfUseAssetTerminationOfLease |
| Namespace Prefix: |
MUGH_ |
| Data Type: |
xbrli:monetaryItemType |
| Balance Type: |
credit |
| Period Type: |
duration |
|
v3.23.3
SCHEDULE OF OPERATING LEASE LIABILITY (Details) - USD ($)
|
12 Months Ended |
Jul. 31, 2023 |
Jul. 31, 2022 |
| Lease |
|
|
| As of August 1 |
$ 6,559
|
$ 2,647
|
| Less: Termination of lease |
|
(2,647)
|
| Add: New operating lease liability |
5,223
|
11,581
|
| Less: Remeasurement of existing lease |
|
(843)
|
| Less: Gross repayment |
(5,509)
|
(3,892)
|
| Add: Imputed interest |
176
|
278
|
| Foreign exchange translation loss |
(250)
|
(565)
|
| Balance end of the period/year |
$ 6,199
|
$ 6,559
|
| X |
- References
+ Details
| Name: |
MUGH_DisclosureLeaseAbstract |
| Namespace Prefix: |
MUGH_ |
| Data Type: |
xbrli:stringItemType |
| Balance Type: |
na |
| Period Type: |
duration |
|
| X |
- Definition
+ References
+ Details
| Name: |
MUGH_EffectOfTranslationExchange |
| Namespace Prefix: |
MUGH_ |
| Data Type: |
xbrli:monetaryItemType |
| Balance Type: |
credit |
| Period Type: |
duration |
|
| X |
- DefinitionForeign exchange translation gain loss.
| Name: |
MUGH_ForeignExchangeTranslationGainLoss |
| Namespace Prefix: |
MUGH_ |
| Data Type: |
xbrli:monetaryItemType |
| Balance Type: |
credit |
| Period Type: |
duration |
|
| X |
- DefinitionNew operating lease liability.
| Name: |
MUGH_NewOperatingLeaseLiability |
| Namespace Prefix: |
MUGH_ |
| Data Type: |
xbrli:monetaryItemType |
| Balance Type: |
debit |
| Period Type: |
duration |
|
| X |
- DefinitionOperating lease right of use asset initial recognition.
| Name: |
MUGH_OperatingLeaseRightOfUseAssetInitialRecognition |
| Namespace Prefix: |
MUGH_ |
| Data Type: |
xbrli:monetaryItemType |
| Balance Type: |
debit |
| Period Type: |
instant |
|
| X |
- DefinitionRemeasurement of existing lease liabilities.
| Name: |
MUGH_RemeasurementOfExistingLeaseLiabilities |
| Namespace Prefix: |
MUGH_ |
| Data Type: |
xbrli:monetaryItemType |
| Balance Type: |
credit |
| Period Type: |
duration |
|
| X |
- Definition
+ References
+ Details
| Name: |
MUGH_RepaymentOfOperatingLease |
| Namespace Prefix: |
MUGH_ |
| Data Type: |
xbrli:monetaryItemType |
| Balance Type: |
credit |
| Period Type: |
duration |
|
| X |
- Definition
+ References
+ Details
| Name: |
MUGH_TerminationOfLeaseLiability |
| Namespace Prefix: |
MUGH_ |
| Data Type: |
xbrli:monetaryItemType |
| Balance Type: |
credit |
| Period Type: |
duration |
|
| X |
- DefinitionPresent value of lessee's discounted obligation for lease payments from operating lease. Reference 1: http://www.xbrl.org/2003/role/disclosureRef
-Topic 842
-SubTopic 20
-Name Accounting Standards Codification
-Section 45
-Paragraph 1
-Subparagraph (b)
-Publisher FASB
-URI https://asc.fasb.org//1943274/2147479041/842-20-45-1
| Name: |
us-gaap_OperatingLeaseLiability |
| Namespace Prefix: |
us-gaap_ |
| Data Type: |
xbrli:monetaryItemType |
| Balance Type: |
credit |
| Period Type: |
instant |
|
v3.23.3
| X |
- References
+ Details
| Name: |
MUGH_DisclosureLeaseAbstract |
| Namespace Prefix: |
MUGH_ |
| Data Type: |
xbrli:stringItemType |
| Balance Type: |
na |
| Period Type: |
duration |
|
| X |
- DefinitionAmount of lessee's undiscounted obligation for lease payment for operating lease. Reference 1: http://www.xbrl.org/2003/role/disclosureRef
-Topic 842
-SubTopic 20
-Name Accounting Standards Codification
-Section 50
-Paragraph 6
-Publisher FASB
-URI https://asc.fasb.org//1943274/2147478964/842-20-50-6
| Name: |
us-gaap_LesseeOperatingLeaseLiabilityPaymentsDue |
| Namespace Prefix: |
us-gaap_ |
| Data Type: |
xbrli:monetaryItemType |
| Balance Type: |
credit |
| Period Type: |
instant |
|
| X |
- DefinitionAmount of lessee's undiscounted obligation for lease payments for operating lease, due in second rolling twelve months following latest statement of financial position date. For interim and annual periods when interim periods are reported on a rolling approach, from latest statement of financial position date. Reference 1: http://www.xbrl.org/2009/role/commonPracticeRef
-Topic 842
-SubTopic 20
-Name Accounting Standards Codification
-Section 50
-Paragraph 6
-Publisher FASB
-URI https://asc.fasb.org//1943274/2147478964/842-20-50-6
| Name: |
us-gaap_LesseeOperatingLeaseLiabilityPaymentsDueInRollingYearTwo |
| Namespace Prefix: |
us-gaap_ |
| Data Type: |
xbrli:monetaryItemType |
| Balance Type: |
credit |
| Period Type: |
instant |
|
| X |
- DefinitionAmount of lessee's undiscounted obligation for lease payments for operating lease, due in next rolling twelve months following latest statement of financial position date. For interim and annual periods when interim periods are reported on a rolling approach, from latest statement of financial position date. Reference 1: http://www.xbrl.org/2009/role/commonPracticeRef
-Topic 842
-SubTopic 20
-Name Accounting Standards Codification
-Section 50
-Paragraph 6
-Publisher FASB
-URI https://asc.fasb.org//1943274/2147478964/842-20-50-6
| Name: |
us-gaap_LesseeOperatingLeaseLiabilityPaymentsDueNextRollingTwelveMonths |
| Namespace Prefix: |
us-gaap_ |
| Data Type: |
xbrli:monetaryItemType |
| Balance Type: |
credit |
| Period Type: |
instant |
|
v3.23.3
| X |
- References
+ Details
| Name: |
MUGH_DisclosureLeaseAbstract |
| Namespace Prefix: |
MUGH_ |
| Data Type: |
xbrli:stringItemType |
| Balance Type: |
na |
| Period Type: |
duration |
|
| X |
- DefinitionRight-of-use assets obtained in exchange for operating lease liabilities.
| Name: |
MUGH_RightofuseAssetsObtainedInExchangeForOperatingLeaseLiabilities |
| Namespace Prefix: |
MUGH_ |
| Data Type: |
xbrli:monetaryItemType |
| Balance Type: |
debit |
| Period Type: |
duration |
|
| X |
- DefinitionAmount of single lease cost, calculated by allocation of remaining cost of lease over remaining lease term. Includes, but is not limited to, single lease cost, after impairment of right-of-use asset, calculated by amortization of remaining right-of-use asset and accretion of lease liability. Reference 1: http://www.xbrl.org/2003/role/exampleRef
-Topic 842
-SubTopic 20
-Name Accounting Standards Codification
-Section 55
-Paragraph 53
-Publisher FASB
-URI https://asc.fasb.org//1943274/2147479589/842-20-55-53
Reference 2: http://www.xbrl.org/2003/role/disclosureRef
-Topic 842
-SubTopic 20
-Name Accounting Standards Codification
-Section 50
-Paragraph 4
-Subparagraph (b)
-Publisher FASB
-URI https://asc.fasb.org//1943274/2147478964/842-20-50-4
| Name: |
us-gaap_OperatingLeaseCost |
| Namespace Prefix: |
us-gaap_ |
| Data Type: |
xbrli:monetaryItemType |
| Balance Type: |
debit |
| Period Type: |
duration |
|
| X |
- DefinitionWeighted average discount rate for operating lease calculated at point in time. Reference 1: http://www.xbrl.org/2003/role/exampleRef
-Topic 842
-SubTopic 20
-Name Accounting Standards Codification
-Section 55
-Paragraph 53
-Publisher FASB
-URI https://asc.fasb.org//1943274/2147479589/842-20-55-53
Reference 2: http://www.xbrl.org/2003/role/disclosureRef
-Topic 842
-SubTopic 20
-Name Accounting Standards Codification
-Section 50
-Paragraph 4
-Subparagraph (g)(4)
-Publisher FASB
-URI https://asc.fasb.org//1943274/2147478964/842-20-50-4
| Name: |
us-gaap_OperatingLeaseWeightedAverageDiscountRatePercent |
| Namespace Prefix: |
us-gaap_ |
| Data Type: |
dtr-types:percentItemType |
| Balance Type: |
na |
| Period Type: |
instant |
|
| X |
- DefinitionWeighted average remaining lease term for operating lease, in 'PnYnMnDTnHnMnS' format, for example, 'P1Y5M13D' represents reported fact of one year, five months, and thirteen days. Reference 1: http://www.xbrl.org/2003/role/exampleRef
-Topic 842
-SubTopic 20
-Name Accounting Standards Codification
-Section 55
-Paragraph 53
-Publisher FASB
-URI https://asc.fasb.org//1943274/2147479589/842-20-55-53
Reference 2: http://www.xbrl.org/2003/role/disclosureRef
-Topic 842
-SubTopic 20
-Name Accounting Standards Codification
-Section 50
-Paragraph 4
-Subparagraph (g)(3)
-Publisher FASB
-URI https://asc.fasb.org//1943274/2147478964/842-20-50-4
| Name: |
us-gaap_OperatingLeaseWeightedAverageRemainingLeaseTerm1 |
| Namespace Prefix: |
us-gaap_ |
| Data Type: |
xbrli:durationItemType |
| Balance Type: |
na |
| Period Type: |
instant |
|
v3.23.3
LEASE (Details Narrative) - USD ($)
|
12 Months Ended |
|
Jul. 31, 2023 |
Jul. 31, 2022 |
Nov. 06, 2021 |
| Operating Lease, Right-of-Use Asset |
$ 6,407
|
$ 6,267
|
|
| Operating Lease, Weighted Average Discount Rate, Percent |
4.35%
|
4.35%
|
|
| Amortization of operating lease right of use asset |
$ 4,837
|
$ 6,745
|
|
| Lease expenses |
$ 176
|
$ 411
|
|
| Accounting Standards Update 2016-02 [Member] |
|
|
|
| Operating Lease, Right-of-Use Asset |
|
|
$ 11,581
|
| Operating Lease, Weighted Average Discount Rate, Percent |
|
|
4.35%
|
| X |
- DefinitionAmount of operating lease expense. Excludes sublease income. Reference 1: http://www.xbrl.org/2009/role/commonPracticeRef
-Topic 842
-SubTopic 20
-Name Accounting Standards Codification
-Section 45
-Paragraph 4
-Subparagraph (b)
-Publisher FASB
-URI https://asc.fasb.org//1943274/2147479041/842-20-45-4
| Name: |
us-gaap_OperatingLeaseExpense |
| Namespace Prefix: |
us-gaap_ |
| Data Type: |
xbrli:monetaryItemType |
| Balance Type: |
debit |
| Period Type: |
duration |
|
| X |
- DefinitionAmount of lessee's right to use underlying asset under operating lease. Reference 1: http://www.xbrl.org/2003/role/disclosureRef
-Topic 842
-SubTopic 20
-Name Accounting Standards Codification
-Section 45
-Paragraph 1
-Subparagraph (a)
-Publisher FASB
-URI https://asc.fasb.org//1943274/2147479041/842-20-45-1
| Name: |
us-gaap_OperatingLeaseRightOfUseAsset |
| Namespace Prefix: |
us-gaap_ |
| Data Type: |
xbrli:monetaryItemType |
| Balance Type: |
debit |
| Period Type: |
instant |
|
| X |
- DefinitionAmount of periodic reduction over lease term of carrying amount of right-of-use asset from operating lease. Reference 1: http://www.xbrl.org/2009/role/commonPracticeRef
-Topic 230
-SubTopic 10
-Name Accounting Standards Codification
-Section 45
-Paragraph 28
-Subparagraph (b)
-Publisher FASB
-URI https://asc.fasb.org//1943274/2147482740/230-10-45-28
| Name: |
us-gaap_OperatingLeaseRightOfUseAssetAmortizationExpense |
| Namespace Prefix: |
us-gaap_ |
| Data Type: |
xbrli:monetaryItemType |
| Balance Type: |
debit |
| Period Type: |
duration |
|
| X |
- DefinitionWeighted average discount rate for operating lease calculated at point in time. Reference 1: http://www.xbrl.org/2003/role/exampleRef
-Topic 842
-SubTopic 20
-Name Accounting Standards Codification
-Section 55
-Paragraph 53
-Publisher FASB
-URI https://asc.fasb.org//1943274/2147479589/842-20-55-53
Reference 2: http://www.xbrl.org/2003/role/disclosureRef
-Topic 842
-SubTopic 20
-Name Accounting Standards Codification
-Section 50
-Paragraph 4
-Subparagraph (g)(4)
-Publisher FASB
-URI https://asc.fasb.org//1943274/2147478964/842-20-50-4
| Name: |
us-gaap_OperatingLeaseWeightedAverageDiscountRatePercent |
| Namespace Prefix: |
us-gaap_ |
| Data Type: |
dtr-types:percentItemType |
| Balance Type: |
na |
| Period Type: |
instant |
|
| X |
- Details
| Name: |
us-gaap_AdjustmentsForNewAccountingPronouncementsAxis=us-gaap_AccountingStandardsUpdate201602Member |
| Namespace Prefix: |
|
| Data Type: |
na |
| Balance Type: |
|
| Period Type: |
|
|
v3.23.3
| X |
- DefinitionForeign currency translation adjustment.
| Name: |
MUGH_FiniteLivedIntangibleAssetsForeignCurrencyTranslationAdjustment |
| Namespace Prefix: |
MUGH_ |
| Data Type: |
xbrli:monetaryItemType |
| Balance Type: |
credit |
| Period Type: |
instant |
|
| X |
- Definition
+ References
+ Details
| Name: |
MUGH_FiniteLivedIntangibleAssetsNetImpairment |
| Namespace Prefix: |
MUGH_ |
| Data Type: |
xbrli:monetaryItemType |
| Balance Type: |
debit |
| Period Type: |
instant |
|
| X |
- DefinitionAccumulated amount of amortization of assets, excluding financial assets and goodwill, lacking physical substance with a finite life. Reference 1: http://www.xbrl.org/2003/role/disclosureRef
-Topic 210
-SubTopic 10
-Name Accounting Standards Codification
-Section S99
-Paragraph 1
-Subparagraph (SX 210.5-02(16))
-Publisher FASB
-URI https://asc.fasb.org//1943274/2147480566/210-10-S99-1
Reference 2: http://www.xbrl.org/2003/role/disclosureRef
-Topic 350
-SubTopic 30
-Name Accounting Standards Codification
-Section 50
-Paragraph 2
-Subparagraph (a)(1)
-Publisher FASB
-URI https://asc.fasb.org//1943274/2147482665/350-30-50-2
| Name: |
us-gaap_FiniteLivedIntangibleAssetsAccumulatedAmortization |
| Namespace Prefix: |
us-gaap_ |
| Data Type: |
xbrli:monetaryItemType |
| Balance Type: |
credit |
| Period Type: |
instant |
|
| X |
- DefinitionAmount before amortization of assets, excluding financial assets and goodwill, lacking physical substance with a finite life. Reference 1: http://www.xbrl.org/2003/role/disclosureRef
-Topic 928
-SubTopic 340
-Name Accounting Standards Codification
-Section 50
-Paragraph 1
-Publisher FASB
-URI https://asc.fasb.org//1943274/2147483147/928-340-50-1
Reference 2: http://fasb.org/us-gaap/role/ref/legacyRef
-Topic 350
-SubTopic 30
-Name Accounting Standards Codification
-Section 50
-Paragraph 2
-Subparagraph (a)(1)
-Publisher FASB
-URI https://asc.fasb.org//1943274/2147482665/350-30-50-2
| Name: |
us-gaap_FiniteLivedIntangibleAssetsGross |
| Namespace Prefix: |
us-gaap_ |
| Data Type: |
xbrli:monetaryItemType |
| Balance Type: |
debit |
| Period Type: |
instant |
|
| X |
- DefinitionAmount after amortization of assets, excluding financial assets and goodwill, lacking physical substance with a finite life. Reference 1: http://www.xbrl.org/2003/role/disclosureRef
-Topic 926
-SubTopic 20
-Name Accounting Standards Codification
-Section 50
-Paragraph 5
-Publisher FASB
-URI https://asc.fasb.org//1943274/2147483154/926-20-50-5
Reference 2: http://fasb.org/us-gaap/role/ref/legacyRef
-Topic 350
-SubTopic 30
-Name Accounting Standards Codification
-Section 50
-Paragraph 2
-Subparagraph (a)(1)
-Publisher FASB
-URI https://asc.fasb.org//1943274/2147482665/350-30-50-2
| Name: |
us-gaap_FiniteLivedIntangibleAssetsNet |
| Namespace Prefix: |
us-gaap_ |
| Data Type: |
xbrli:monetaryItemType |
| Balance Type: |
debit |
| Period Type: |
instant |
|
| X |
- References
+ Details
| Name: |
us-gaap_GoodwillAndIntangibleAssetsDisclosureAbstract |
| Namespace Prefix: |
us-gaap_ |
| Data Type: |
xbrli:stringItemType |
| Balance Type: |
na |
| Period Type: |
duration |
|
v3.23.3
| X |
- DefinitionThe aggregate expense charged against earnings to allocate the cost of intangible assets (nonphysical assets not used in production) in a systematic and rational manner to the periods expected to benefit from such assets. As a noncash expense, this element is added back to net income when calculating cash provided by or used in operations using the indirect method. Reference 1: http://fasb.org/us-gaap/role/ref/legacyRef
-Name Accounting Standards Codification
-Section 45
-Paragraph 28
-Subparagraph (b)
-SubTopic 10
-Topic 230
-Publisher FASB
-URI https://asc.fasb.org//1943274/2147482740/230-10-45-28
Reference 2: http://fasb.org/us-gaap/role/ref/legacyRef
-Name Accounting Standards Codification
-Topic 350
-SubTopic 30
-Section 45
-Paragraph 2
-Publisher FASB
-URI https://asc.fasb.org//1943274/2147482686/350-30-45-2
Reference 3: http://fasb.org/us-gaap/role/ref/legacyRef
-Name Accounting Standards Codification
-Topic 350
-SubTopic 30
-Section 50
-Paragraph 2
-Subparagraph (a)(2)
-Publisher FASB
-URI https://asc.fasb.org//1943274/2147482665/350-30-50-2
| Name: |
us-gaap_AmortizationOfIntangibleAssets |
| Namespace Prefix: |
us-gaap_ |
| Data Type: |
xbrli:monetaryItemType |
| Balance Type: |
debit |
| Period Type: |
duration |
|
| X |
- References
+ Details
| Name: |
us-gaap_GoodwillAndIntangibleAssetsDisclosureAbstract |
| Namespace Prefix: |
us-gaap_ |
| Data Type: |
xbrli:stringItemType |
| Balance Type: |
na |
| Period Type: |
duration |
|
v3.23.3
| X |
- References
+ Details
| Name: |
MUGH_DisclosurePrepaymentsAndDepositsAbstract |
| Namespace Prefix: |
MUGH_ |
| Data Type: |
xbrli:stringItemType |
| Balance Type: |
na |
| Period Type: |
duration |
|
| X |
- DefinitionCarrying value of amounts transferred to third parties for security purposes that are expected to be returned or applied towards payment within one year or during the operating cycle, if shorter. Reference 1: http://www.xbrl.org/2009/role/commonPracticeRef
-Topic 210
-SubTopic 10
-Name Accounting Standards Codification
-Section S99
-Paragraph 1
-Subparagraph (SX 210.5-02(8))
-Publisher FASB
-URI https://asc.fasb.org//1943274/2147480566/210-10-S99-1
| Name: |
us-gaap_DepositsAssetsCurrent |
| Namespace Prefix: |
us-gaap_ |
| Data Type: |
xbrli:monetaryItemType |
| Balance Type: |
debit |
| Period Type: |
instant |
|
| X |
- DefinitionAmount of asset related to consideration paid in advance for costs that provide economic benefits in future periods, and amount of other assets that are expected to be realized or consumed within one year or the normal operating cycle, if longer. Reference 1: http://www.xbrl.org/2009/role/commonPracticeRef
-Topic 210
-SubTopic 10
-Name Accounting Standards Codification
-Section S99
-Paragraph 1
-Subparagraph (SX 210.5-02(9))
-Publisher FASB
-URI https://asc.fasb.org//1943274/2147480566/210-10-S99-1
| Name: |
us-gaap_PrepaidExpenseAndOtherAssetsCurrent |
| Namespace Prefix: |
us-gaap_ |
| Data Type: |
xbrli:monetaryItemType |
| Balance Type: |
debit |
| Period Type: |
instant |
|
| X |
- DefinitionAmount of asset related to consideration paid in advance for costs that provide economic benefits within a future period of one year or the normal operating cycle, if longer. Reference 1: http://www.xbrl.org/2003/role/exampleRef
-Topic 210
-SubTopic 10
-Name Accounting Standards Codification
-Section 45
-Paragraph 1
-Subparagraph (g)
-Publisher FASB
-URI https://asc.fasb.org//1943274/2147483467/210-10-45-1
Reference 2: http://www.xbrl.org/2003/role/disclosureRef
-Topic 210
-SubTopic 10
-Name Accounting Standards Codification
-Section S99
-Paragraph 1
-Subparagraph (SX 210.5-02(7))
-Publisher FASB
-URI https://asc.fasb.org//1943274/2147480566/210-10-S99-1
Reference 3: http://www.xbrl.org/2003/role/disclosureRef
-Topic 340
-SubTopic 10
-Name Accounting Standards Codification
-Section 05
-Paragraph 5
-Publisher FASB
-URI https://asc.fasb.org//1943274/2147482955/340-10-05-5
Reference 4: http://www.xbrl.org/2003/role/disclosureRef
-Topic 340
-SubTopic 10
-Name Accounting Standards Codification
-Section 45
-Paragraph 1
-Publisher FASB
-URI https://asc.fasb.org//1943274/2147483032/340-10-45-1
| Name: |
us-gaap_PrepaidExpenseCurrent |
| Namespace Prefix: |
us-gaap_ |
| Data Type: |
xbrli:monetaryItemType |
| Balance Type: |
debit |
| Period Type: |
instant |
|
v3.23.3
| X |
- DefinitionLine items represent financial concepts included in a table. These concepts are used to disclose reportable information associated with domain members defined in one or many axes to the table.
| Name: |
us-gaap_DefinedBenefitPlanDisclosureLineItems |
| Namespace Prefix: |
us-gaap_ |
| Data Type: |
xbrli:stringItemType |
| Balance Type: |
na |
| Period Type: |
duration |
|
| X |
- DefinitionAmount, after allowance, of receivables classified as other, due within one year or the operating cycle, if longer.
| Name: |
us-gaap_OtherReceivablesNetCurrent |
| Namespace Prefix: |
us-gaap_ |
| Data Type: |
xbrli:monetaryItemType |
| Balance Type: |
debit |
| Period Type: |
instant |
|
v3.23.3
| X |
- References
+ Details
| Name: |
us-gaap_InventoryDisclosureAbstract |
| Namespace Prefix: |
us-gaap_ |
| Data Type: |
xbrli:stringItemType |
| Balance Type: |
na |
| Period Type: |
duration |
|
| X |
- DefinitionAmount before valuation and LIFO reserves of completed merchandise or goods expected to be sold within one year or operating cycle, if longer. Reference 1: http://www.xbrl.org/2009/role/commonPracticeRef
-Topic 210
-SubTopic 10
-Name Accounting Standards Codification
-Section S99
-Paragraph 1
-Subparagraph (SX 210.5-02(6)(a)(1))
-Publisher FASB
-URI https://asc.fasb.org//1943274/2147480566/210-10-S99-1
| Name: |
us-gaap_InventoryFinishedGoods |
| Namespace Prefix: |
us-gaap_ |
| Data Type: |
xbrli:monetaryItemType |
| Balance Type: |
debit |
| Period Type: |
instant |
|
| X |
- DefinitionAmount after valuation and LIFO reserves of inventory expected to be sold, or consumed within one year or operating cycle, if longer. Reference 1: http://www.xbrl.org/2003/role/exampleRef
-Topic 852
-SubTopic 10
-Name Accounting Standards Codification
-Section 55
-Paragraph 10
-Publisher FASB
-URI https://asc.fasb.org//1943274/2147481372/852-10-55-10
Reference 2: http://www.xbrl.org/2003/role/exampleRef
-Topic 210
-SubTopic 10
-Name Accounting Standards Codification
-Section 45
-Paragraph 1
-Subparagraph (b)
-Publisher FASB
-URI https://asc.fasb.org//1943274/2147483467/210-10-45-1
Reference 3: http://www.xbrl.org/2003/role/disclosureRef
-Topic 210
-SubTopic 10
-Name Accounting Standards Codification
-Section S99
-Paragraph 1
-Subparagraph (SX 210.5-02(6))
-Publisher FASB
-URI https://asc.fasb.org//1943274/2147480566/210-10-S99-1
| Name: |
us-gaap_InventoryNet |
| Namespace Prefix: |
us-gaap_ |
| Data Type: |
xbrli:monetaryItemType |
| Balance Type: |
debit |
| Period Type: |
instant |
|
v3.23.3
| X |
- DefinitionLine items represent financial concepts included in a table. These concepts are used to disclose reportable information associated with domain members defined in one or many axes to the table.
| Name: |
us-gaap_DefinedBenefitPlanDisclosureLineItems |
| Namespace Prefix: |
us-gaap_ |
| Data Type: |
xbrli:stringItemType |
| Balance Type: |
na |
| Period Type: |
duration |
|
| X |
- DefinitionAmount of liabilities classified as other, due after one year or the normal operating cycle, if longer. Reference 1: http://fasb.org/us-gaap/role/ref/legacyRef
-Name Accounting Standards Codification
-Topic 210
-SubTopic 10
-Section S99
-Paragraph 1
-Subparagraph (SX 210.5-02.24)
-Publisher FASB
-URI https://asc.fasb.org//1943274/2147480566/210-10-S99-1
| Name: |
us-gaap_OtherLiabilitiesNoncurrent |
| Namespace Prefix: |
us-gaap_ |
| Data Type: |
xbrli:monetaryItemType |
| Balance Type: |
credit |
| Period Type: |
instant |
|
v3.23.3
| X |
- References
+ Details
| Name: |
MUGH_DisclosureLoanFromDirectorAbstract |
| Namespace Prefix: |
MUGH_ |
| Data Type: |
xbrli:stringItemType |
| Balance Type: |
na |
| Period Type: |
duration |
|
| X |
- DefinitionLoan from director current.
| Name: |
MUGH_LoanFromDirectorCurrent |
| Namespace Prefix: |
MUGH_ |
| Data Type: |
xbrli:monetaryItemType |
| Balance Type: |
credit |
| Period Type: |
instant |
|
| X |
- DefinitionLoan from director noncurrent.
| Name: |
MUGH_LoanFromDirectorNoncurrent |
| Namespace Prefix: |
MUGH_ |
| Data Type: |
xbrli:monetaryItemType |
| Balance Type: |
credit |
| Period Type: |
instant |
|
v3.23.3
SCHEDULE OF OTHER PAYABLES AND ACCRUED LIABILITIES (Details) - USD ($)
|
Jul. 31, 2023 |
Jul. 31, 2022 |
| Payables and Accruals [Abstract] |
|
|
| Other payables |
$ 40,854
|
$ 45,865
|
| Accrued audit fees |
15,000
|
15,000
|
| Accrued professional fees |
9,600
|
5,000
|
| Total other payables and accrued liabilities |
$ 65,454
|
$ 65,865
|
| X |
- Definition
+ References
+ Details
| Name: |
MUGH_AccruedAuditFeesCurrent |
| Namespace Prefix: |
MUGH_ |
| Data Type: |
xbrli:monetaryItemType |
| Balance Type: |
credit |
| Period Type: |
instant |
|
| X |
- DefinitionAmount of liabilities incurred to vendors for goods and services received, and accrued liabilities classified as other, payable within one year or the normal operating cycle, if longer.
| Name: |
us-gaap_AccountsPayableAndOtherAccruedLiabilitiesCurrent |
| Namespace Prefix: |
us-gaap_ |
| Data Type: |
xbrli:monetaryItemType |
| Balance Type: |
credit |
| Period Type: |
instant |
|
| X |
- DefinitionCarrying value as of the balance sheet date of obligations incurred through that date and payable for professional fees, such as for legal and accounting services received. Used to reflect the current portion of the liabilities (due within one year or within the normal operating cycle if longer). Reference 1: http://fasb.org/us-gaap/role/ref/legacyRef
-Name Accounting Standards Codification
-Topic 210
-SubTopic 10
-Section S99
-Paragraph 1
-Subparagraph (SX 210.5-02.20)
-Publisher FASB
-URI https://asc.fasb.org//1943274/2147480566/210-10-S99-1
| Name: |
us-gaap_AccruedProfessionalFeesCurrent |
| Namespace Prefix: |
us-gaap_ |
| Data Type: |
xbrli:monetaryItemType |
| Balance Type: |
credit |
| Period Type: |
instant |
|
| X |
- DefinitionAmount of liabilities incurred and payable to vendors for goods and services received classified as other, and expenses incurred but not yet paid, payable within one year or the operating cycle, if longer.
| Name: |
us-gaap_OtherAccountsPayableAndAccruedLiabilities |
| Namespace Prefix: |
us-gaap_ |
| Data Type: |
xbrli:monetaryItemType |
| Balance Type: |
credit |
| Period Type: |
instant |
|
| X |
- References
+ Details
| Name: |
us-gaap_PayablesAndAccrualsAbstract |
| Namespace Prefix: |
us-gaap_ |
| Data Type: |
xbrli:stringItemType |
| Balance Type: |
na |
| Period Type: |
duration |
|
v3.23.3
| X |
- DefinitionLine items represent financial concepts included in a table. These concepts are used to disclose reportable information associated with domain members defined in one or many axes to the table.
| Name: |
us-gaap_DefinedBenefitPlanDisclosureLineItems |
| Namespace Prefix: |
us-gaap_ |
| Data Type: |
xbrli:stringItemType |
| Balance Type: |
na |
| Period Type: |
duration |
|
| X |
- DefinitionAmount of liabilities classified as other. Reference 1: http://www.xbrl.org/2003/role/exampleRef
-Topic 946
-SubTopic 830
-Name Accounting Standards Codification
-Section 55
-Paragraph 12
-Publisher FASB
-URI https://asc.fasb.org//1943274/2147480167/946-830-55-12
Reference 2: http://www.xbrl.org/2003/role/disclosureRef
-Topic 946
-SubTopic 210
-Name Accounting Standards Codification
-Section S99
-Paragraph 1
-Subparagraph (SX 210.6-04(12)(b)(2))
-Publisher FASB
-URI https://asc.fasb.org//1943274/2147479617/946-210-S99-1
Reference 3: http://www.xbrl.org/2003/role/disclosureRef
-Topic 946
-SubTopic 210
-Name Accounting Standards Codification
-Section S99
-Paragraph 1
-Subparagraph (SX 210.6-04(12)(b)(3))
-Publisher FASB
-URI https://asc.fasb.org//1943274/2147479617/946-210-S99-1
Reference 4: http://www.xbrl.org/2003/role/disclosureRef
-Topic 944
-SubTopic 210
-Name Accounting Standards Codification
-Section S99
-Paragraph 1
-Subparagraph (SX 210.7-03(15))
-Publisher FASB
-URI https://asc.fasb.org//1943274/2147479440/944-210-S99-1
Reference 5: http://www.xbrl.org/2009/role/commonPracticeRef
-Topic 946
-SubTopic 210
-Name Accounting Standards Codification
-Section S99
-Paragraph 1
-Subparagraph (SX 210.6-04(12)(b)(1))
-Publisher FASB
-URI https://asc.fasb.org//1943274/2147479617/946-210-S99-1
Reference 6: http://fasb.org/us-gaap/role/ref/legacyRef
-Name Accounting Standards Codification
-Topic 942
-SubTopic 210
-Section S99
-Paragraph 1
-Subparagraph (SX 210.9-03.15)
-Publisher FASB
-URI https://asc.fasb.org//1943274/2147479853/942-210-S99-1
| Name: |
us-gaap_OtherLiabilities |
| Namespace Prefix: |
us-gaap_ |
| Data Type: |
xbrli:monetaryItemType |
| Balance Type: |
credit |
| Period Type: |
instant |
|
v3.23.3
| X |
- DefinitionAmount of liabilities classified as other. Reference 1: http://www.xbrl.org/2003/role/exampleRef
-Topic 946
-SubTopic 830
-Name Accounting Standards Codification
-Section 55
-Paragraph 12
-Publisher FASB
-URI https://asc.fasb.org//1943274/2147480167/946-830-55-12
Reference 2: http://www.xbrl.org/2003/role/disclosureRef
-Topic 946
-SubTopic 210
-Name Accounting Standards Codification
-Section S99
-Paragraph 1
-Subparagraph (SX 210.6-04(12)(b)(2))
-Publisher FASB
-URI https://asc.fasb.org//1943274/2147479617/946-210-S99-1
Reference 3: http://www.xbrl.org/2003/role/disclosureRef
-Topic 946
-SubTopic 210
-Name Accounting Standards Codification
-Section S99
-Paragraph 1
-Subparagraph (SX 210.6-04(12)(b)(3))
-Publisher FASB
-URI https://asc.fasb.org//1943274/2147479617/946-210-S99-1
Reference 4: http://www.xbrl.org/2003/role/disclosureRef
-Topic 944
-SubTopic 210
-Name Accounting Standards Codification
-Section S99
-Paragraph 1
-Subparagraph (SX 210.7-03(15))
-Publisher FASB
-URI https://asc.fasb.org//1943274/2147479440/944-210-S99-1
Reference 5: http://www.xbrl.org/2009/role/commonPracticeRef
-Topic 946
-SubTopic 210
-Name Accounting Standards Codification
-Section S99
-Paragraph 1
-Subparagraph (SX 210.6-04(12)(b)(1))
-Publisher FASB
-URI https://asc.fasb.org//1943274/2147479617/946-210-S99-1
Reference 6: http://fasb.org/us-gaap/role/ref/legacyRef
-Name Accounting Standards Codification
-Topic 942
-SubTopic 210
-Section S99
-Paragraph 1
-Subparagraph (SX 210.9-03.15)
-Publisher FASB
-URI https://asc.fasb.org//1943274/2147479853/942-210-S99-1
| Name: |
us-gaap_OtherLiabilities |
| Namespace Prefix: |
us-gaap_ |
| Data Type: |
xbrli:monetaryItemType |
| Balance Type: |
credit |
| Period Type: |
instant |
|
v3.23.3
SCHEDULE OF LOSS BEFORE INCOME TAX (Details) - USD ($)
|
12 Months Ended |
Jul. 31, 2023 |
Jul. 31, 2022 |
| Local |
$ (53,650)
|
$ (52,675)
|
| Loss before income tax |
(68,827)
|
(357,333)
|
| SEYCHELLES |
|
|
| Foreign |
(1,600)
|
(2,101)
|
| HONG KONG |
|
|
| Foreign |
13,363
|
(97,033)
|
| CHINA |
|
|
| Foreign |
$ (26,940)
|
$ (205,524)
|
| X |
- Details
| Name: |
srt_StatementGeographicalAxis=country_SC |
| Namespace Prefix: |
|
| Data Type: |
na |
| Balance Type: |
|
| Period Type: |
|
|
| X |
- Details
| Name: |
srt_StatementGeographicalAxis=country_HK |
| Namespace Prefix: |
|
| Data Type: |
na |
| Balance Type: |
|
| Period Type: |
|
|
| X |
- Details
| Name: |
srt_StatementGeographicalAxis=country_CN |
| Namespace Prefix: |
|
| Data Type: |
na |
| Balance Type: |
|
| Period Type: |
|
|
v3.23.3
| X |
- DefinitionAmount of current federal, state, and local tax expense (benefit) attributable to income (loss) from continuing operations. Includes, but is not limited to, current national, regional, territorial, and provincial tax expense (benefit) for non-US (United States of America) jurisdiction. Reference 1: http://www.xbrl.org/2009/role/commonPracticeRef
-Name Accounting Standards Codification
-Section 50
-Paragraph 9
-Subparagraph (a)
-SubTopic 10
-Topic 740
-Publisher FASB
-URI https://asc.fasb.org//1943274/2147482685/740-10-50-9
| Name: |
us-gaap_CurrentFederalStateAndLocalTaxExpenseBenefit |
| Namespace Prefix: |
us-gaap_ |
| Data Type: |
xbrli:monetaryItemType |
| Balance Type: |
debit |
| Period Type: |
duration |
|
| X |
- DefinitionAmount of current foreign income tax expense (benefit) pertaining to income (loss) from continuing operations. Reference 1: http://www.xbrl.org/2009/role/commonPracticeRef
-Topic 235
-SubTopic 10
-Name Accounting Standards Codification
-Section S99
-Paragraph 1
-Subparagraph (SX 210.4-08(h)(1)(Note 1))
-Publisher FASB
-URI https://asc.fasb.org//1943274/2147480678/235-10-S99-1
Reference 2: http://www.xbrl.org/2009/role/commonPracticeRef
-Name Accounting Standards Codification
-Section 50
-Paragraph 9
-Subparagraph (a)
-SubTopic 10
-Topic 740
-Publisher FASB
-URI https://asc.fasb.org//1943274/2147482685/740-10-50-9
| Name: |
us-gaap_CurrentForeignTaxExpenseBenefit |
| Namespace Prefix: |
us-gaap_ |
| Data Type: |
xbrli:monetaryItemType |
| Balance Type: |
debit |
| Period Type: |
duration |
|
| X |
- DefinitionAmount of deferred federal, state, and local tax expense (benefit) attributable to income (loss) from continuing operations. Includes, but is not limited to, deferred national, regional, territorial, and provincial tax expense (benefit) for non-US (United States of America) jurisdiction. Reference 1: http://www.xbrl.org/2009/role/commonPracticeRef
-Topic 740
-SubTopic 10
-Name Accounting Standards Codification
-Section 50
-Paragraph 10
-Publisher FASB
-URI https://asc.fasb.org//1943274/2147482685/740-10-50-10
| Name: |
us-gaap_DeferredFederalStateAndLocalTaxExpenseBenefit |
| Namespace Prefix: |
us-gaap_ |
| Data Type: |
xbrli:monetaryItemType |
| Balance Type: |
debit |
| Period Type: |
duration |
|
v3.23.3
| X |
- DefinitionFuture taxable income percentage.
| Name: |
MUGH_FutureTaxableIncomePercentage |
| Namespace Prefix: |
MUGH_ |
| Data Type: |
dtr-types:percentItemType |
| Balance Type: |
na |
| Period Type: |
instant |
|
| X |
- DefinitionAmount of deferred tax assets for which it is more likely than not that a tax benefit will not be realized. Reference 1: http://www.xbrl.org/2003/role/disclosureRef
-Topic 740
-SubTopic 10
-Name Accounting Standards Codification
-Section 50
-Paragraph 2
-Subparagraph (c)
-Publisher FASB
-URI https://asc.fasb.org//1943274/2147482685/740-10-50-2
| Name: |
us-gaap_DeferredTaxAssetsValuationAllowance |
| Namespace Prefix: |
us-gaap_ |
| Data Type: |
xbrli:monetaryItemType |
| Balance Type: |
credit |
| Period Type: |
instant |
|
| X |
- DefinitionAmount of operating loss carryforward, before tax effects, available to reduce future taxable income under enacted tax laws. Reference 1: http://fasb.org/us-gaap/role/ref/legacyRef
-Name Accounting Standards Codification
-Topic 740
-SubTopic 10
-Section 50
-Paragraph 3
-Subparagraph (a)
-Publisher FASB
-URI https://asc.fasb.org//1943274/2147482685/740-10-50-3
| Name: |
us-gaap_OperatingLossCarryforwards |
| Namespace Prefix: |
us-gaap_ |
| Data Type: |
xbrli:monetaryItemType |
| Balance Type: |
debit |
| Period Type: |
instant |
|
| X |
- DefinitionLine items represent financial concepts included in a table. These concepts are used to disclose reportable information associated with domain members defined in one or many axes to the table.
| Name: |
us-gaap_OperatingLossCarryforwardsLineItems |
| Namespace Prefix: |
us-gaap_ |
| Data Type: |
xbrli:stringItemType |
| Balance Type: |
na |
| Period Type: |
duration |
|
v3.23.3
SCHEDULE OF CONCENTRATION OF RISK (Details) - USD ($)
|
12 Months Ended |
Jul. 31, 2023 |
Jul. 31, 2022 |
| Concentration Risk [Line Items] |
|
|
| Revenue |
$ 146,252
|
$ 46,702
|
| Customer A [Member] | Revenue Benchmark [Member] | Customer Concentration Risk [Member] |
|
|
| Concentration Risk [Line Items] |
|
|
| Revenue |
|
$ 37,062
|
| Percentage of revenue |
|
79.00%
|
| Customer A [Member] | Accounts Receivable [Member] | Customer Concentration Risk [Member] |
|
|
| Concentration Risk [Line Items] |
|
|
| Trade receivable |
|
|
| Customer B [Member] | Revenue Benchmark [Member] | Customer Concentration Risk [Member] |
|
|
| Concentration Risk [Line Items] |
|
|
| Revenue |
$ 120,938
|
|
| Percentage of revenue |
83.00%
|
|
| Customer B [Member] | Accounts Receivable [Member] | Customer Concentration Risk [Member] |
|
|
| Concentration Risk [Line Items] |
|
|
| Trade receivable |
|
|
| Customer C [Member] | Revenue Benchmark [Member] | Customer Concentration Risk [Member] |
|
|
| Concentration Risk [Line Items] |
|
|
| Revenue |
$ 17,171
|
|
| Percentage of revenue |
12.00%
|
|
| Customer C [Member] | Accounts Receivable [Member] | Customer Concentration Risk [Member] |
|
|
| Concentration Risk [Line Items] |
|
|
| Trade receivable |
|
|
| Customers [Member] | Revenue Benchmark [Member] | Customer Concentration Risk [Member] |
|
|
| Concentration Risk [Line Items] |
|
|
| Revenue |
$ 138,109
|
$ 37,062
|
| Percentage of revenue |
95.00%
|
79.00%
|
| Customers [Member] | Accounts Receivable [Member] | Customer Concentration Risk [Member] |
|
|
| Concentration Risk [Line Items] |
|
|
| Trade receivable |
|
|
| Vendor A [Member] | Purchases [Member] | Vendor Concentration Risk [Member] |
|
|
| Concentration Risk [Line Items] |
|
|
| Percentage of revenue |
100.00%
|
|
| Purchases |
$ 108,844
|
|
| Vendor A [Member] | Accounts Payable [Member] | Vendor Concentration Risk [Member] |
|
|
| Concentration Risk [Line Items] |
|
|
| Trade receivable |
|
|
| Vendor [Member] | Purchases [Member] | Vendor Concentration Risk [Member] |
|
|
| Concentration Risk [Line Items] |
|
|
| Percentage of revenue |
100.00%
|
|
| Purchases |
$ 108,844
|
|
| Vendor [Member] | Accounts Payable [Member] | Vendor Concentration Risk [Member] |
|
|
| Concentration Risk [Line Items] |
|
|
| Trade receivable |
|
|
| X |
- DefinitionCarrying value as of the balance sheet date of obligations incurred (and for which invoices have typically been received) and payable to vendors for goods and services received that are used in an entity's business. Reference 1: http://fasb.org/us-gaap/role/ref/legacyRef
-Name Accounting Standards Codification
-Topic 942
-SubTopic 210
-Section S99
-Paragraph 1
-Subparagraph (SX 210.9-03.15(5))
-Publisher FASB
-URI https://asc.fasb.org//1943274/2147479853/942-210-S99-1
| Name: |
us-gaap_AccountsPayableTradeCurrentAndNoncurrent |
| Namespace Prefix: |
us-gaap_ |
| Data Type: |
xbrli:monetaryItemType |
| Balance Type: |
credit |
| Period Type: |
instant |
|
| X |
- DefinitionAmount, after allowance for credit loss, of right to consideration from customer for product sold and service rendered in normal course of business, classified as current. Reference 1: http://www.xbrl.org/2003/role/disclosureRef
-Topic 310
-SubTopic 10
-Name Accounting Standards Codification
-Section 45
-Paragraph 2
-Publisher FASB
-URI https://asc.fasb.org//1943274/2147481990/310-10-45-2
Reference 2: http://www.xbrl.org/2003/role/disclosureRef
-Topic 310
-SubTopic 10
-Name Accounting Standards Codification
-Section 45
-Paragraph 9
-Publisher FASB
-URI https://asc.fasb.org//1943274/2147481990/310-10-45-9
| Name: |
us-gaap_AccountsReceivableNetCurrent |
| Namespace Prefix: |
us-gaap_ |
| Data Type: |
xbrli:monetaryItemType |
| Balance Type: |
debit |
| Period Type: |
instant |
|
| X |
- DefinitionLine items represent financial concepts included in a table. These concepts are used to disclose reportable information associated with domain members defined in one or many axes to the table. Reference 1: http://www.xbrl.org/2003/role/disclosureRef
-Topic 954
-SubTopic 310
-Name Accounting Standards Codification
-Section 50
-Paragraph 2
-Publisher FASB
-URI https://asc.fasb.org//1943274/2147481027/954-310-50-2
| Name: |
us-gaap_ConcentrationRiskLineItems |
| Namespace Prefix: |
us-gaap_ |
| Data Type: |
xbrli:stringItemType |
| Balance Type: |
na |
| Period Type: |
duration |
|
| X |
- DefinitionFor an entity that discloses a concentration risk in relation to quantitative amount, which serves as the "benchmark" (or denominator) in the equation, this concept represents the concentration percentage derived from the division. Reference 1: http://www.xbrl.org/2003/role/disclosureRef
-Topic 280
-SubTopic 10
-Name Accounting Standards Codification
-Section 50
-Paragraph 42
-Publisher FASB
-URI https://asc.fasb.org//1943274/2147482810/280-10-50-42
Reference 2: http://fasb.org/us-gaap/role/ref/legacyRef
-Name Accounting Standards Codification
-Topic 825
-SubTopic 10
-Section 50
-Paragraph 21
-Subparagraph (a)
-Publisher FASB
-URI https://asc.fasb.org//1943274/2147482907/825-10-50-21
Reference 3: http://fasb.org/us-gaap/role/ref/legacyRef
-Name Accounting Standards Codification
-Topic 825
-SubTopic 10
-Section 50
-Paragraph 20
-Publisher FASB
-URI https://asc.fasb.org//1943274/2147482907/825-10-50-20
Reference 4: http://fasb.org/us-gaap/role/ref/legacyRef
-Name Accounting Standards Codification
-Topic 275
-SubTopic 10
-Section 50
-Paragraph 18
-Publisher FASB
-URI https://asc.fasb.org//1943274/2147482861/275-10-50-18
Reference 5: http://fasb.org/us-gaap/role/ref/legacyRef
-Name Accounting Standards Codification
-Topic 275
-SubTopic 10
-Section 50
-Paragraph 20
-Publisher FASB
-URI https://asc.fasb.org//1943274/2147482861/275-10-50-20
| Name: |
us-gaap_ConcentrationRiskPercentage1 |
| Namespace Prefix: |
us-gaap_ |
| Data Type: |
dtr-types:percentItemType |
| Balance Type: |
na |
| Period Type: |
duration |
|
| X |
- DefinitionAmount of increase from purchase of right to consideration in exchange for good or service transferred to customer when right is conditioned on passage of time. Reference 1: http://www.xbrl.org/2003/role/disclosureRef
-Topic 326
-SubTopic 20
-Name Accounting Standards Codification
-Section 50
-Paragraph 11
-Subparagraph (h)
-Publisher FASB
-URI https://asc.fasb.org//1943274/2147479319/326-20-50-11
| Name: |
us-gaap_ContractWithCustomerAssetPurchase |
| Namespace Prefix: |
us-gaap_ |
| Data Type: |
xbrli:monetaryItemType |
| Balance Type: |
debit |
| Period Type: |
duration |
|
| X |
- DefinitionAmount, excluding tax collected from customer, of revenue from satisfaction of performance obligation by transferring promised good or service to customer. Tax collected from customer is tax assessed by governmental authority that is both imposed on and concurrent with specific revenue-producing transaction, including, but not limited to, sales, use, value added and excise. Reference 1: http://www.xbrl.org/2003/role/disclosureRef
-Topic 924
-SubTopic 10
-Name Accounting Standards Codification
-Section S99
-Paragraph 1
-Subparagraph (SAB Topic 11.L)
-Publisher FASB
-URI https://asc.fasb.org//1943274/2147479941/924-10-S99-1
Reference 2: http://www.xbrl.org/2003/role/disclosureRef
-Topic 606
-SubTopic 10
-Name Accounting Standards Codification
-Section 50
-Paragraph 5
-Publisher FASB
-URI https://asc.fasb.org//1943274/2147479806/606-10-50-5
Reference 3: http://www.xbrl.org/2003/role/disclosureRef
-Topic 280
-SubTopic 10
-Name Accounting Standards Codification
-Section 50
-Paragraph 30
-Subparagraph (a)
-Publisher FASB
-URI https://asc.fasb.org//1943274/2147482810/280-10-50-30
Reference 4: http://www.xbrl.org/2003/role/disclosureRef
-Topic 280
-SubTopic 10
-Name Accounting Standards Codification
-Section 50
-Paragraph 42
-Publisher FASB
-URI https://asc.fasb.org//1943274/2147482810/280-10-50-42
Reference 5: http://www.xbrl.org/2003/role/disclosureRef
-Topic 280
-SubTopic 10
-Name Accounting Standards Codification
-Section 50
-Paragraph 22
-Subparagraph (b)
-Publisher FASB
-URI https://asc.fasb.org//1943274/2147482810/280-10-50-22
Reference 6: http://www.xbrl.org/2003/role/disclosureRef
-Topic 280
-SubTopic 10
-Name Accounting Standards Codification
-Section 50
-Paragraph 32
-Subparagraph (b)
-Publisher FASB
-URI https://asc.fasb.org//1943274/2147482810/280-10-50-32
Reference 7: http://www.xbrl.org/2003/role/disclosureRef
-Topic 280
-SubTopic 10
-Name Accounting Standards Codification
-Section 50
-Paragraph 40
-Publisher FASB
-URI https://asc.fasb.org//1943274/2147482810/280-10-50-40
Reference 8: http://www.xbrl.org/2003/role/disclosureRef
-Topic 280
-SubTopic 10
-Name Accounting Standards Codification
-Section 50
-Paragraph 22
-Subparagraph (a)
-Publisher FASB
-URI https://asc.fasb.org//1943274/2147482810/280-10-50-22
Reference 9: http://www.xbrl.org/2003/role/disclosureRef
-Topic 280
-SubTopic 10
-Name Accounting Standards Codification
-Section 50
-Paragraph 32
-Subparagraph (a)
-Publisher FASB
-URI https://asc.fasb.org//1943274/2147482810/280-10-50-32
Reference 10: http://www.xbrl.org/2003/role/disclosureRef
-Topic 280
-SubTopic 10
-Name Accounting Standards Codification
-Section 50
-Paragraph 41
-Subparagraph (a)
-Publisher FASB
-URI https://asc.fasb.org//1943274/2147482810/280-10-50-41
Reference 11: http://www.xbrl.org/2003/role/disclosureRef
-Topic 606
-SubTopic 10
-Name Accounting Standards Codification
-Section 50
-Paragraph 4
-Subparagraph (a)
-Publisher FASB
-URI https://asc.fasb.org//1943274/2147479806/606-10-50-4
| Name: |
us-gaap_RevenueFromContractWithCustomerExcludingAssessedTax |
| Namespace Prefix: |
us-gaap_ |
| Data Type: |
xbrli:monetaryItemType |
| Balance Type: |
credit |
| Period Type: |
duration |
|
| X |
- Details
| Name: |
srt_MajorCustomersAxis=MUGH_CustomerAMember |
| Namespace Prefix: |
|
| Data Type: |
na |
| Balance Type: |
|
| Period Type: |
|
|
| X |
- Details
| Name: |
us-gaap_ConcentrationRiskByBenchmarkAxis=us-gaap_SalesRevenueNetMember |
| Namespace Prefix: |
|
| Data Type: |
na |
| Balance Type: |
|
| Period Type: |
|
|
| X |
- Details
| Name: |
us-gaap_ConcentrationRiskByTypeAxis=us-gaap_CustomerConcentrationRiskMember |
| Namespace Prefix: |
|
| Data Type: |
na |
| Balance Type: |
|
| Period Type: |
|
|
| X |
- Details
| Name: |
us-gaap_ConcentrationRiskByBenchmarkAxis=us-gaap_AccountsReceivableMember |
| Namespace Prefix: |
|
| Data Type: |
na |
| Balance Type: |
|
| Period Type: |
|
|
| X |
- Details
| Name: |
srt_MajorCustomersAxis=MUGH_CustomerBMember |
| Namespace Prefix: |
|
| Data Type: |
na |
| Balance Type: |
|
| Period Type: |
|
|
| X |
- Details
| Name: |
srt_MajorCustomersAxis=MUGH_CustomerCMember |
| Namespace Prefix: |
|
| Data Type: |
na |
| Balance Type: |
|
| Period Type: |
|
|
| X |
- Details
| Name: |
srt_MajorCustomersAxis=MUGH_CustomersMember |
| Namespace Prefix: |
|
| Data Type: |
na |
| Balance Type: |
|
| Period Type: |
|
|
| X |
- Details
| Name: |
srt_MajorCustomersAxis=MUGH_VendorAMember |
| Namespace Prefix: |
|
| Data Type: |
na |
| Balance Type: |
|
| Period Type: |
|
|
| X |
- Details
| Name: |
us-gaap_ConcentrationRiskByBenchmarkAxis=MUGH_PurchasesMember |
| Namespace Prefix: |
|
| Data Type: |
na |
| Balance Type: |
|
| Period Type: |
|
|
| X |
- Details
| Name: |
us-gaap_ConcentrationRiskByTypeAxis=MUGH_VendorConcentrationRiskMember |
| Namespace Prefix: |
|
| Data Type: |
na |
| Balance Type: |
|
| Period Type: |
|
|
| X |
- Details
| Name: |
us-gaap_ConcentrationRiskByBenchmarkAxis=us-gaap_AccountsPayableMember |
| Namespace Prefix: |
|
| Data Type: |
na |
| Balance Type: |
|
| Period Type: |
|
|
| X |
- Details
| Name: |
srt_MajorCustomersAxis=MUGH_VendorMember |
| Namespace Prefix: |
|
| Data Type: |
na |
| Balance Type: |
|
| Period Type: |
|
|
v3.23.3
| X |
- DefinitionLine items represent financial concepts included in a table. These concepts are used to disclose reportable information associated with domain members defined in one or many axes to the table. Reference 1: http://www.xbrl.org/2003/role/disclosureRef
-Topic 954
-SubTopic 310
-Name Accounting Standards Codification
-Section 50
-Paragraph 2
-Publisher FASB
-URI https://asc.fasb.org//1943274/2147481027/954-310-50-2
| Name: |
us-gaap_ConcentrationRiskLineItems |
| Namespace Prefix: |
us-gaap_ |
| Data Type: |
xbrli:stringItemType |
| Balance Type: |
na |
| Period Type: |
duration |
|
| X |
- DefinitionFor an entity that discloses a concentration risk in relation to quantitative amount, which serves as the "benchmark" (or denominator) in the equation, this concept represents the concentration percentage derived from the division. Reference 1: http://www.xbrl.org/2003/role/disclosureRef
-Topic 280
-SubTopic 10
-Name Accounting Standards Codification
-Section 50
-Paragraph 42
-Publisher FASB
-URI https://asc.fasb.org//1943274/2147482810/280-10-50-42
Reference 2: http://fasb.org/us-gaap/role/ref/legacyRef
-Name Accounting Standards Codification
-Topic 825
-SubTopic 10
-Section 50
-Paragraph 21
-Subparagraph (a)
-Publisher FASB
-URI https://asc.fasb.org//1943274/2147482907/825-10-50-21
Reference 3: http://fasb.org/us-gaap/role/ref/legacyRef
-Name Accounting Standards Codification
-Topic 825
-SubTopic 10
-Section 50
-Paragraph 20
-Publisher FASB
-URI https://asc.fasb.org//1943274/2147482907/825-10-50-20
Reference 4: http://fasb.org/us-gaap/role/ref/legacyRef
-Name Accounting Standards Codification
-Topic 275
-SubTopic 10
-Section 50
-Paragraph 18
-Publisher FASB
-URI https://asc.fasb.org//1943274/2147482861/275-10-50-18
Reference 5: http://fasb.org/us-gaap/role/ref/legacyRef
-Name Accounting Standards Codification
-Topic 275
-SubTopic 10
-Section 50
-Paragraph 20
-Publisher FASB
-URI https://asc.fasb.org//1943274/2147482861/275-10-50-20
| Name: |
us-gaap_ConcentrationRiskPercentage1 |
| Namespace Prefix: |
us-gaap_ |
| Data Type: |
dtr-types:percentItemType |
| Balance Type: |
na |
| Period Type: |
duration |
|
| X |
- Details
| Name: |
us-gaap_ShareBasedGoodsAndNonemployeeServicesTransactionBySupplierAxis=MUGH_CustomerMember |
| Namespace Prefix: |
|
| Data Type: |
na |
| Balance Type: |
|
| Period Type: |
|
|
| X |
- Details
| Name: |
us-gaap_ConcentrationRiskByBenchmarkAxis=us-gaap_PropertyPlantAndEquipmentMember |
| Namespace Prefix: |
|
| Data Type: |
na |
| Balance Type: |
|
| Period Type: |
|
|
| X |
- Details
| Name: |
us-gaap_ConcentrationRiskByTypeAxis=us-gaap_CustomerConcentrationRiskMember |
| Namespace Prefix: |
|
| Data Type: |
na |
| Balance Type: |
|
| Period Type: |
|
|
v3.23.3
| X |
- DefinitionMinimum rent payments due.
| Name: |
MUGH_MinimumRentPaymentsDue |
| Namespace Prefix: |
MUGH_ |
| Data Type: |
xbrli:monetaryItemType |
| Balance Type: |
credit |
| Period Type: |
instant |
|
| X |
- DefinitionMinimum rent payments due in next twelve months.
| Name: |
MUGH_MinimumRentPaymentsDueInNextTwelveMonths |
| Namespace Prefix: |
MUGH_ |
| Data Type: |
xbrli:monetaryItemType |
| Balance Type: |
credit |
| Period Type: |
instant |
|
| X |
- DefinitionMinimum Rent payments due in year two.
| Name: |
MUGH_MinimumRentPaymentsDueInYearTwo |
| Namespace Prefix: |
MUGH_ |
| Data Type: |
xbrli:monetaryItemType |
| Balance Type: |
credit |
| Period Type: |
instant |
|
| X |
- References
+ Details
| Name: |
us-gaap_CommitmentsAndContingenciesDisclosureAbstract |
| Namespace Prefix: |
us-gaap_ |
| Data Type: |
xbrli:stringItemType |
| Balance Type: |
na |
| Period Type: |
duration |
|
v3.23.3
COMMITMENTS AND CONTINGENCIES (Details Narrative) - CNY (¥)
|
Oct. 18, 2022 |
Nov. 06, 2021 |
| Collaborative Arrangement and Arrangement Other than Collaborative [Line Items] |
|
|
| Rent payment |
¥ 3,500
|
¥ 3,500
|
| Rental Agreement [Member] |
|
|
| Collaborative Arrangement and Arrangement Other than Collaborative [Line Items] |
|
|
| Lessee, operating lease, description |
|
On
November 6, 2021, the Company entered into a contract rental agreement to rent the office in Shanghai for a period of one
year commencing on November 6, 2021
|
| Lessee, operating lease, term of contract |
|
1 year
|
| X |
- DefinitionLine items represent financial concepts included in a table. These concepts are used to disclose reportable information associated with domain members defined in one or many axes to the table. Reference 1: http://www.xbrl.org/2003/role/disclosureRef
-Topic 808
-SubTopic 10
-Name Accounting Standards Codification
-Section 50
-Paragraph 1
-Subparagraph (d)
-Publisher FASB
-URI https://asc.fasb.org//1943274/2147479402/808-10-50-1
| Name: |
us-gaap_CollaborativeArrangementsAndNoncollaborativeArrangementTransactionsLineItems |
| Namespace Prefix: |
us-gaap_ |
| Data Type: |
xbrli:stringItemType |
| Balance Type: |
na |
| Period Type: |
duration |
|
| X |
- DefinitionDescription of lessee's operating lease. Reference 1: http://www.xbrl.org/2003/role/disclosureRef
-Topic 842
-SubTopic 20
-Name Accounting Standards Codification
-Section 50
-Paragraph 3
-Subparagraph (a)(1)
-Publisher FASB
-URI https://asc.fasb.org//1943274/2147478964/842-20-50-3
| Name: |
us-gaap_LesseeOperatingLeaseDescription |
| Namespace Prefix: |
us-gaap_ |
| Data Type: |
xbrli:stringItemType |
| Balance Type: |
na |
| Period Type: |
duration |
|
| X |
- DefinitionTerm of lessee's operating lease, in 'PnYnMnDTnHnMnS' format, for example, 'P1Y5M13D' represents reported fact of one year, five months, and thirteen days. Reference 1: http://www.xbrl.org/2009/role/commonPracticeRef
-Topic 842
-SubTopic 20
-Name Accounting Standards Codification
-Section 50
-Paragraph 3
-Subparagraph (a)(3)
-Publisher FASB
-URI https://asc.fasb.org//1943274/2147478964/842-20-50-3
| Name: |
us-gaap_LesseeOperatingLeaseTermOfContract |
| Namespace Prefix: |
us-gaap_ |
| Data Type: |
xbrli:durationItemType |
| Balance Type: |
na |
| Period Type: |
instant |
|
| X |
- DefinitionCash payments to lessor's for use of assets under operating leases. Reference 1: http://fasb.org/us-gaap/role/ref/legacyRef
-Name Accounting Standards Codification
-Section 45
-Paragraph 25
-Subparagraph (g)
-SubTopic 10
-Topic 230
-Publisher FASB
-URI https://asc.fasb.org//1943274/2147482740/230-10-45-25
| Name: |
us-gaap_PaymentsForRent |
| Namespace Prefix: |
us-gaap_ |
| Data Type: |
xbrli:monetaryItemType |
| Balance Type: |
credit |
| Period Type: |
duration |
|
| X |
- Details
| Name: |
us-gaap_TypeOfArrangementAxis=MUGH_RentalAgreementMember |
| Namespace Prefix: |
|
| Data Type: |
na |
| Balance Type: |
|
| Period Type: |
|
|
v3.23.3
| X |
- DefinitionA fee charged for services from professionals such as doctors, lawyers and accountants. The term is often expanded to include other professions, for example, pharmacists charging to maintain a medicinal profile of a client or customer. Reference 1: http://www.xbrl.org/2003/role/exampleRef
-Topic 946
-SubTopic 830
-Name Accounting Standards Codification
-Section 55
-Paragraph 10
-Publisher FASB
-URI https://asc.fasb.org//1943274/2147480167/946-830-55-10
Reference 2: http://www.xbrl.org/2009/role/commonPracticeRef
-Topic 946
-SubTopic 220
-Name Accounting Standards Codification
-Section 45
-Paragraph 3
-Subparagraph (k)
-Publisher FASB
-URI https://asc.fasb.org//1943274/2147483581/946-220-45-3
Reference 3: http://www.xbrl.org/2009/role/commonPracticeRef
-Topic 946
-SubTopic 220
-Name Accounting Standards Codification
-Section S99
-Paragraph 1
-Subparagraph (SX 210.6-07(2)(b))
-Publisher FASB
-URI https://asc.fasb.org//1943274/2147483575/946-220-S99-1
| Name: |
us-gaap_ProfessionalFees |
| Namespace Prefix: |
us-gaap_ |
| Data Type: |
xbrli:monetaryItemType |
| Balance Type: |
debit |
| Period Type: |
duration |
|
v3.23.3
SCHEDULE OF SEGMENT REPORTING INFORMATION (Details) - USD ($)
|
12 Months Ended |
Jul. 31, 2023 |
Jul. 31, 2022 |
| Segment Reporting Information [Line Items] |
|
|
| Revenue |
$ 146,252
|
$ 46,702
|
| Cost of revenue |
(123,088)
|
(21,891)
|
| Selling and marketing expenses |
(1,531)
|
(3,470)
|
| General and administrative expenses |
(163,311)
|
(428,710)
|
| Net loss before taxation |
(68,827)
|
(357,333)
|
| Total assets |
23,541
|
82,048
|
| Corporate Segment [Member] |
|
|
| Segment Reporting Information [Line Items] |
|
|
| Revenue |
146,252
|
46,702
|
| Cost of revenue |
(123,088)
|
(21,891)
|
| Other income |
72,851
|
50,036
|
| Selling and marketing expenses |
(1,531)
|
(3,470)
|
| General and administrative expenses |
(163,311)
|
(428,710)
|
| Net loss before taxation |
(68,827)
|
(357,333)
|
| Total assets |
23,541
|
82,048
|
| Corporate Segment [Member] | NV [Member] |
|
|
| Segment Reporting Information [Line Items] |
|
|
| Revenue |
|
|
| Cost of revenue |
|
|
| Other income |
|
|
| Selling and marketing expenses |
|
|
| General and administrative expenses |
(53,650)
|
(52,675)
|
| Net loss before taxation |
(53,650)
|
(52,675)
|
| Total assets |
3,150
|
3,075
|
| Corporate Segment [Member] | SEYCHELLES |
|
|
| Segment Reporting Information [Line Items] |
|
|
| Revenue |
|
|
| Cost of revenue |
|
|
| Other income |
|
|
| Selling and marketing expenses |
|
(13)
|
| General and administrative expenses |
(1,600)
|
(2,088)
|
| Net loss before taxation |
(1,600)
|
(2,101)
|
| Total assets |
1
|
1
|
| Corporate Segment [Member] | HONG KONG |
|
|
| Segment Reporting Information [Line Items] |
|
|
| Revenue |
120,938
|
|
| Cost of revenue |
(108,844)
|
|
| Other income |
14,038
|
27,781
|
| Selling and marketing expenses |
(200)
|
(103)
|
| General and administrative expenses |
(12,569)
|
(124,711)
|
| Net loss before taxation |
13,363
|
(97,033)
|
| Total assets |
8,254
|
15,551
|
| Corporate Segment [Member] | CHINA |
|
|
| Segment Reporting Information [Line Items] |
|
|
| Revenue |
25,314
|
46,702
|
| Cost of revenue |
(14,244)
|
(21,891)
|
| Other income |
58,813
|
22,255
|
| Selling and marketing expenses |
(1,331)
|
(3,354)
|
| General and administrative expenses |
(95,492)
|
(249,236)
|
| Net loss before taxation |
(26,940)
|
(205,524)
|
| Total assets |
$ 12,136
|
$ 63,421
|
| X |
- DefinitionSum of the carrying amounts as of the balance sheet date of all assets that are recognized. Assets are probable future economic benefits obtained or controlled by an entity as a result of past transactions or events. Reference 1: http://www.xbrl.org/2003/role/disclosureRef
-Topic 810
-SubTopic 10
-Name Accounting Standards Codification
-Section 50
-Paragraph 3
-Subparagraph (bb)
-Publisher FASB
-URI https://asc.fasb.org//1943274/2147481203/810-10-50-3
Reference 2: http://www.xbrl.org/2003/role/disclosureRef
-Topic 810
-SubTopic 10
-Name Accounting Standards Codification
-Section 45
-Paragraph 25
-Subparagraph (a)
-Publisher FASB
-URI https://asc.fasb.org//1943274/2147481231/810-10-45-25
Reference 3: http://www.xbrl.org/2003/role/disclosureRef
-Topic 235
-SubTopic 10
-Name Accounting Standards Codification
-Section S99
-Paragraph 1
-Subparagraph (SX 210.4-08(g)(1)(ii))
-Publisher FASB
-URI https://asc.fasb.org//1943274/2147480678/235-10-S99-1
Reference 4: http://www.xbrl.org/2003/role/disclosureRef
-Topic 323
-SubTopic 10
-Name Accounting Standards Codification
-Section 50
-Paragraph 3
-Subparagraph (c)
-Publisher FASB
-URI https://asc.fasb.org//1943274/2147481687/323-10-50-3
Reference 5: http://www.xbrl.org/2003/role/disclosureRef
-Topic 825
-SubTopic 10
-Name Accounting Standards Codification
-Section 50
-Paragraph 28
-Subparagraph (f)
-Publisher FASB
-URI https://asc.fasb.org//1943274/2147482907/825-10-50-28
Reference 6: http://www.xbrl.org/2003/role/exampleRef
-Topic 852
-SubTopic 10
-Name Accounting Standards Codification
-Section 55
-Paragraph 10
-Publisher FASB
-URI https://asc.fasb.org//1943274/2147481372/852-10-55-10
Reference 7: http://www.xbrl.org/2003/role/exampleRef
-Topic 946
-SubTopic 830
-Name Accounting Standards Codification
-Section 55
-Paragraph 12
-Publisher FASB
-URI https://asc.fasb.org//1943274/2147480167/946-830-55-12
Reference 8: http://www.xbrl.org/2003/role/disclosureRef
-Topic 944
-SubTopic 210
-Name Accounting Standards Codification
-Section S99
-Paragraph 1
-Subparagraph (SX 210.7-03(a)(12))
-Publisher FASB
-URI https://asc.fasb.org//1943274/2147479440/944-210-S99-1
Reference 9: http://www.xbrl.org/2003/role/disclosureRef
-Topic 280
-SubTopic 10
-Name Accounting Standards Codification
-Section 50
-Paragraph 22
-Publisher FASB
-URI https://asc.fasb.org//1943274/2147482810/280-10-50-22
Reference 10: http://www.xbrl.org/2003/role/disclosureRef
-Topic 946
-SubTopic 210
-Name Accounting Standards Codification
-Section S99
-Paragraph 1
-Subparagraph (SX 210.6-04(8))
-Publisher FASB
-URI https://asc.fasb.org//1943274/2147479617/946-210-S99-1
Reference 11: http://www.xbrl.org/2003/role/disclosureRef
-Topic 210
-SubTopic 10
-Name Accounting Standards Codification
-Section S99
-Paragraph 1
-Subparagraph (SX 210.5-02(18))
-Publisher FASB
-URI https://asc.fasb.org//1943274/2147480566/210-10-S99-1
Reference 12: http://www.xbrl.org/2003/role/disclosureRef
-Topic 470
-SubTopic 10
-Name Accounting Standards Codification
-Section S99
-Paragraph 1A
-Subparagraph (SX 210.13-01(a)(4)(i))
-Publisher FASB
-URI https://asc.fasb.org//1943274/2147480097/470-10-S99-1A
Reference 13: http://www.xbrl.org/2009/role/commonPracticeRef
-Topic 470
-SubTopic 10
-Name Accounting Standards Codification
-Section S99
-Paragraph 1A
-Subparagraph (SX 210.13-01(a)(4)(ii))
-Publisher FASB
-URI https://asc.fasb.org//1943274/2147480097/470-10-S99-1A
Reference 14: http://www.xbrl.org/2009/role/commonPracticeRef
-Topic 470
-SubTopic 10
-Name Accounting Standards Codification
-Section S99
-Paragraph 1A
-Subparagraph (SX 210.13-01(a)(4)(iii))
-Publisher FASB
-URI https://asc.fasb.org//1943274/2147480097/470-10-S99-1A
Reference 15: http://www.xbrl.org/2003/role/disclosureRef
-Topic 470
-SubTopic 10
-Name Accounting Standards Codification
-Section S99
-Paragraph 1A
-Subparagraph (SX 210.13-01(a)(4)(iii)(A))
-Publisher FASB
-URI https://asc.fasb.org//1943274/2147480097/470-10-S99-1A
Reference 16: http://www.xbrl.org/2003/role/disclosureRef
-Topic 470
-SubTopic 10
-Name Accounting Standards Codification
-Section S99
-Paragraph 1A
-Subparagraph (SX 210.13-01(a)(4)(iv))
-Publisher FASB
-URI https://asc.fasb.org//1943274/2147480097/470-10-S99-1A
Reference 17: http://www.xbrl.org/2003/role/disclosureRef
-Topic 470
-SubTopic 10
-Name Accounting Standards Codification
-Section S99
-Paragraph 1A
-Subparagraph (SX 210.13-01(a)(5))
-Publisher FASB
-URI https://asc.fasb.org//1943274/2147480097/470-10-S99-1A
Reference 18: http://www.xbrl.org/2003/role/disclosureRef
-Topic 470
-SubTopic 10
-Name Accounting Standards Codification
-Section S99
-Paragraph 1B
-Subparagraph (SX 210.13-02(a)(4)(i))
-Publisher FASB
-URI https://asc.fasb.org//1943274/2147480097/470-10-S99-1B
Reference 19: http://www.xbrl.org/2003/role/disclosureRef
-Topic 470
-SubTopic 10
-Name Accounting Standards Codification
-Section S99
-Paragraph 1B
-Subparagraph (SX 210.13-02(a)(4)(iii)(A))
-Publisher FASB
-URI https://asc.fasb.org//1943274/2147480097/470-10-S99-1B
Reference 20: http://www.xbrl.org/2003/role/disclosureRef
-Topic 470
-SubTopic 10
-Name Accounting Standards Codification
-Section S99
-Paragraph 1B
-Subparagraph (SX 210.13-02(a)(4)(iii)(B))
-Publisher FASB
-URI https://asc.fasb.org//1943274/2147480097/470-10-S99-1B
Reference 21: http://www.xbrl.org/2003/role/disclosureRef
-Topic 470
-SubTopic 10
-Name Accounting Standards Codification
-Section S99
-Paragraph 1B
-Subparagraph (SX 210.13-02(a)(4)(iv))
-Publisher FASB
-URI https://asc.fasb.org//1943274/2147480097/470-10-S99-1B
Reference 22: http://www.xbrl.org/2003/role/disclosureRef
-Topic 470
-SubTopic 10
-Name Accounting Standards Codification
-Section S99
-Paragraph 1B
-Subparagraph (SX 210.13-02(a)(5))
-Publisher FASB
-URI https://asc.fasb.org//1943274/2147480097/470-10-S99-1B
Reference 23: http://www.xbrl.org/2009/role/commonPracticeRef
-Topic 852
-SubTopic 10
-Name Accounting Standards Codification
-Section 50
-Paragraph 7
-Subparagraph (a)
-Publisher FASB
-URI https://asc.fasb.org//1943274/2147481404/852-10-50-7
Reference 24: http://www.xbrl.org/2003/role/disclosureRef
-Topic 280
-SubTopic 10
-Name Accounting Standards Codification
-Section 50
-Paragraph 30
-Subparagraph (c)
-Publisher FASB
-URI https://asc.fasb.org//1943274/2147482810/280-10-50-30
Reference 25: http://www.xbrl.org/2003/role/disclosureRef
-Topic 280
-SubTopic 10
-Name Accounting Standards Codification
-Section 50
-Paragraph 32
-Subparagraph (d)
-Publisher FASB
-URI https://asc.fasb.org//1943274/2147482810/280-10-50-32
Reference 26: http://fasb.org/us-gaap/role/ref/legacyRef
-Topic 942
-SubTopic 210
-Name Accounting Standards Codification
-Section S99
-Paragraph 1
-Subparagraph (SX 210.9-03(11))
-Publisher FASB
-URI https://asc.fasb.org//1943274/2147479853/942-210-S99-1
| Name: |
us-gaap_Assets |
| Namespace Prefix: |
us-gaap_ |
| Data Type: |
xbrli:monetaryItemType |
| Balance Type: |
debit |
| Period Type: |
instant |
|
| X |
- DefinitionThe aggregate cost of goods produced and sold and services rendered during the reporting period. Reference 1: http://www.xbrl.org/2003/role/disclosureRef
-Topic 235
-SubTopic 10
-Name Accounting Standards Codification
-Section S99
-Paragraph 1
-Subparagraph (SX 210.4-08(g)(1)(ii))
-Publisher FASB
-URI https://asc.fasb.org//1943274/2147480678/235-10-S99-1
Reference 2: http://www.xbrl.org/2003/role/disclosureRef
-Topic 323
-SubTopic 10
-Name Accounting Standards Codification
-Section 50
-Paragraph 3
-Subparagraph (c)
-Publisher FASB
-URI https://asc.fasb.org//1943274/2147481687/323-10-50-3
Reference 3: http://www.xbrl.org/2003/role/disclosureRef
-Topic 825
-SubTopic 10
-Name Accounting Standards Codification
-Section 50
-Paragraph 28
-Subparagraph (f)
-Publisher FASB
-URI https://asc.fasb.org//1943274/2147482907/825-10-50-28
Reference 4: http://www.xbrl.org/2003/role/disclosureRef
-Topic 470
-SubTopic 10
-Name Accounting Standards Codification
-Section S99
-Paragraph 1A
-Subparagraph (SX 210.13-01(a)(4)(i))
-Publisher FASB
-URI https://asc.fasb.org//1943274/2147480097/470-10-S99-1A
Reference 5: http://www.xbrl.org/2009/role/commonPracticeRef
-Topic 470
-SubTopic 10
-Name Accounting Standards Codification
-Section S99
-Paragraph 1A
-Subparagraph (SX 210.13-01(a)(4)(ii))
-Publisher FASB
-URI https://asc.fasb.org//1943274/2147480097/470-10-S99-1A
Reference 6: http://www.xbrl.org/2003/role/disclosureRef
-Topic 470
-SubTopic 10
-Name Accounting Standards Codification
-Section S99
-Paragraph 1A
-Subparagraph (SX 210.13-01(a)(4)(iii)(A))
-Publisher FASB
-URI https://asc.fasb.org//1943274/2147480097/470-10-S99-1A
Reference 7: http://www.xbrl.org/2003/role/disclosureRef
-Topic 470
-SubTopic 10
-Name Accounting Standards Codification
-Section S99
-Paragraph 1A
-Subparagraph (SX 210.13-01(a)(4)(iv))
-Publisher FASB
-URI https://asc.fasb.org//1943274/2147480097/470-10-S99-1A
Reference 8: http://www.xbrl.org/2003/role/disclosureRef
-Topic 470
-SubTopic 10
-Name Accounting Standards Codification
-Section S99
-Paragraph 1A
-Subparagraph (SX 210.13-01(a)(5))
-Publisher FASB
-URI https://asc.fasb.org//1943274/2147480097/470-10-S99-1A
Reference 9: http://www.xbrl.org/2003/role/disclosureRef
-Topic 470
-SubTopic 10
-Name Accounting Standards Codification
-Section S99
-Paragraph 1B
-Subparagraph (SX 210.13-02(a)(4)(i))
-Publisher FASB
-URI https://asc.fasb.org//1943274/2147480097/470-10-S99-1B
Reference 10: http://www.xbrl.org/2003/role/disclosureRef
-Topic 470
-SubTopic 10
-Name Accounting Standards Codification
-Section S99
-Paragraph 1B
-Subparagraph (SX 210.13-02(a)(4)(iii)(A))
-Publisher FASB
-URI https://asc.fasb.org//1943274/2147480097/470-10-S99-1B
Reference 11: http://www.xbrl.org/2003/role/disclosureRef
-Topic 470
-SubTopic 10
-Name Accounting Standards Codification
-Section S99
-Paragraph 1B
-Subparagraph (SX 210.13-02(a)(4)(iii)(B))
-Publisher FASB
-URI https://asc.fasb.org//1943274/2147480097/470-10-S99-1B
Reference 12: http://www.xbrl.org/2003/role/disclosureRef
-Topic 470
-SubTopic 10
-Name Accounting Standards Codification
-Section S99
-Paragraph 1B
-Subparagraph (SX 210.13-02(a)(4)(iv))
-Publisher FASB
-URI https://asc.fasb.org//1943274/2147480097/470-10-S99-1B
Reference 13: http://www.xbrl.org/2003/role/disclosureRef
-Topic 470
-SubTopic 10
-Name Accounting Standards Codification
-Section S99
-Paragraph 1B
-Subparagraph (SX 210.13-02(a)(5))
-Publisher FASB
-URI https://asc.fasb.org//1943274/2147480097/470-10-S99-1B
Reference 14: http://fasb.org/us-gaap/role/ref/legacyRef
-Topic 220
-SubTopic 10
-Name Accounting Standards Codification
-Section S99
-Paragraph 2
-Subparagraph (SX 210.5-03.2)
-Publisher FASB
-URI https://asc.fasb.org//1943274/2147483621/220-10-S99-2
| Name: |
us-gaap_CostOfRevenue |
| Namespace Prefix: |
us-gaap_ |
| Data Type: |
xbrli:monetaryItemType |
| Balance Type: |
debit |
| Period Type: |
duration |
|
| X |
- DefinitionThe aggregate total of expenses of managing and administering the affairs of an entity, including affiliates of the reporting entity, which are not directly or indirectly associated with the manufacture, sale or creation of a product or product line. Reference 1: http://www.xbrl.org/2003/role/disclosureRef
-Topic 946
-SubTopic 220
-Name Accounting Standards Codification
-Section S99
-Paragraph 1
-Subparagraph (SX 210.6-07(2)(a))
-Publisher FASB
-URI https://asc.fasb.org//1943274/2147483575/946-220-S99-1
Reference 2: http://fasb.org/us-gaap/role/ref/legacyRef
-Topic 220
-SubTopic 10
-Name Accounting Standards Codification
-Section S99
-Paragraph 2
-Subparagraph (SX 210.5-03.4)
-Publisher FASB
-URI https://asc.fasb.org//1943274/2147483621/220-10-S99-2
| Name: |
us-gaap_GeneralAndAdministrativeExpense |
| Namespace Prefix: |
us-gaap_ |
| Data Type: |
xbrli:monetaryItemType |
| Balance Type: |
debit |
| Period Type: |
duration |
|
| X |
- DefinitionAmount of revenue and income classified as other. Reference 1: http://www.xbrl.org/2003/role/disclosureRef
-Topic 946
-SubTopic 320
-Name Accounting Standards Codification
-Section S99
-Paragraph 6
-Subparagraph (SX 210.12-14(Column E)(2))
-Publisher FASB
-URI https://asc.fasb.org//1943274/2147480032/946-320-S99-6
Reference 2: http://www.xbrl.org/2003/role/disclosureRef
-Topic 946
-SubTopic 320
-Name Accounting Standards Codification
-Section S99
-Paragraph 6
-Subparagraph (SX 210.12-14(Column E)(Footnote 4))
-Publisher FASB
-URI https://asc.fasb.org//1943274/2147480032/946-320-S99-6
Reference 3: http://www.xbrl.org/2003/role/disclosureRef
-Topic 946
-SubTopic 320
-Name Accounting Standards Codification
-Section S99
-Paragraph 6
-Subparagraph (SX 210.12-14(Column E)(Footnote 6)(b))
-Publisher FASB
-URI https://asc.fasb.org//1943274/2147480032/946-320-S99-6
Reference 4: http://www.xbrl.org/2003/role/disclosureRef
-Topic 944
-SubTopic 220
-Name Accounting Standards Codification
-Section S99
-Paragraph 1
-Subparagraph (SX 210.7-04(4))
-Publisher FASB
-URI https://asc.fasb.org//1943274/2147483586/944-220-S99-1
Reference 5: http://www.xbrl.org/2003/role/disclosureRef
-Topic 946
-SubTopic 220
-Name Accounting Standards Codification
-Section S99
-Paragraph 1
-Subparagraph (SX 210.6-07(1)(c))
-Publisher FASB
-URI https://asc.fasb.org//1943274/2147483575/946-220-S99-1
| Name: |
us-gaap_OtherIncome |
| Namespace Prefix: |
us-gaap_ |
| Data Type: |
xbrli:monetaryItemType |
| Balance Type: |
credit |
| Period Type: |
duration |
|
| X |
- DefinitionAmount, excluding tax collected from customer, of revenue from satisfaction of performance obligation by transferring promised good or service to customer. Tax collected from customer is tax assessed by governmental authority that is both imposed on and concurrent with specific revenue-producing transaction, including, but not limited to, sales, use, value added and excise. Reference 1: http://www.xbrl.org/2003/role/disclosureRef
-Topic 924
-SubTopic 10
-Name Accounting Standards Codification
-Section S99
-Paragraph 1
-Subparagraph (SAB Topic 11.L)
-Publisher FASB
-URI https://asc.fasb.org//1943274/2147479941/924-10-S99-1
Reference 2: http://www.xbrl.org/2003/role/disclosureRef
-Topic 606
-SubTopic 10
-Name Accounting Standards Codification
-Section 50
-Paragraph 5
-Publisher FASB
-URI https://asc.fasb.org//1943274/2147479806/606-10-50-5
Reference 3: http://www.xbrl.org/2003/role/disclosureRef
-Topic 280
-SubTopic 10
-Name Accounting Standards Codification
-Section 50
-Paragraph 30
-Subparagraph (a)
-Publisher FASB
-URI https://asc.fasb.org//1943274/2147482810/280-10-50-30
Reference 4: http://www.xbrl.org/2003/role/disclosureRef
-Topic 280
-SubTopic 10
-Name Accounting Standards Codification
-Section 50
-Paragraph 42
-Publisher FASB
-URI https://asc.fasb.org//1943274/2147482810/280-10-50-42
Reference 5: http://www.xbrl.org/2003/role/disclosureRef
-Topic 280
-SubTopic 10
-Name Accounting Standards Codification
-Section 50
-Paragraph 22
-Subparagraph (b)
-Publisher FASB
-URI https://asc.fasb.org//1943274/2147482810/280-10-50-22
Reference 6: http://www.xbrl.org/2003/role/disclosureRef
-Topic 280
-SubTopic 10
-Name Accounting Standards Codification
-Section 50
-Paragraph 32
-Subparagraph (b)
-Publisher FASB
-URI https://asc.fasb.org//1943274/2147482810/280-10-50-32
Reference 7: http://www.xbrl.org/2003/role/disclosureRef
-Topic 280
-SubTopic 10
-Name Accounting Standards Codification
-Section 50
-Paragraph 40
-Publisher FASB
-URI https://asc.fasb.org//1943274/2147482810/280-10-50-40
Reference 8: http://www.xbrl.org/2003/role/disclosureRef
-Topic 280
-SubTopic 10
-Name Accounting Standards Codification
-Section 50
-Paragraph 22
-Subparagraph (a)
-Publisher FASB
-URI https://asc.fasb.org//1943274/2147482810/280-10-50-22
Reference 9: http://www.xbrl.org/2003/role/disclosureRef
-Topic 280
-SubTopic 10
-Name Accounting Standards Codification
-Section 50
-Paragraph 32
-Subparagraph (a)
-Publisher FASB
-URI https://asc.fasb.org//1943274/2147482810/280-10-50-32
Reference 10: http://www.xbrl.org/2003/role/disclosureRef
-Topic 280
-SubTopic 10
-Name Accounting Standards Codification
-Section 50
-Paragraph 41
-Subparagraph (a)
-Publisher FASB
-URI https://asc.fasb.org//1943274/2147482810/280-10-50-41
Reference 11: http://www.xbrl.org/2003/role/disclosureRef
-Topic 606
-SubTopic 10
-Name Accounting Standards Codification
-Section 50
-Paragraph 4
-Subparagraph (a)
-Publisher FASB
-URI https://asc.fasb.org//1943274/2147479806/606-10-50-4
| Name: |
us-gaap_RevenueFromContractWithCustomerExcludingAssessedTax |
| Namespace Prefix: |
us-gaap_ |
| Data Type: |
xbrli:monetaryItemType |
| Balance Type: |
credit |
| Period Type: |
duration |
|
| X |
- DefinitionThe aggregate total amount of expenses directly related to the marketing or selling of products or services.
| Name: |
us-gaap_SellingAndMarketingExpense |
| Namespace Prefix: |
us-gaap_ |
| Data Type: |
xbrli:monetaryItemType |
| Balance Type: |
debit |
| Period Type: |
duration |
|
| X |
- Details
| Name: |
us-gaap_StatementBusinessSegmentsAxis=us-gaap_CorporateMember |
| Namespace Prefix: |
|
| Data Type: |
na |
| Balance Type: |
|
| Period Type: |
|
|
| X |
- Details
| Name: |
srt_StatementGeographicalAxis=MUGH_NVMember |
| Namespace Prefix: |
|
| Data Type: |
na |
| Balance Type: |
|
| Period Type: |
|
|
| X |
- Details
| Name: |
srt_StatementGeographicalAxis=country_SC |
| Namespace Prefix: |
|
| Data Type: |
na |
| Balance Type: |
|
| Period Type: |
|
|
| X |
- Details
| Name: |
srt_StatementGeographicalAxis=country_HK |
| Namespace Prefix: |
|
| Data Type: |
na |
| Balance Type: |
|
| Period Type: |
|
|
| X |
- Details
| Name: |
srt_StatementGeographicalAxis=country_CN |
| Namespace Prefix: |
|
| Data Type: |
na |
| Balance Type: |
|
| Period Type: |
|
|
MU Global (PK) (USOTC:MUGH)
Historical Stock Chart
From Feb 2025 to Mar 2025
 Charts.")
MU Global (PK) (USOTC:MUGH)
Historical Stock Chart
From Mar 2024 to Mar 2025
 Charts.")
