Crystal Amber Fund Limited Monthly Net Asset Value
February 07 2018 - 5:54AM
UK Regulatory
TIDMCRS

7 February 2018


                          CRYSTAL AMBER FUND LIMITED

                     ("Crystal Amber Fund" or the "Fund")

                            Monthly Net Asset Value


Crystal Amber Fund announces that its unaudited net asset value ("NAV") per
share at 31 January 2018 was 201.29 pence (31 December 2017: 190.69 pence per
share).

The proportion of the Fund's NAV at 31 January 2018 represented by the ten
largest shareholdings, other investments and cash (including accruals), was as
follows:

Top ten shareholdings          Pence per share Percentage of investee equity
                                               held

Hurricane Energy plc                57.8                     8.0%

Northgate plc                       29.6                     5.3%

FairFX Group plc                    19.0                     15.7%

Ocado Group plc                     18.8                     0.6%

STV Group plc                       18.1                     14.5%

NCC Group plc                       11.5                     2.0%

Leaf Clean Energy Co.                9.1                     29.9%

Cenkos Securities plc                3.9                     6.4%

GI Dynamics Inc                      3.2                     44.4%

Boku Inc                             3.1                     1.7%

Total of ten largest holdings       174.1

Other investments                   22.7

Cash and accruals                    4.5

Total NAV                           201.3

For further enquiries please contact:

Crystal Amber Fund Limited

Chris Waldron (Chairman)

Tel: 01481 742 742

www.crystalamber.com

Allenby Capital Limited - Nominated Adviser

David Worlidge/James Thomas/Liz Kirchner

Tel: 020 3328 5656

Winterflood Investment Trusts - Broker

Joe Winkley/Neil Langford

Tel: 020 3100 0160

Crystal Amber Advisers (UK) LLP - Investment Adviser

Richard Bernstein

Tel: 020 7478 9080


END
(END) Dow Jones Newswires
February 07, 2018 06:54 ET (11:54 GMT)
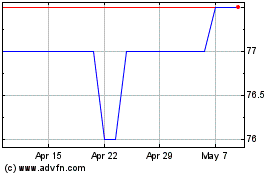
Crystal Amber (LSE:CRS)
Historical Stock Chart
From Mar 2024 to Apr 2024

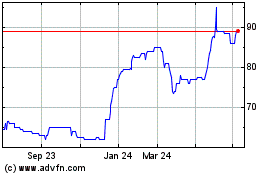
Crystal Amber (LSE:CRS)
Historical Stock Chart
From Apr 2023 to Apr 2024
