Half Yearly Report -6-
August 23 2010 - 1:00AM
UK Regulatory
| recognised on sale of       |          |  |          |  |          |  |
| assets to joint ventures    |          |  |          |  |          |  |
+-----------------------------+----------+--+----------+--+----------+--+
| Operating profit before     |    6,352 |  |    6,739 |  |   17,925 |  |
| changes in working capital  |          |  |          |  |          |  |
| and provisions              |          |  |          |  |          |  |
+-----------------------------+----------+--+----------+--+----------+--+
| (Increase)/decrease in      |  (14,039 | )|    4,366 |  |   (7,555 | )|
| trade and other receivables |          |  |          |  |          |  |
+-----------------------------+----------+--+----------+--+----------+--+
| (Increase)/decrease in      |  (70,150 | )|   82,422 |  |  152,762 |  |
| inventories                 |          |  |          |  |          |  |
+-----------------------------+----------+--+----------+--+----------+--+
| Increase/(decrease) in      |   51,016 |  |  (19,210 | )|  (17,173 | )|
| trade and other payables    |          |  |          |  |          |  |
+-----------------------------+----------+--+----------+--+----------+--+
| (Decrease)/increase in      |      (51 | )|      852 |  |     (611 | )|
| provisions and employee     |          |  |          |  |          |  |
| benefits                    |          |  |          |  |          |  |
+-----------------------------+----------+--+----------+--+----------+--+
| Cash generated from         |  (26,872 | )|   75,169 |  |  145,348 |  |
| operations                  |          |  |          |  |          |  |
+-----------------------------+----------+--+----------+--+----------+--+
| Interest paid               |   (1,363 | )|   (4,154 | )|   (6,684 | )|
+-----------------------------+----------+--+----------+--+----------+--+
| Income taxes received       |    1,906 |  |   22,460 |  |   21,688 |  |
+-----------------------------+----------+--+----------+--+----------+--+
| Net cash from operating     |  (26,329 | )|   93,475 |  |  160,352 |  |
| activities                  |          |  |          |  |          |  |
+-----------------------------+----------+--+----------+--+----------+--+
|                             |          |  |          |  |          |  |
+-----------------------------+----------+--+----------+--+----------+--+
| Cash flows from investing   |          |  |          |  |          |  |
| activities                  |          |  |          |  |          |  |
+-----------------------------+----------+--+----------+--+----------+--+
| Interest received           |      448 |  |      522 |  |    1,481 |  |
+-----------------------------+----------+--+----------+--+----------+--+
| Acquisition of property,    |     (270 | )|      (15 | )|      (44 | )|
| plant and equipment         |          |  |          |  |          |  |
+-----------------------------+----------+--+----------+--+----------+--+
| Proceeds from sale of plant |       12 |  |       57 |  |       45 |  |
| and equipment               |          |  |          |  |          |  |
+-----------------------------+----------+--+----------+--+----------+--+
| Purchase of investment in   |   (4,210 | )|        - |  |        - |  |
| joint ventures              |          |  |          |  |          |  |
+-----------------------------+----------+--+----------+--+----------+--+
| Movement in loans with      |   (1,450 | )|        - |  |        - |  |
| joint ventures              |          |  |          |  |          |  |
+-----------------------------+----------+--+----------+--+----------+--+
| Net cash from investing     |   (5,470 | )|      564 |  |    1,482 |  |
| activities                  |          |  |          |  |          |  |
+-----------------------------+----------+--+----------+--+----------+--+
|                             |          |  |          |  |          |  |
+-----------------------------+----------+--+----------+--+----------+--+
| Cash flows from financing   |          |  |          |  |          |  |
| activities                  |          |  |          |  |          |  |
+-----------------------------+----------+--+----------+--+----------+--+
| Proceeds from the issue of  |      254 |  |      118 |  |   60,662 |  |
| share capital               |          |  |          |  |          |  |
+-----------------------------+----------+--+----------+--+----------+--+
| Costs associated with share |        - |  |        - |  |   (1,535 | )|
| placing                     |          |  |          |  |          |  |
+-----------------------------+----------+--+----------+--+----------+--+
| Drawdown/(repayment) of     |    8,305 |  | (101,000 | )| (118,000 | )|
| borrowings                  |          |  |          |  |          |  |
+-----------------------------+----------+--+----------+--+----------+--+
| Costs associated with       |   (2,041 | )|        - |  |        - |  |
| refinancing                 |          |  |          |  |          |  |
+-----------------------------+----------+--+----------+--+----------+--+
| Net cash from financing     |    6,518 |  | (100,882 | )|  (58,873 | )|
| activities                  |          |  |          |  |          |  |
+-----------------------------+----------+--+----------+--+----------+--+
|                             |          |  |          |  |          |  |
+-----------------------------+----------+--+----------+--+----------+--+
| Net (decrease)/increase in  |  (25,281 | )|   (6,843 | )|  102,961 |  |
| cash and cash equivalents   |          |  |          |  |          |  |
+-----------------------------+----------+--+----------+--+----------+--+
| Cash and cash equivalents   |  114,595 |  |   11,634 |  |   11,634 |  |
| at the start of period      |          |  |          |  |          |  |
+-----------------------------+----------+--+----------+--+----------+--+
| Cash and cash equivalents   |   89,314 |  |    4,791 |  |  114,595 |  |
| at the end of period        |          |  |          |  |          |  |
+-----------------------------+----------+--+----------+--+----------+--+

Notes to the accounts
1              Basis of preparation
Bovis Homes Group PLC ('the Company') is a company domiciled in the United
Kingdom.  The condensed  consolidated interim financial statements of the
Company for the six months ended 30 June 2010 comprise the Company and its
subsidiaries (together referred to as 'the Group') and the Group's interest in
associates.
The condensed consolidated interim financial statements were authorised for
issue by the directors on 20 August 2010.  The financial statements are
unaudited but have been reviewed by KPMG Audit Plc.
The condensed interim financial statements do not constitute statutory accounts
within the meaning of Section 434 of the Companies Act 2006.
The figures for the half years ended 30 June 2010 and 30 June 2009 are
unaudited.  The comparative figures for the financial year ended 31 December
2009 are not the Company's statutory accounts for that financial year.  Those
accounts have been reported on by the Company's auditors and delivered to the
Registrar of Companies.  The report of the auditors was (i) unqualified, (ii)
did not include a reference to any matters to which the auditors drew attention
by way of emphasis without qualifying their report and (iii) did not contain a
statement under Section 498 (2) or (3) of the Companies Act 2006.

 The
preparation of a condensed set of financial statements requires management to
make judgements, estimates and assumptions that affect the application of
accounting policies and the reported amount of assets, liabilities, income and
expenses.  Actual results may differ from these estimates.
Judgements made by management in the application of adopted IFRSs that have
significant effect on the financial statements and estimates with a significant
risk of material adjustment in following years remain those published in the
Company's consolidated financial statements for the year ended 31 December 2009.
The condensed interim financial statements have been prepared in accordance with
IAS34 'Interim Financial Reporting' as endorsed by the EU.  As required by the
Disclosure and Transparency Rules of the Financial Services Authority, the
condensed consolidated interim financial statements have been prepared applying
the accounting policies and presentation that were applied in the preparation of
the Company's published consolidated financial statements for the year ended 31
December 2009, which were prepared in accordance with IFRSs as adopted by the
EU.
The following new standards, amendments to standards or interpretations are
mandatory for the first time for the Company's year ending 31 December 2010.
They are not expected to have a material impact on the Group's financial
statements:
IFRS2 - (Amended) Group Cash-settled Share-based Payment Transactions.  The
amendments clarify the accounting for group cash-settled share-based payment
transactions and how an individual subsidiary in a group should account for some
share-based payment arrangements in its own financial statements.  This
amendment is not expected to have any material impact on the Group's financial
statements as the Group already applies IFRIC11.
IFRS3 - (Revised) Business Combinations.  This revision has no impact on
implementation although it will alter the accounting treatment for future
potential acquisitions.
IAS27 - (Revised) Consolidated and Separate Financial Statements.  This
primarily relates to accounting for non-controlling interests and the loss of
control of a subsidiary.  The Group has not disposed of any subsidiaries in the
period and therefore the revision of this accounting standard is not considered
to have a material impact on the Group's financial statements.
IAS39 - (Amended) Financial Instruments.  This standard is amended such that
gains or losses on a hedged instrument should be reclassified from equity to
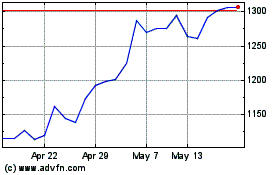
Vistry (LSE:VTY)
Historical Stock Chart
From Jun 2024 to Jul 2024

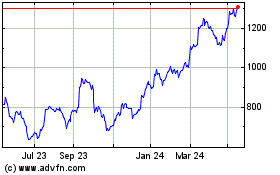
Vistry (LSE:VTY)
Historical Stock Chart
From Jul 2023 to Jul 2024
