Dismal 1Q Earnings at AGNC - Analyst Blog
May 06 2013 - 7:07AM
Zacks
American Capital Agency Corp. (AGNC) -- a real
estate investment trust (REIT) -- reported disappointing
first-quarter 2013 results with its net spread income per share of
78 cents significantly lagging the Zacks Consensus Estimate of
$1.08.
Moreover, it compared unfavorably with the prior-quarter figure
of $1.42 cents per share. Hurt by lower pricing on its
mortgage-backed securities (MBS) portfolio, American Capital
Agency’s book value suffered a considerable downfall during the
quarter.
Net interest income came in at $407 million in the reported
quarter, which was above the Zacks Consensus Estimate of $380
million and marginally below $408 million recorded in the prior
quarter.
Behind the Headline Numbers
American Capital Agency reported an economic loss on common equity
for the quarter of 4.6%, or 18.7% annualized. As of Mar 31, 2013,
the company's investment portfolio comprised $76.3 billion of
agency securities and $27.3 billion of net TBA (to-be-announced)
mortgage positions, at fair value.
As of that date, the company's agency securities included $74.8
billion of fixed-rate securities, $0.8 billion of adjustable-rate
securities and $0.7 billion of collateralized mortgage obligations
(CMOs).
American Capital Agency’s fixed-rate investment portfolio consisted
of $22.6 billion less than or equal to 15-year fixed-rate
securities, $0.4 billion 20-year fixed-rate securities and $51.8
billion 30-year fixed-rate securities. Net TBA mortgage portfolio
included $12.5 billion 15-year net TBA securities and $14.8 billion
30-year net TBA securities, at fair value.
The investment portfolio of American Capital Agency was financed
with $67.1 billion of repurchase agreements and other debt,
resulting in a leverage ratio of 5.7x, including the net payable
for agency securities not yet settled, or 8.1x inclusive of
off-balance sheet TBA financing.
During the reported quarter, the company’s average asset yield on
its agency security portfolio was 2.80% (down 2 basis points
sequentially) and its average cost of funds was 1.28% (up 9 bps
sequentially), resulting in a net interest rate spread of 1.52% (a
decline of 11 bps sequentially).
As of Mar 31, 2013, the company's net book value per common share
was $28.93, down from $31.64 as of Dec 31, 2012. This was due to
lower pricing on the company's MBS portfolio and lower "pay-ups"
(or price premiums) on specified pools of securities with favorable
prepayment attributes.
As of Mar 31, 2013, American Capital Agency had cash and cash
equivalents of $2.8 billion compared with $2.4 billion at year-end
2012.
Dividend Update
On Mar 7, 2013, the company declared a first quarter dividend on
its common stock of $1.25 per share. This was paid on Apr 26, 2013
to common stockholders of record as of Mar 20, 2013. As a matter of
fact, the company has paid a total of $3.3 billion in common
dividends, or $25.11 per common share, since its May 2008 initial
public offering.
In Conclusion
Though the lower-than-expected results during the first quarter at
American Capital Agency came as a disappointment, we note that the
company’s exclusive focus on fixed-rate agency securities
guaranteed by the U.S. government limits its credit risks.
However, increased volatility and deterioration in the broader
residential mortgage and RMBS markets may restrict the upside
potential of the company going forward. The company is externally
managed and advised by American Capital AGNC Management, LLC, an
affiliate of American Capital, Ltd. (ACAS).
American Capital Agency currently has a Zacks Rank #3 (Hold).
However, the other REIT stocks which are performing well and worth
a look include iStar Financial Inc. (SFI) and
Western Asset Mortgage Capital Corp. (WMC), both
carrying a Zacks Rank #1 (Strong Buy).
AMER CAP LTD (ACAS): Free Stock Analysis Report
AMER CAP AGENCY (AGNC): Free Stock Analysis Report
ISTAR FINL INC (SFI): Free Stock Analysis Report
WESTERN AST MTG (WMC): Free Stock Analysis Report
To read this article on Zacks.com click here.
Zacks Investment Research
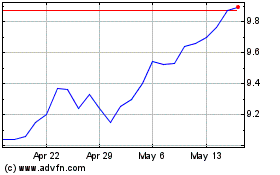
AGNC Investment (NASDAQ:AGNC)
Historical Stock Chart
From Jun 2024 to Jul 2024

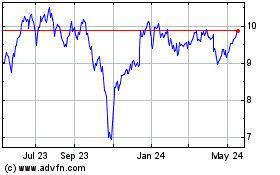
AGNC Investment (NASDAQ:AGNC)
Historical Stock Chart
From Jul 2023 to Jul 2024
