Tree Island Steel ("Tree Island" or the "Company")
(TSX:TSL) announced today its financial results for the three-month
and nine-month periods ended September 30, 2019.
For the three-month period ended September 30,
2019, revenues amounted to $49.7 million compared to $55.8 million
in the same period last year, attributable to lower pricing with
reduced raw material costs, industry wide competitive pricing
pressures, and a lower demand in the Residential and Commercial
segments. The lower selling prices and softer demand in the quarter
resulted in a gross profit of $4.6 million for the quarter,
compared to $6.9 million in the same period in 2018. As a result,
EBITDA in the third quarter of 2019 amounted to $2.5 million
compared to $3.4 million during the third quarter of
2018.
For the nine-month period ended September 30,
2019, revenues amounted to $155.3 million compared to $190.4
million in the first nine months of last year, attributable to
lower sales volumes to U.S. customers, impacted by Section 232
steel tariffs affecting the first half of 2019, and softer market
demand. These impacts resulted in a gross profit of $14.3 million
for the first nine months of 2019, compared to $22.1 million in the
same period in 2018. As a result, EBITDA in the first three
quarters of 2019 amounted to $6.9 million compared to $12.3 million
during the same period of 2018.
“Our Q3 financial results were impacted in part
by Section 232 steel tariffs in the first half of the year and an
overall weaker demand for wire and wire products. While Q3 revenues
and gross profit have decreased compared to Q2 and Q1, we have
actively implemented cost cutting measures to reduce the overall
impact on profitability. We are committed to the continuous
improvement of profitability and will remain focused on customer
engagement, improving efficiency and managing costs,” said Dale R.
MacLean, Tree Island’s President and CEO. “Since our exemption from
the steel tariffs between Canada and the U.S., we are focusing on
regaining our market share and expanding the US market by
re-establishing our long standing customer and market
foundation.”
Summary of Results($'000 unless otherwise
stated)
| |
Three Months Ended |
|
Nine Months Ended |
|
|
September 30, |
|
September 30, |
|
|
2019 |
20181 |
|
2019 |
20181 |
| |
|
|
|
|
|
| Revenue |
49,701 |
55,846 |
|
155,261 |
190,424 |
|
Cost of sales |
(43,513) |
(48,014) |
|
(136,361) |
(165,691) |
|
Depreciation2 |
(1,565) |
(903) |
|
(4,611) |
(2,589) |
| Gross profit |
4,623 |
6,929 |
|
14,289 |
22,144 |
|
Selling, general and administrative expenses |
(3,762) |
(4,379) |
|
(11,790) |
(12,714) |
| Operating income |
861 |
2,550 |
|
2,499 |
9,430 |
|
Foreign exchange gain (loss) |
70 |
(77) |
|
(186) |
298 |
|
Gain (loss) on property, plant and equipment |
(3) |
(2) |
|
- |
2 |
|
Other expenses |
(215) |
(39) |
|
(482) |
(104) |
|
Changes in financial liabilities recognized at fair value |
- |
(123) |
|
- |
(89) |
|
Financing expenses3 |
(1,111) |
(850) |
|
(3,590) |
(2,492) |
| Income (loss) before income
taxes |
(398) |
1,459 |
|
(1,759) |
7,045 |
|
Current Income tax (expense) recovery |
- |
(311) |
|
(231) |
(311) |
|
Deferred Income tax (expense) recovery |
39 |
(125) |
|
(1) |
(1,814) |
| Net
income (loss) |
(359) |
1,023 |
|
(1,991) |
4,920 |
| |
|
|
|
|
|
| Operating Income |
861 |
2,550 |
|
2,499 |
9,430 |
|
Add back depreciation |
1,565 |
903 |
|
4,611 |
2,589 |
|
Foreign exchange gain |
70 |
(77) |
|
(186) |
298 |
|
EBITDA4 |
2,496 |
3,376 |
|
6,924 |
12,317 |
| |
|
|
|
|
|
| Net income per share |
(0.01) |
0.03 |
|
(0.07) |
0.17 |
| Dividends per share |
0.02 |
0.02 |
|
0.06 |
0.06 |
| |
|
|
|
|
|
|
Financial Position as at: |
September 30, 2019 |
|
December 31, 2018 |
| |
|
|
|
| Total assets5 |
174,223 |
|
158,449 |
| Total non-current financial
liabilities6 |
49,395 |
|
21,928 |
1 On adoption of IFRS 16 Leases, the comparative information
presented for 2018 have not been restated and is presented as
previously reported.
2 Tree Island recognized depreciation of $0.7 million from the
adoption of IFRS 16 during Q3 2019. See Note 3 of the Q3 2019
Interim Unaudited Condensed Consolidated Financial Statements.
3 Tree Island recognized financing expenses of $0.4 million from
the adoption of IFRS 16 during Q3 2019. See Notes 3 and 10 of
the Q3 2019 Interim Unaudited Condensed Consolidated Financial
Statements.
4 See definition of EBITDA and Adjusted Net
Income in Section 2 NON-IFRS MEASURES of the Q3 2019 MD&A.
5 Tree Island recognized right-of-use assets of $29.8 million at
the end of Q3 2019 from the adoption of IFRS 16. See Note 3
of the Q3 2019 Interim Unaudited Condensed Consolidated Financial
Statements.
6 Tree Island recognized lease liability of $33.0 million at the
end of Q3 2019 from the adoption of IFRS 16. See Note 3 of
the Q3 2019 Interim Unaudited Condensed Consolidated Financial
Statements.
About Tree Island Steel
Tree Island Steel, headquartered in Richmond,
British Columbia, since 1964, through its four operating facilities
in Canada and the United States, produces wire products for a
diverse range of industrial, residential construction, commercial
construction and agricultural applications. Its products
include galvanized wire, bright wire; a broad array of fasteners,
including packaged, collated and bulk nails; stucco reinforcing
products; concrete reinforcing mesh; fencing and other fabricated
wire products. The Company markets these products under the
Tree Island®, Halsteel®, K-Lath®, TI Wire® and ToughStrand® brand
names.
Forward-Looking Statements
This press release includes forward-looking
information with respect to Tree Island including its business,
operations and strategies, its dividend policy and the declaration
and payment of dividends thereunder as well as financial
performance and conditions. The use of forward-looking words
such as, "may," "will," "expect" or similar variations generally
identify such statements. Any statements that are contained
herein that are not statements of historical fact may be deemed to
be forward-looking statements. Although management believes
that expectations reflected in forward-looking statements are
reasonable, such statements involve risks and uncertainties
including risks and uncertainties discussed under the heading “Risk
Factors” in Tree Island’s most recent annual information form and
management discussion and analysis.
The forward-looking statements contained herein
reflect management's current beliefs and are based upon certain
assumptions that management believes to be reasonable based on the
information currently available to management. By their very
nature, forward-looking statements involve inherent risks and
uncertainties, both general and specific, and a number of factors
could cause actual events or results to differ materially from the
results discussed in the forward-looking statements. In
evaluating these statements, prospective investors should
specifically consider various factors including the risks outlined
in the Company’s most recent annual information form and management
discussion and analysis which may cause actual results to differ
materially from any forward-looking statement. Such risks and
uncertainties include, but are not limited to: general economic,
market and business conditions, the cyclical nature of our business
and demand for our products, financial condition of our customers,
competition, volume and price pressure from import competition,
deterioration in the Company’s liquidity, disruption in the supply
of raw materials, volatility in the costs of raw materials,
transportation costs, foreign exchange fluctuations, leverage and
restrictive covenants, labour relations, trade actions, dependence
on key personnel and skilled workers, intellectual property risks,
energy costs, uninsured loss, credit risk, operating risk,
management of growth, changes in tax, environmental and other
legislation, and other risks and uncertainties set forth in our
publicly filed materials.
This press release has been reviewed by the
Company's Board of Directors and its Audit Committee, and contains
information that is current as of the date of this press release,
unless otherwise noted. Events occurring after that date could
render the information contained herein inaccurate or misleading in
a material respect. Readers are cautioned not to place undue
reliance on this forward-looking information and management of the
Company undertakes no obligation to update publicly or revise any
forward-looking information, whether as a result of new
information, future events or otherwise except as required by
applicable securities laws.
For further information: Ali Mahdavi, Investor
Relations Tree Island Steel (416) 962-3300e-mail:
amahdavi@treeisland.comWebsite: www.treeisland.com
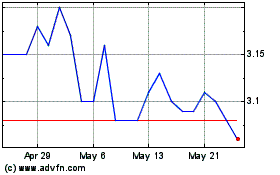
Tree Island Steel (TSX:TSL)
Historical Stock Chart
From Dec 2024 to Jan 2025

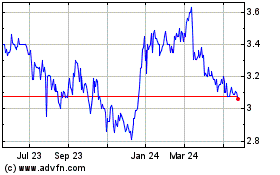
Tree Island Steel (TSX:TSL)
Historical Stock Chart
From Jan 2024 to Jan 2025
