OTCBB “TDCB” - Third Century Bancorp (“Company”), the holding
company for Mutual Savings Bank (“Bank”) announced it had net
income of $65,000 for the quarter ended June 30, 2014, or $0.05 per
share, compared to net income of $156,000 for the quarter ended
June 30, 2013, or $0.12 per share. For the six months ended June
30, 2014, the Company recorded net income of $120,000, or $0.09 per
share, compared to net income of $216,000 for the six months ended
June 30, 2013, or $0.17 per share.
For the three months ended June 30, 2014, net income decreased
$91,000, or 58.33%, to $65,000 and for the six months ended June
30, 2014, net income decreased $96,000, or 44.44% to $120,000,
primarily due to decreases in net interest income and noninterest
income and an increase in noninterest expense. Net interest income
was $995,000 for the second quarter of 2014 compared to $1.0
million for the second quarter of 2013 and $2.0 million for the six
months ended June 30, 2014 compared to $2.1 million for the six
months ended June 30, 2013. The decrease in net interest income was
primarily due to a decrease of $213,000 or 25.68%, in interest
income on commercial real estate mortgages to $615,000 for the six
months ended June 30, 2014 compared to $828,000 for the six months
ended June 30, 2013.
Total noninterest income decreased $32,000 to $209,000 for the
three months ended June 30, 2014 from $241,000 for the three months
ended June 30, 2013 and decreased $34,000 to $383,000 for the six
months ended June 30, 2014 from $417,000 for the six months ended
June 30, 2014. For both the three month and six month periods ended
June 30, 2014, the decreases were primarily due to the decrease in
the net gains on loan sales. Net gains on loan sales decreased
$59,000 to $1,000 for the three months ended June 30, 2014 and
$60,000 to $20,000 for the six months ended June 30, 2014.
Noninterest expenses for the second quarter of 2014 was $1.1
million compared to $1.0 million for the second quarter of 2013 and
$2.2 million for the six months ended June 30, 2014 compared to
$2.1 million for the six months ended June 30, 2013. The increase
in noninterest expense for the three and six month periods ended
June 30, 2014 compared to the three and six months ended June 30,
2013 was primarily due to increases in salaries and employee
benefits.
Total assets decreased $1.8 million to $121.9 million at June
30, 2014 from $123.7 million at December 31, 2013, a decrease
of 1.45%. The decrease was primarily due to the repayment of $3.0
million of Federal Home Loan Bank borrowings.
Deposits increased $1.1 million to $91.5 million at June 30,
2014 from $90.4 million at December 31, 2013. Savings, money market
and NOW accounts increased $1.8 million, or 3.93%, to $48.7 million
at June 30, 2014 from $46.9 million at December 31, 2013 and demand
deposits increased $299,000, or 1.84%, to $16.6 million at June 30,
2014 from $16.3 million at December 31, 2013. Time deposits
decreased $1.0 million, or 3.84% to $26.2 million at June 30, 2014
from $27.3 million at December 31, 2013.
Federal Home Loan Bank advances and other borrowings decreased
$3.0 million, or 17.14%, to $14.5 million at June 30, 2014 from
$17.5 million at December 31, 2013 due to the repayment of $3.0
million in Federal Home Loan Bank advances which matured during the
first quarter of 2014. At June 30, 2014 the weighted average rate
of all Federal Home Loan Bank advances was 1.52% compared to 1.85%
at December 31, 2013 and the weighted average maturity was 3.25
years at June 30, 2014 compared with 3.2 years at December 31,
2013.
Stockholders’ equity was $15.5 million at June 30, 2014 and
December 31, 2013. Stockholders’ equity decreased due to cash
dividends paid of $115,000 offset in part by net income of $120,000
for the six months ended June 30, 2014. Equity as a percentage of
assets increased 0.19% to 12.70% at June 30, 2014 compared to
12.51% at December 31, 2013.
Founded in 1890, Mutual Savings Bank is a full-service financial
institution based in Johnson County, Indiana. In addition to its
main office at 80 East Jefferson Street, Franklin, Indiana, the
bank operates branches in Franklin at 1124 North Main Street and
the Franklin United Methodist Community, as well as in Edinburgh,
Nineveh and Trafalgar, Indiana.
Selected Consolidated Financial Data
(unaudited) At June 30, At December 31,
2014 2013 Selected
Consolidated Financial Condition Data:
(In Thousands)
Assets $ 121,881 $ 123,674 Loans receivable-net 94,219 96,045 Cash
and cash equivalents 9,054 6,561 Interest-earning time deposits
6,176 7,169 Investment securities 6,364 7,154 Deposits 91,526
90,431 FHLB advances and other borrowings 14,500 17,500
Stockholders’ equity-net 15,476 15,469
For the Three
Months Ended June 30, 2014
2013 (Dollars In Thousands, Except Share
Data) Selected Consolidated Earnings Data: Total
interest income $ 1,114 $ 1,217 Total interest expense
119 176 Net interest
income 995 1,041
Provision (credit) for losses on loans
(1 ) 1
Net interest income after provision for
losses on loans
996 1,040 Noninterest income 209 241 Noninterest expense 1,097
1,022 Income tax expense
43
103 Net income
65
156 Earnings per share basic $ 0.05 $
0.12 Earnings per share diluted $ 0.05 $ 0.12
Selected
Financial Ratios and Other Data: Interest rate spread during
period 3.17 % 3.22 % Net yield on interest-earning assets 3.34 3.41
Return on average assets 0.21 0.49 Return on average equity 1.68
4.07 Equity to assets 12.70 11.94
Average interest-earning assets to average
interest-bearing liabilities
136.62 132.87 Non-performing assets to total assets 4.18 4.43
Allowance for loan losses to total loans
outstanding
1.95 2.20
Allowance for loan losses to
non-performing loans
37.78 43.71
Net charge-offs to average total loans
outstanding
0.12 0.04 Noninterest expense to average assets 0.90 0.81 Effective
income tax rate 39.81 39.77 Number of full service offices 6
6 Tangible book value per share $ 12.15 $ 12.12 Market closing
price at end of quarter $ 7.62 $ 6.40 Price-to-tangible book value
62.70 % 52.80 %
For the Six Months Ended June
30, 2014 2013
(Dollars In Thousands, Except Share Data) Selected
Consolidated Earnings Data: Total interest income $ 2,250 $
2,427 Total interest expense
263
356 Net interest income 1,987 2,071 Provision
for losses on loans
2
10
Net interest income after provision for
losses on loans
1,985 2,061 Noninterest income 383 417 Noninterest expense 2,170
2,119 Income tax expense
78
143 Net income $
120 $
216 Earnings per share basic $ 0.09 $ 0.17
Earnings per share diluted $ 0.09 $ 0.17
Selected
Financial Ratios and Other Data: Interest rate spread during
period 3.31 % 3.24 % Net yield on interest-earning assets 3.50 3.41
Return on average assets 0.19 0.34 Return on average equity 1.57
2.83 Equity to assets 12.70 11.92
Average interest-earning assets to average
interest-bearing liabilities
131.23 128.77 Non-performing assets to total assets 4.18 4.43
Allowance for loan losses to total loans
outstanding
1.95 2.20
Allowance for loan losses to
non-performing loans
37.78 43.71
Net charge-offs to average total loans
outstanding
0.12 0.04 Noninterest expense to average assets 1.76 1.68 Effective
income tax rate 39.39 39.83 Number of full service offices 6
6 Tangible book value per share $ 12.15 $ 12.12 Market closing
price at end of quarter $ 7.62 $ 5.15 Price-to-tangible book value
62.70 % 42.48 %
Third Century BancorpRobert D. Heuchan, President and CEODavid
A. Coffey, Executive Vice President, CFO and COOTel.
317-736-7151Fax 317-736-1726
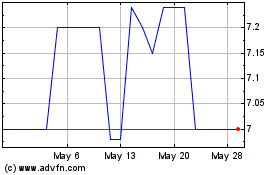
Third Century Bancorp (PK) (USOTC:TDCB)
Historical Stock Chart
From Jan 2025 to Feb 2025

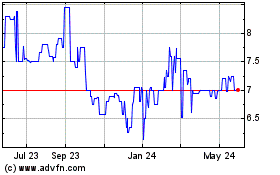
Third Century Bancorp (PK) (USOTC:TDCB)
Historical Stock Chart
From Feb 2024 to Feb 2025
