Ceiba Investments Limited Net Asset Value(s)
June 20 2024 - 1:00AM
RNS Regulatory News

RNS Number : 1080T
Ceiba Investments Limited
20 June 2024
CEIBA INVESTMENTS
LIMITED
(TICKER CBA, ISIN:
GG00BFMDJH11)
Legal
Entity Identifier:
213800XGY151JV5B1E88
UNAUDITED NET ASSET VALUE PER
SHARE AS AT 31 MARCH 2024
CEIBA Investments Limited,
the largest listed foreign investor
solely dedicated to investing in Cuba, announces that its unaudited net asset value per share
("NAV") as at 31 March 2024
was USD1.1650 (31 December 2023: USD1.1514).
Applying the GBP:USD exchange rate
as at 31 March 2024 of USD1.2632 : GBP1.00 (31 December 2023:
USD1.2747 : GBP1.00), the unaudited NAV in Sterling was GBP0.9223
(31 December 2023: GBP0.9033) per
share.
As at 31 March 2024, the net assets
were USD160,392,100 (31 December 2023:
USD158,519,549).
For
further information, please contact:
|
Sebastiaan Berger
|
Via NSM Funds
Limited
|
|
Singer Capital
Markets
James Maxwell / Finn Gordon (Corporate
Finance)
James Waterlow
(Sales)
|
Tel: +44 (0)20 7496 3000
|
|
NSM
Funds Limited
|
Tel: +44 (0)1481 743030
|
www.ceibainvest.com
END OF ANNOUNCEMENT
This information is provided by RNS, the news service of the
London Stock Exchange. RNS is approved by the Financial Conduct
Authority to act as a Primary Information Provider in the United
Kingdom. Terms and conditions relating to the use and distribution
of this information may apply. For further information, please
contact
rns@lseg.com or visit
www.rns.com.
RNS may use your IP address to confirm compliance with the terms
and conditions, to analyse how you engage with the information
contained in this communication, and to share such analysis on an
anonymised basis with others as part of our commercial services.
For further information about how RNS and the London Stock Exchange
use the personal data you provide us, please see our
Privacy
Policy.
END
NAVGPURCQUPCGCB
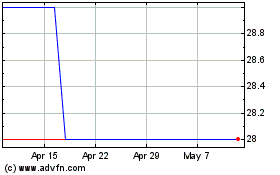
Ceiba Investments (LSE:CBA)
Historical Stock Chart
From Dec 2024 to Jan 2025

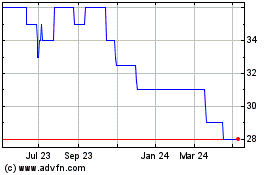
Ceiba Investments (LSE:CBA)
Historical Stock Chart
From Jan 2024 to Jan 2025
