RNS Number:7195X
Kenmare Resources PLC
19 April 2004


               Kenmare Resources plc ("Kenmare" or "the Company")

                          Kenmare Preliminary Results

                     For the year ended 31st December 2003


Chairman's Statement


Dear Shareholder,


The key objective we have been pursuing over the last 9 months has been the
signing of a Fixed Price Contract to develop the Moma project. I was very
pleased to announce on the 8th of April that we had entered into such a contract
with a Joint Venture formed between Multiplex Ltd and Bateman BV. I cannot think
of a more suitable combination of key skills to implement the project. Multiplex
is a large contracting group with operations stretching around the globe and
which specialises in large complex construction projects. Bateman is an
international engineering group with specific mineral sands expertise and
experience of working in Mozambique. These best in class companies are bringing
their expertise together to deliver the project for Kenmare under the agreed
terms of the contract.


The contract, which is denominated in a number of currencies, is established on
a base price of US$220 million with provisions for cost overruns up to US$240
million at which point it becomes totally fixed. Between US$220 and US$240
million the JV shoulders a progressively greater proportion of the costs. Hence
there is a great incentive for it to ensure overruns above US$220 million are
minimal. From commencement of the work programme under the contract it will take
two years to complete the construction of the Moma project.


The contract is subject to a number of conditions precedent before it becomes
effective. The most significant of the conditions precedent is the making
available of debt financing, which is itself conditional on the availability of
an equity financing component. Hence the next step is to complete the funding
process.


A debt funding package has been negotiated with a lender group comprising the
European Investment Bank (EIB), The African Development Bank (ADB), FMO (a Dutch
development finance institution), KfW (a German development finance institution)
and ABSA (a South African Commercial Bank) lending under an ECIC (Export Credit
Insurance Agency of South Africa) export guarantee. The EIB, and the ADB have
received board approvals for their loans to the project. The remaining lenders
required the signing of the construction contract before they could take it to
their boards. They are expected to do so in the coming weeks. Political risk
guarantees are being provided to the project by MIGA, an arm of the World Bank,
and are expecting to be supplemented by Hermes, an arm of the German Government.


It is intended that a placing to institutional investors will be performed to
cover the required equity component of the financing. All shareholders will also
be given an opportunity to participate in the equity financing component by way
of partial claw back of this placing.


Kenmare accounts for the year ended 31 December 2003 show a profit of US$120,551
arising mainly from deposit interest income net of an operating loss of
US$42,877.

Charles Carvill

Chairman


For more information:

Kenmare Resources plc

Michael Carvill, Managing Director

Tel: + 353 1 671 0411

Mob: + 353 87 6740110


Conduit PR Ltd

Leesa Peters

Tel: +44 (0) 207 936 9095

Mob: + 44 (0) 781 215 9885

Murray Consultants Ltd

Tom Byrne

Tel: + 353 1 498 0339

Mob:     +353 86 810 4224

www.kenmareresources.com


CONSOLIDATED PROFIT AND LOSS ACCOUNT
FOR THE YEAR ENDED 31st DECEMBER 2003


                                                             2003       2002
                                                              US$        US$

       Turnover                                                 -          -
       Operating (Loss)/Income                           (42,877)    707,037
       Operating (Loss)/Profit                           (42,877)    707,037
       Interest Receivable                                163,428    261,483
       Profit On Ordinary Activities Before Taxation      120,551    968,520
       Taxation                                                 -          -
       Profit On Ordinary Activities After Taxation       120,551    968,520
       Earnings per share: Basic                           0.05c       0.41c
       Earnings per share: Diluted                          0.04c      0.36c


CONSOLIDATED BALANCE SHEET
AS AT 31st DECEMBER 2003


                                                                   2003            2002
                                                                    US$             US$
       FIXED ASSETS
       Mineral Interests                                     27,431,163      18,618,309
       Tangible Assets                                       41,622,440      41,630,810
                                                             69,053,603      60,249,119
       CURRENT ASSETS
       Debtors                                                   90,322          95,473
       Cash at Bank and In Hand                               4,574,490       8,040,751
                                                              4,664,812       8,136,224
       CREDITORS:
       Amounts falling due within one year                  (3,224,907)     (1,453,021)
       NET CURRENT ASSETS                                     1,439,905       6,683,203
       TOTAL ASSETS LESS CURRENT LIABILITIES                 70,493,508      66,932,322
       CREDITORS:
       Amounts falling due after one year                   (1,730,161)     (1,431,903)
       PROVISION FOR LIABILITIES AND CHARGES                          -     (2,826,000)
                                                             68,763,347      62,674,419
       CAPITAL AND RESERVES
       Called Up Share Capital - (Equity & Non-Equity)       26,269,539      24,556,528
       Share Premium Account                                 29,848,262      25,592,896
       Profit and Loss Account - (Deficit)                 (21,891,727)    (22,012,278)
       Revaluation Reserve                                   30,141,002      30,141,002
       Other Reserve                                          3,642,080       3,642,080
       Capital Conversion Reserve Fund                          754,191         754,191

       Shareholders' Funds                                   68,763,347      62,674,419


GROUP CASH FLOW STATEMENT
FOR THE YEAR ENDED 31st DECEMBER 2003


                                                                                     2003           2002
                                                                                      US$            US$
              Net cash (outflow)/inflow from operating activities             (1,092,221)      1,948,541
              Returns on Investments & Servicing of Finance
              Interest received                                                   163,428        261,483
              Net cash inflow from Returns on Investment &
              Servicing of Finance                                                163,428        261,483
              Capital expenditure & financial investment
              Addition of Mineral Interests                                   (8,812,854)    (7,583,927)
              Net cash outflow from capital expenditure &
              financial investment                                            (8,812,854)    (7,583,927)
              Net cash outflow before use of liquid resources & financing     (9,741,647)    (5,373,903)
              Financing
              Issue of Ordinary Share Capital                                   6,513,083     14,530,686
              Cost of share issues                                              (544,706)    (1,369,388)
              Finance Lease                                                       (2,254)       (15,690)
              Debt due within one year                                             11,005    (1,027,945)
              Debt due beyond a year                                              298,258         57,461
              Net cash inflow from financing                                    6,275,386     12,175,124
              (Decrease)/Increase in cash                                     (3,466,261)      6,801,221


STATEMENT OF TOTAL RECOGNISED GAINS AND LOSSES
FOR THE YEAR ENDED 31st DECEMBER 2003


                                                           2003           2002
                                                            US$            US$
       Income attributable to Group shareholders        120,551        968,520
       Movement in Revaluation Reserve                        -    (1,408,750)
       Total Recognised Gains/(Losses) for the year     120,551      (440,230)


RECONCILIATION OF MOVEMENTS IN SHAREHOLDERS' FUNDS
FOR THE YEAR ENDED 31st DECEMBER 2003


                                                              2003          2002
                                                               US$           US$
       Total Recognised Gains/(Losses) for the year        120,551     (440,230)
       Issue of Shares - at par                          1,713,011     3,872,024
       Share premium, net of costs                       4,255,366     9,289,274
       Net change in Shareholders' funds                 6,088,928    12,721,068
       Opening Shareholders' funds                      62,674,419    49,953,351
       Closing Shareholders' funds                      68,763,347    62,674,419


                        NOTES TO THE PRELIMINARY RESULTS


Note 1 Basis of Accounting

The preliminary results have been prepared in US Dollar under the historical
cost convention, as modified by the revaluation of certain fixed assets, and in
accordance with the accounting policies set out on page 23 of the 2002 Annual
Report and Accounts.


Note 2 Basis of Preparation

The financial information presented above does not constitute statutory accounts
within the meaning of the Companies Acts, 1963 to 2001. An audit report has not
yet been issued on the accounts for the year ended 31st December 2003, nor have
they been delivered to the Registrar of Companies. The comparative financial
information for the year ended 31st December 2002 has been derived from the
statutory accounts for the year. Those statutory accounts, upon which the
auditors have issued an unqualified opinion, have been filed with the Registrar
of Companies.


Note 3 Earnings and fully diluted earnings per share

The calculation of the earnings and fully diluted earnings per share is based on
the profit after taxation of US$120,551 (2002: Profit US$968,520) and the
weighted average number of shares in issue during 2003 of 270,684,123(2002 -
238,468,595 shares).


The calculation of fully diluted earnings per share is based on the profit for
the period after taxation as for basic earnings per share. The number of shares
is adjusted to show the potential dilution if share options and share warrants
are converted into ordinary shares. The weighted average number of shares in
issue is increased to 299,560,810.


Note 4 Mineral Interests

The recovery of deferred development expenditure is dependent upon the
successful development of economic ore reserves, which in turn depends on the
availability of adequate funding being made available. The Directors are
satisfied that deferred expenditure is worth not less than cost less any amounts
written off and that the exploration projects have the potential to achieve mine
production and positive cash flows.


Note 5 Tangible Assets

Tangible Assets are stated at cost or valuation less accumulated depreciation.
GRD Minproc Limited, an independent Australian engineering group, has appraised
the Mining and Processing Plant on a depreciated replacement cost basis of
valuation as at 30 June 2000. An inspection of the Mining and Processing Plant
was carried out by GRD Minproc Limited in March 2002 concluding that no material
alteration to the plants had taken place. Confirmation of the existence of the
Processing Plant and the Mining Plant at the year end has been provided by
Bateman Engineering, an international engineering group.


The recovery of the plant valuation is dependent upon the successful development
of the Moma Titanium Minerals Project, which in turn depends on the availability
of adequate funding being made available. The historical cost net book value of
these assets at 31 December 2003 is US$11,473,067. The surplus arising on
revaluation amounts to US$30,141,002.


Note 6 Reconciliation of Operating Loss to Net Cash flow from Operating
Activities


                                                                      2003           2002
                                                                       US$            US$
Operating (Loss)/Income                                           (42,877)        707,037
Depreciation                                                         8,370          8,367
Decrease/(Increase) in Debtors                                       5,151       (18,647)
Increase in operating creditors                                  1,763,135      1,007,297
(Decrease)/Increase in Provision for Liabilities & Charges     (2,826,000)      1,550,490
Impairment/Write off of Minerals Interests                               -        102,747
Decrease in Revaluation Reserve                                          -    (1,408,750)
Net Cash Flow from Operating Activities                        (1,092,221)      1,948,541


Note 7 Analysis of Net Debt


                             At 1 Jan 2003      Cash Flow    At 31 Dec 2003
                                       US$            US$               US$
Cash at Bank and in hand         8,040,751    (3,466,261)         4,574,490
Debt due after 1 year          (1,431,903)      (298,258)       (1,730,161)
Debt due within 1 year            (98,617)       (11,005)         (109,622)
                                 6,510,231    (3,775,524)         2,734,707


Note 8 Reconciliation of Net Cash flow to Movement in Net Debt


                                                                     2003           2002
                                                                      US$            US$
(Decrease)/Increase in cash during the year                   (3,466,261)      6,801,221
(Inflow)/Outflow from movements in debt & lease financing       (309,263)        970,484
Movement in net cash in the year                              (3,775,524)      7,771,705
Net cash/(debt) at start of year                                6,510,231    (1,261,474)
Net cash at end of year                                         2,734,707      6,510,231


Note 9 2003 Annual Report and Accounts

The Annual Report and Accounts will be posted to shareholders in due course.


19 April, 2004


                      This information is provided by RNS
            The company news service from the London Stock Exchange
END

FR IFMFTMMABBBI
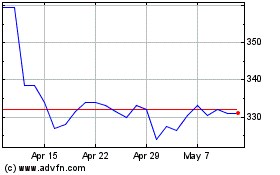
Kenmare Resources (LSE:KMR)
Historical Stock Chart
From Jun 2024 to Jul 2024

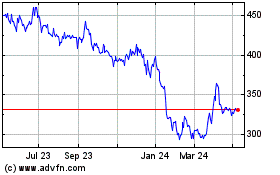
Kenmare Resources (LSE:KMR)
Historical Stock Chart
From Jul 2023 to Jul 2024
