Dreyfus Strategic Municipals, Inc. (LEO) Releases Fund Statistics
April 21 2006 - 3:01PM
Business Wire
The following information for Dreyfus Strategic Municipals, Inc.
(NYSE: LEO) is as of March 31, 2006 (except as otherwise noted),
and is subject to change at any time. All percentages are based on
total net assets. -0- *T Dreyfus Strategic Municipals, Inc. Symbol
: "LEO" As of March 31, 2006 Sector Distribution Portfolio Overview
(Top Five) ------------------ ------------------- (As a percentage
of Subject to AMT 22% net assets) Number of Issues 175
------------------- Average maturity 20.07 years Health Care 13%
Effective maturity 7 years Transportation 11% Duration 5.042
Utility-Electric Average rating* A+ Revenue 11% Average coupon
6.023 Education 7% Average dollar price $102.699 General
Obligations 7% Pre-refunded securities 16.63% Leverage 34% State
Distribution (Top Five) ----------------------------- (As a
percentage of net assets) --------------------- Illinois 9% Texas
8% Market Summary California 7% -------------- Wisconsin 5% Market
price range (52 New York 4% weeks) $8.21-$9.20 NAV range (52 weeks)
$9.17-$9.52 Market price $8.88 NAV $9.29 Call Schedule
Premium/(discount) (4.413) (Through 2009) Average daily volume (52
--------------- weeks) 81,139 2006 13% Shares outstanding 60.59mm
2007 2% Net assets $847,946,043 2008 4% 2009 8% 2010 6% Portfolio
Quality* ------------------ Market Yield and AAA 35% Dividend
Rate** AA 9% ---------------- A 13% Current market yield 5.66% BBB
28% Current dividend rate $0.042 Below investment grade 15% * The
percentages of these ratings are **The market yield is calculated
based on the higher of calculated by multiplying Standard &
Poor's or Moody's for the current market individual issues and on a
Dreyfus distribution by 12 and rating for non-rated issues.
dividing by the market price per share of $8.88 as of March. 31,
2006. Past Performance is no guarantee of future performance and
price and yield will vary. *T
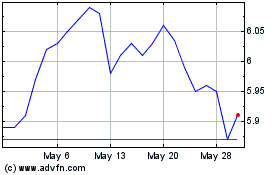
BNY Mellon Strategic Mun... (NYSE:LEO)
Historical Stock Chart
From Jun 2024 to Jul 2024

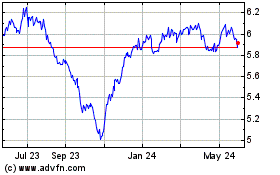
BNY Mellon Strategic Mun... (NYSE:LEO)
Historical Stock Chart
From Jul 2023 to Jul 2024
