‘FLOKI Master Plan’: Crypto Analyst Predicts 2,000% Jump For The Shiba Inu Competitor
October 04 2024 - 4:30PM
NEWSBTC
Despite being in a downward trend all week, Floki (FLOKI) remains
significantly bullish, according to a crypto analyst. Basing his
analysis on similarities between past price movements, the analyst
has outlined a master plan for Floki, predicting that the popular
meme coin and Shiba Inu competitor is set for a 2,000% surge.
Analyst Reveals The Floki Master Plan In a recent X (formerly
Twitter) post, crypto analyst, ‘Master Kenobi’ discussed Floki’s
past price movements, identifying a unique recurring chart pattern
that could indicate a future price spike for the cryptocurrency.
The analyst predicted that if Floki can continue this recurring
pattern, a massive price pump could happen around October 22.
Related Reading: Crypto Capo Returns After 2 Months To Predict
Ethereum Decline To $1,800, Is It Time To Go Long? According to the
analyst, the Viking-themed meme coin experienced a sharp rise of
about 92X over 112 days starting from July 5, 2021, followed by a
long decline spanning 224 days, where its price crashed by a
whopping 98.5%, reaching its bottom. Notably, the analyst
asserted that after hitting that strategic low point, Floki had
entered a more structured growth phase. On the Floki chart, Kenobi
also identified three periods of price consolidation represented by
distinctive purple triangles with similar heights but varying
lengths. The analyst disclosed that inside these triangles,
the price behavior of Floki becomes relatively predictable, marked
by a red triangle. The lower half of this red triangle is seen as
the best accumulation zone for investors, reflecting the most
optimal entry point for Floki’s next upward move. Kenobi
identified a recurring pattern where Floki typically exited this
triangle around October 22 each year, representing the beginning of
a new phase of consolidation followed by a massive price pump. He
noted that this price pump is often signaled 35 days before the
formation of the aforementioned red triangle. Continuing on
this trend, the Shiba Inu competitor experienced another 11X
increase 112 days after exiting the purple triangle on October 24,
2024. Similarly, after the meme coin moved out of the purple
triangle on October 24 2023, it jumped 22X in 133 days. Based
on this recurring pattern, Kenobi has suggested that Floki’s
“magical date” for a potential bullish surge is likely around
October 22. The analyst has forecasted that if the pattern holds,
investors should expect a price rise followed by 3 months of strong
consolidation. A 2,000% Price Pump To $0.002 Based on
Kenobi’s observations highlighted above, he predicts that Floki
could either witness a 1,000% surge to new highs or a 2,100%
increase. The analyst disclosed that if the first scenario in 2021
repeats, after 112 days of consolidation, Floki could see its price
skyrocketing by 11X to reach $0.0011. Additionally, its market
capitalization is expected to increase to above $12 billion.
Related Reading: Crypto Analyst Says Solana-Based BONK Is In Prime
Position For Legendary Rally In contrast, if the second trend
pattern in 2023 occurs this year, the price of Floki could jump to
$0.0023 in 133 days, marking a 22X increase and a rise in its
market capitalization to $25 billion. Despite Floki declining
by over 21% this past week and plummeting again by 1.29% in the
last 24 hours, Kenobi has confidently stated that his bullish
projections are a “perfectly achievable and realistic” goal for the
meme coin, which, as of writing, is trading at $0.00013.
Featured image created with Dall.E, chart from Tradingview.com
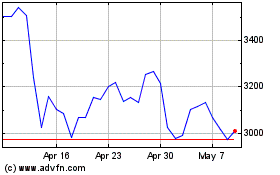
Ethereum (COIN:ETHUSD)
Historical Stock Chart
From Dec 2024 to Jan 2025

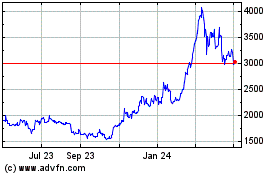
Ethereum (COIN:ETHUSD)
Historical Stock Chart
From Jan 2024 to Jan 2025
