Bitcoin STH Realized Profit Reveals Strong Support Level – Time For A Breakout?
February 18 2025 - 6:00AM
NEWSBTC
Bitcoin’s short-term price direction remains uncertain as the
market struggles to confirm its next move. Analysts and investors
are divided, with some calling for a breakout into new all-time
highs while others anticipate renewed selling pressure into lower
prices. The price has been consolidating in a narrow range for the
past twelve days, holding above the $94,000 demand level and facing
resistance below the $100,000 mark. Related Reading: Are Meme Coins
Hurting Solana? Rising Selling Pressure Sparks Investor Concerns
Key data from CryptoQuant reveals that the nearest support zone for
BTC is forming between $91,000 and $95,000. This range is
reinforced by two critical technical indicators: the 111-day simple
moving average (SMA 111D), currently at $95,000, and the Short-Term
Holder (STH) Realized Price, which sits at $91,000. These levels
suggest that BTC is trading above historically significant support
areas, where short-term holders have realized their profits or
losses. While the long-term structure remains bullish, investors
are growing impatient as BTC fails to reclaim key resistance
levels. If Bitcoin can push above $100K in the coming days,
analysts expect a rally into price discovery. However, losing
support around $94K–$95K could trigger increased selling pressure
and a deeper correction into lower demand zones. Bitcoin Prepares
For A Decisive Move Bitcoin’s recent consolidation phase has fueled
speculation about a potential breakout, with many analysts
suggesting that the market is witnessing the calm before the storm.
While short-term direction remains uncertain, the long-term bullish
structure remains intact, and many expect BTC to make a strong move
toward new all-time highs soon. Crypto analyst Axel Adler shared
key CryptoQuant data on X, highlighting that Bitcoin’s nearest
support zone is forming around $91,000–$95,000. This range is
significant because it aligns with the 111-day simple moving
average (SMA 111D) at $95,000 and the Short-Term Holder (STH)
Realized Price at $91,000. These levels represent areas where
short-term holders have historically realized profits or losses,
making them crucial for maintaining bullish momentum. On the
resistance side, Adler notes that Bitcoin faces a key supply zone
between $98,000 and $101,000. This area is defined by the aggregate
exit prices of holders with a holding period of one week to one
month at $100,800 and those with a one- to three-month holding
period at $98,200. Related Reading: Ethereum Forms A Bullish
Pattern – Expert Reveals Short-Term Price Target As BTC continues
to trade within this narrow range, investors are closely watching
these levels for a decisive breakout. A push above $101K could
trigger a rally into price discovery. While losing support at $91K
could lead to further downside. BTC Bulls Face A Big Test Bitcoin
is trading at $95,600 after nearly two weeks of sideways movement
within a narrow range, fluctuating less than 4% in either
direction. This extended period of consolidation has left traders
on edge, as they await a decisive move in either direction. For BTC
to maintain its bullish structure, the $95,000 level must hold.
This price point aligns with technical support, and a break below
it could signal strong selling pressure. Bulls face a critical test
at this stage, as they must defend this support and initiate a push
above key resistance levels. To confirm a breakout, Bitcoin needs
to reclaim the $98,000 mark and, ultimately, the psychologically
significant $100,000 level. A successful move above these levels
would provide the momentum needed to challenge all-time highs and
re-enter price discovery. However, failure to hold $95K could
trigger a downside move, with BTC potentially testing support zones
closer to $91K. Related Reading: Dogecoin Pulls Back To ‘The Golden
Ratio’ – Analyst Expects A Bullish Reversal As Bitcoin
consolidates, traders remain cautious, watching for volume spikes
and increased buying pressure to confirm the next price movement.
The coming days will be crucial in determining whether BTC resumes
its uptrend or faces further correction. Featured image from
Dall-E, chart from TradingView
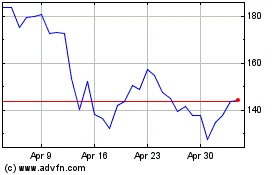
Solana (COIN:SOLUSD)
Historical Stock Chart
From Jan 2025 to Feb 2025

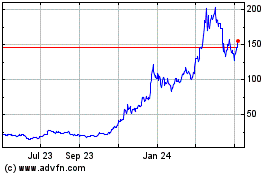
Solana (COIN:SOLUSD)
Historical Stock Chart
From Feb 2024 to Feb 2025
