Fantom (FTM) Poised For Massive Bull Run, Analyst’s 234% Rally Prediction Raises Eyebrows
August 12 2024 - 2:00AM
NEWSBTC
Fantom (FTM) might be up for a huge price breakout shortly after an
analyst – Javon Marks – made public his prognosis of the altcoin.
Related Reading: Solana Price (SOL) Slips to $140: Will This Level
Support a Rebound? Posting in X, Marks attributed this to the
formation of a Hidden Bullish Divergence in the FTM chart.
According to the analyst, this has the potential to cause a
significant rebound in the token, including a 234% upside. At the
time of writing, FTM was trading at $0.3278, down 6.7% in the last
24 hours, but sustained a 12.7% rally in the last week, data from
Coingecko show. Early Stages Of An Uptrend Fantom has only begun
retracement, as price action has become quite cognizant with the
asset. The price has experienced some swings, going down to mark a
lower low, something that Marks pointed out earlier before giving a
massive continuation rally. With this background, Marks assumed
that FTM is probably in the early stages of an uptrend that should
undo all prior losses and potentially more. $FTM (Fantom) after
recently confirming a Hidden Bullish Divergence, has retraced but
has done this once before before entering a massive continuation
and can be doing so again! With this confirmation we could watch
for an over 234% recovery move before a continuation towards…
https://t.co/Aw7KebzRMN pic.twitter.com/ANe8biPB75 — JAVON⚡️MARKS
(@JavonTM1) August 11, 2024 Fantom Bullish Divergence A bullish
divergence in technical analysis, is where the price makes a lower
low while the oscillator shows higher values. In such a scenario,
there is a warning that the price of the asset is prone to reverse
and always carries a hint of the weakness in the bears while
cautioning that the bulls are getting stronger. According to the
technical signal of Marks, if the price plays through in the way
outlined above, Fantom may explode to 234% and further. This in
itself will not only be a huge bounce for the token but might be
the perfect opening to shunt the token to a crucial level of $3.
Whether such recovery is in place or not remains to be seen,
something that traders and investors are discussing and most are
now watching closely these price fluctuations of Fantom. Since the
market of cryptocurrencies is so unpredictable, any sudden move
like the Hidden Bullish Divergence could help in creating major
market trends with the help of this technical indicator. Fantom
Price Forecast The altcoin has been signaling a potential uptrend
that could be achieved in the next seven days. The momentum, mostly
driven by buy signals which keep mounting in the key technical
indicators, is already happening. According to the price prediction
data from CoinCheckup, bullish crossovers have taken place with the
relative strength index pointing upwards in a direction towards
overbought territory. This is a prelude to what is seen as a very
strong upward push in the nearest term with respect to the price.
In three months, Fantom is forecasted to have 38.87% growth in
value on the back of positive market sentiment and growing trading
volumes, CoinCheckup figures show. Related Reading: XRP Price
Reaches Support: Will It Trigger a Turnaround? Supported by such
historical price patterns and Fibonacci retracement levels, FTM is
about to break past several key resistance levels. Further ahead,
its in-one-year prediction shows a massive growth of 207%, placing
the altcoin as one of the very attractive investments for people
who will be looking at long-term returns. Featured image from
Entrepreneur, chart from TradingView
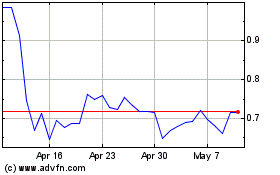
Fantom Token (COIN:FTMUSD)
Historical Stock Chart
From Nov 2024 to Dec 2024

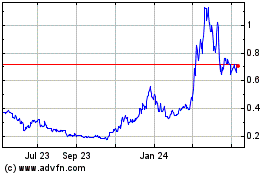
Fantom Token (COIN:FTMUSD)
Historical Stock Chart
From Dec 2023 to Dec 2024
