false 0001717307 0001717307 2023-11-13 2023-11-13 iso4217:USD xbrli:shares iso4217:USD xbrli:shares


UNITED STATES
SECURITIES AND EXCHANGE COMMISSION

WASHINGTON, D.C. 20549


FORM 8-K


CURRENT REPORT PURSUANT
TO SECTION 13 OR 15(d) OF THE
SECURITIES EXCHANGE ACT OF 1934


Date of report (Date of earliest event reported): November 13, 2023


Industrial Logistics Properties Trust

(Exact Name of Registrant as Specified in Its Charter)


Maryland

(State or Other Jurisdiction of Incorporation)


001-38342   82-2809631
(Commission File Number)   (IRS Employer Identification No.)


Two Newton Place    
255 Washington Street, Suite 300    
Newton, Massachusetts   02458-1634
(Address of Principal Executive Offices)   (Zip Code)


617-219-1460

(Registrant’s Telephone Number, Including Area Code)


Check the appropriate box below if the Form 8-K filing is intended to simultaneously satisfy the filing obligation of the registrant under any of the following provisions:


¨Written communications pursuant to Rule 425 under the Securities Act (17 CFR 230.425)

¨Soliciting material pursuant to Rule 14a-12 under the Exchange Act (17 CFR 240.14a-12)

¨Pre-commencement communications pursuant to Rule 14d-2(b) under the Exchange Act (17 CFR 240.14d-2(b))

¨Pre-commencement communications pursuant to Rule 13e-4(c) under the Exchange Act (17 CFR 240.13e-4(c))


Securities Registered Pursuant to Section 12(b) of the Act:


Title of each class   Trading Symbol(s)   Name of each exchange on which registered
Common Shares of Beneficial Interest   ILPT   The Nasdaq Stock Market LLC


Indicate by check mark whether the registrant is an emerging growth company as defined in Rule 405 of the Securities Act of 1933 (§230.405 of this chapter) or Rule 12b-2 of the Securities Exchange Act of 1934 (§240.12b-2 of this chapter).


Emerging growth company ¨


If an emerging growth company, indicate by check mark if the registrant has elected not to use the extended transition period for complying with any new or revised financial accounting standards provided pursuant to Section 13(a) of the Exchange Act. ¨


Item 7.01.Regulation FD Disclosure.


On November 13, 2023, Industrial Logistics Properties Trust posted to its website an investor presentation, a copy of which is attached hereto as Exhibit 99.1.


Item 9.01.Financial Statements and Exhibits.


(d)Exhibits.


99.1   Investor Presentation dated November 13, 2023. (Furnished herewith.)
     
104   Cover Page Interactive Data File. (Embedded within the Inline XBRL document.)


SIGNATURES


Pursuant to the requirements of the Securities Exchange Act of 1934, the registrant has duly caused this report to be signed on its behalf by the undersigned hereunto duly authorized.


  INDUSTRIAL LOGISTICS PROPERTIES TRUST
     
     
  By: /s/ Tiffany R. Sy
  Name: Tiffany R. Sy
  Title: Chief Financial Officer and Treasurer


Dated:  November 13, 2023


Exhibit 99.1

GRAPHIC

INDUSTRIAL LOGISTICS PROPERTIES TRUST November 2023 510 John Dodd Road Spartanburg, SC 1,015,740 Square Feet ILPT Ownership: 100% INVESTOR PRESENTATION

GRAPHIC

2 INDUSTRIAL LOGISTICS PROPERTIES TRUST This presentation contains forward-looking statements within the meaning of the Private Securities Litigation Reform Act of 1995 and other securities laws that are subject to risks and uncertainties. These statements may include words such as “believe”, “expect”, “anticipate”, “intend”, “plan”, “estimate”, “will”, “may” and negatives or derivatives of these or similar expressions. These forward-looking statements include, among others, statements about: ILPT’s expectations that e-commerce will continue to stimulate demand for industrial and logistics properties and that strong absorption and rent growth and high occupancy will continue; and ILPT’s future leasing activity and pipeline. Forward-looking statements reflect ILPT’s current expectations, are based on judgments and assumptions, are inherently uncertain and are subject to risks, uncertainties and other factors, which could cause ILPT’s actual results, performance or achievements to differ materially from expected future results, performance or achievements expressed or implied in those forward-looking statements. Some of the risks, uncertainties and other factors that may cause its actual results, performance or achievements to differ materially from those expressed or implied by forward-looking statements include, but are not limited to, the following: demand for industrial and logistics properties; ILPT’s ability and the ability of its tenants to operate under unfavorable market and economic conditions, such as rising or sustained high interest rates, high inflation, labor market challenges, disruption and volatility in the public equity and debt markets, challenges in the commercial real estate industry generally and in the industrial and logistics sector, global geopolitical hostilities and tensions and economic recessions or downturns; ILPT’s ability to successfully compete for tenancies; the likelihood that the rents it realizes will increase when ILPT renews or extends its leases, enters new leases, or its rents reset at ILPT’s properties in Hawaii; whether ILPT’s tenants will renew or extend their leases or that ILPT will be able to obtain replacement tenants on terms as favorable to it as the terms of its existing leases; ILPT’s ability to maintain high occupancy at its properties; ILPT’s tenant and geographic concentrations; ILPT’s ability to reduce its leverage, generate cash flow and take advantage of mark-to-market leasing opportunities; ILPT’s ability to cost-effectively raise and balance its use of debt or equity capital; ILPT’s ability to purchase cost effective interest rate caps; ILPT’s ability to pay interest on and principal of its debt; ILPT’s ability to maintain sufficient liquidity; non-performance by the counterparties to its interest rate caps and the costs for renewing or replacing the interest rate caps; ILPT’s tenants’ ability and willingness to pay their rent obligations to ILPT; the credit qualities of ILPT’s tenants; changes in the security of cash flows from ILPT’s properties; potential defaults of its leases by its tenants; changes in global supply chain conditions and emerging technologies; whether the industrial and logistics sector and the extent to which ILPT’s tenants’ businesses are critical to sustaining a resilient supply chain and that ILPT’s business will benefit as a result; acts of terrorism, outbreaks or continuation of pandemics or other significant adverse public health safety events or conditions, war or other hostilities, supply chain disruptions, climate change or other manmade or natural disasters beyond ILPT’s control; ILPT’s ability to pay distributions to its shareholders and to increase or sustain the amount of such distributions; ILPT’s ability to sell properties at prices it targets; ILPT’s ability to complete pending sales without delay, or at all, at existing agreement terms; ILPT’s ability to prudently pursue, and successfully and profitably complete, expansion and renovation projects at its properties and to realize its expected returns on those projects; ILPT's expected capital expenditures and leasing costs, as well as risks and uncertainties regarding the development, redevelopment or repositioning of ILPT’s properties, including as a result of inflation, cost overruns, supply chain challenges, labor shortages, construction delays or inability to obtain necessary permits, and ILPT’s ability to lease space at these properties at targeted returns; ILPT’s ability to sell additional equity interests in, or contribute additional properties to, its existing joint ventures, or enter into additional, real estate joint ventures or to attract co-venturers and benefit from its existing joint ventures or any real estate joint ventures ILPT may enter into; the ability of ILPT’s manager, The RMR Group LLC, or RMR, to successfully manage it; changes in environmental laws or in their interpretations or enforcement as a result of climate change or otherwise, or ILPT’s incurring environmental remediation costs or other liabilities; competition within the commercial real estate industry, particularly for industrial and logistics properties in those markets in which ILPT’s properties are located; compliance with, and changes to, federal, state and local laws and regulations, accounting rules, tax laws and similar matters; limitations imposed on ILPT’s business and its ability to satisfy complex rules in order for ILPT to maintain its qualification for taxation as a REIT for U.S. federal income tax purposes; actual and potential conflicts of interest with ILPT’s related parties, including its managing trustees, RMR and others affiliated with them; ILPT’s ability to acquire properties that realize ILPT’s targeted returns; and other matters. These risks, uncertainties and other factors are not exhaustive and should be read in conjunction with other cautionary statements that are included in ILPT’s periodic filings. The information contained in ILPT’s filings with the Securities and Exchange Commission, or SEC, including under the caption “Risk Factors” in ILPT’s periodic reports, or incorporated therein, identifies important factors that could cause differences from ILPT’s forward-looking statements in this presentation. ILPT’s filings with the SEC are available on the SEC’s website at www.sec.gov. You should not place undue reliance upon ILPT’s forward-looking statements. Except as required by law, ILPT does not intend to update or change any forward-looking statements as a result of new information, future events or otherwise. Notes Regarding Certain Information in this Presentation This presentation contains industry and statistical data that ILPT obtained from various third party sources. Nothing in the data used or derived from third party sources should be construed as investment advice. Some data and other information presented are also based on ILPT’s good faith estimates and beliefs derived from its review of internal surveys and independent sources and its experience. ILPT believes that these external sources, estimates and beliefs are reliable and reasonable, but it has not independently verified them. Although ILPT is not aware of any misstatements regarding the data presented herein, these estimates and beliefs involve inherent risks and uncertainties and are based on assumptions that are subject to change. Unless otherwise noted, (1) all data presented are as of or for the three months ended September 30, 2023, (2) references to “weighted average” mean a weighted average by annualized rental revenues and (3) references to “annualized rental revenues” mean the annualized contractual rents, as of September 30, 2023, including straight line rent adjustments and excluding lease value amortization, adjusted for tenant concessions, including free rent and amounts reimbursed to tenants, plus estimated recurring expense reimbursements from tenants (annualized rental revenues may differ from actual historical rental revenues calculated pursuant to U.S. Generally Accepted Accounting Principles, or GAAP). Non-GAAP Financial Measures This presentation contains non-GAAP financial measures including FFO and Normalized FFO Attributable to Common Shareholders, EBITDA, EBITDAre, Adjusted EBITDAre, NOI and Cash Basis NOI. Calculations of, and reconciliations for these metrics to the closest GAAP metrics, are included in an Appendix hereto. Please refer to Definitions in the Appendix for terms used throughout this presentation. WARNING REGARDING FORWARD LOOKING STATEMENTS, DISCLAIMERS AND NON-GAAP FINANCIAL MEASURES

GRAPHIC

3 INDUSTRIAL LOGISTICS PROPERTIES TRUST 3 U.S. REIT with 413 Industrial & Logistics Properties ILPT AT A GLANCE Industrial Logistics Properties Trust (Nasdaq: ILPT) is a REIT focused on owning and leasing high quality distribution and logistics properties. More than 75% of ILPT’s annualized rental revenues are derived from investment grade tenants, tenants that are subsidiaries of investment grade rated entities or Hawaii land leases. 30% Annualized Rental Revenues from FedEx 60 Million Rentable Square Feet Located in 39 States 8 Years of Weighted Average Remaining Lease Term (by annualized revenue) 77% Annualized Rental Revenues from Investment Grade Tenants/Subsidiaries or Hawaii Land Leases 99% Occupancy 28% Annualized Rental Revenues from Properties in Hawaii

GRAPHIC

4 INDUSTRIAL LOGISTICS PROPERTIES TRUST 29 Other States, 31.0% HI, 28.0% OH, 7.6% IN, 5.6% SC, 5.2% FL, 5.0% GA, 4.7% TX, 4.3% NJ, 3.4% TN, 2.9% NC, 2.3% GEOGRAPHIC DIVERSITY WITH A UNIQUE HAWAIIAN FOOTPRINT Location and Number of Properties Geographic Mix of Annualized Rental Revenues • 187 industrial and logistics properties located in 38 states. • 43.3 million square feet that is 99.3% leased with a 6.3 year weighted average lease term (WALT) (by annualized rental revenues). • Accounts for 72% of annualized rental revenues. • Leases typically include fixed rent increases. • Tenants have invested significantly in improvements. • 226 well-located properties near Oahu’s prime CBD. • 16.7 million square feet that is 97.8% leased with a 13.2 year WALT (by annualized rental revenues). • Accounts for 28% of annualized rental revenues. • Leases typically include fixed rent increases or periodic rent resets to fair market value. • Location and scarcity of land continues to drive portfolio value. Mainland Properties Hawaii Properties 226 3 2 4

GRAPHIC

5 SELECT PORTFOLIO PROPERTIES 8411 Florida Mining Boulevard Tampa, FL 174,975 Square Feet ILPT Ownership: 61% 900 Commerce Parkway West Drive Greenwood, IN 294,388 Square Feet ILPT Ownership: 100% 2552 South 98th Street Edwardsville, KS 280,019 Square Feet ILPT Ownership: 61% 3350 Laurel Ridge Avenue Ruskin, FL 1,017,693 Square Feet ILPT Ownership: 22% INDUSTRIAL LOGISTICS PROPERTIES TRUST

GRAPHIC

6 INDUSTRIAL LOGISTICS PROPERTIES TRUST 0% 2% 4% 6% 8% 10% 12% 14% 16% $0 $1,000 $2,000 $3,000 $4,000 $5,000 $6,000 $7,000 $8,000 11' 12' 13' 14' 15' 16' 17' 18' 19' 20' 21' 22' In-Store Sales U.S. E-commerce Sales % Online $0 $200 $400 $600 $800 $1,000 $1,200 11' 12' 13' 14' 15' 16' 17' 18' 19' 20' 21' 22' GROWTH IN E-COMMERCE DRIVING INCREMENTAL INDUSTRIAL DEMAND E-commerce will continue to drive demand for industrial and logistics properties, support rent growth and sustain a favorable investment environment. (1) Source: U.S. Census Bureau as of May 18, 2023. ($B) ($B) U.S. E-Commerce Sales(1) U.S. Retail Sales Composition & E-Commerce as a % of Total(1)

GRAPHIC

INDUSTRIAL LOGISTICS PROPERTIES TRUST SELECT PORTFOLIO PROPERTIES 309 Dulty’s Lane Burlington, NJ 633,836 Square Feet ILPT Ownership: 100% INDUSTRIAL LOGISTICS PROPERTIES TRUST 725 Darlington Avenue Mahwah, NJ 167,424 Square Feet ILPT Ownership: 100% 13509 Waterworks Street Jacksonville, FL 304,859 Square Feet ILPT Ownership: 100% 5300 Centerpoint Parkway Groveport, OH 581,342 Square Feet ILPT Ownership: 100%

GRAPHIC

8 INDUSTRIAL LOGISTICS PROPERTIES TRUST Warehouse & Distribution: 66% Ground Lease: 28% Light Manufacturing: 6% HIGH QUALITY INDUSTRIAL PROPERTIES Property Type % of Annualized Rental Revenues Tenant Industry Type % of Portfolio Transportation & Shipping 37.5 Automotive 8.8 Construction & Building Materials 8.5 Food & Beverage 8.0 E-Commerce 7.4 Real Estate & Financial 5.1 Wholesale Trade 4.7 Commercial & Electronic Equipment 2.8 Manufacturing 2.4 Energy 2.2 Paper & Packaging 1.7 Technology & Communications 1.6 Furniture 1.5 Other 7.8 Total 100% Highly functional industrial properties leased to tenants in thriving industries and well located Hawaii land. Approximately 90% of Mainland rental revenues are generated by logistics facilities.

GRAPHIC

9 INDUSTRIAL LOGISTICS PROPERTIES TRUST STRONG CREDIT QUALITY AND DIVERSIFIED TENANT BASE More than 75% of annualized rental revenues are derived from investment grade tenants/subsidiaries or from secure Hawaii land leases. Tenant Credit Characteristics % of Annualized Rental Revenues Other Unrated or Non-IGR Other Leased Hawaii Lands Investment Grade Rated: 18% Subsidiaries of Investment Grade Rated Parent Entities: 38% Other Leased Hawaii Lands: 21% Other Unrated or Non-Investment Grade: 23% Top 10 Tenants % of Total Annualized Rental Revenues 1 FedEx Corporation 29.8% 2 Amazon.com, Inc. 6.7% 3 The Home Depot, Inc. 2.1% 4 UPS 1.6% 5 Restoration Hardware, Inc. 1.5% 6 Servco Pacific, Inc. 1.4% 7 American Tire Distributors, Inc. 1.4% 8 Par Pacific Holdings Inc. 1.2% 9 TD SYNNEX Corporation 1.1% 10 Berkshire Hathaway Inc. 1.0% Total 47.8%

GRAPHIC

10 INDUSTRIAL LOGISTICS PROPERTIES TRUST RECENT BUSINESS HIGHLIGHTS Full Year 2022 (1) Same Property Cash Basis NOI Rental Rates Leasing Activity +1.0% +37.1% Leasing Activity WALT (by Sq. Ft.) 8.0 years Same Property NOI +2.6% 5,573,000 SF 10 +4.9% +20.8% 7.8 years 3,868,000 SF Year to Date 2023 +3.4% (1) In Q2 2022, ILPT entered into an agreement with Home Depot U.S.A., Inc. to lease a property in Hawaii with 2.2 million rentable square feet. In Q1 2023, the tenant exercised its option to terminate the agreement prior to lease commencement.

GRAPHIC

11 INDUSTRIAL LOGISTICS PROPERTIES TRUST Mountain Industrial JV (1) Consolidated ILPT 61% Ownership 94 Properties 99.2% Occupancy $33.2M NOI $31.7M Cash Basis NOI $30.7M Adjusted EBITDAre $3.2B Total Gross Assets (1) Amounts represent this joint venture at 100%, not ILPT’s proportionate share thereof. INVESTMENT PORTFOLIO Q3 2023 RESULTS $1.7B Total Debt (Principal) Mainland Properties 92 Properties 99.4% Occupancy $29.3M NOI $29.2M Cash Basis NOI $26.8M Adjusted EBITDAre $1.9B Total Gross Assets $1.7B Total Debt (Principal) Hawaii Properties 226 Properties 97.8% Occupancy $22.6M NOI $20.5M Cash Basis NOI $21.6M Adjusted EBITDAre $723.3M Total Gross Assets $862.9M Total Debt (Principal) 100% Ownership $9.5M Normalized FFO -$4.0M Normalized FFO $0.5M Normalized FFO 21,000 SF Leasing Activity +9.9% Rental Rates 272,000 SF Leasing Activity +8.0% Rental Rates 465,000 SF Leasing Activity +18.7% Rental Rates 11

GRAPHIC

1.7 2.0 0.8 77.5% 29.6% 13.5% -20.0% 30.0% 80.0% 130.0% 180.0% 0.0 0.5 1.0 1.5 2.0 2.5 Q3 2022 Q2 2023 Q3 2023 Total Leasing (msf) Rent Roll-Up PROACTIVE ASSET MANAGEMENT AND LEASING Leasing Activity Square Footage in Millions INDUSTRIAL LOGISTICS PROPERTIES TRUST ILPT has executed nearly four million square feet of leasing year to date and has a strong leasing pipeline with continued demand for its high quality portfolio. 12 WALT by SF (years) 8.9 4.1 31 Transactions 5.0 Million Total Square Feet Leasing Pipeline 1.7 Million Square Feet in Advanced Stages of Negotiation 4.9

GRAPHIC

LEASE EXPIRATIONS AND RENT RESETS BY INVESTMENT PORTFOLIO INDUSTRIAL LOGISTICS PROPERTIES TRUST 13 Hawaii Property Expirations and Resets % Total ILPT Annualized Rental Revenues Mountain Joint Venture Expirations % Total ILPT Annualized Rental Revenues Wholly Owned Mainland Property Expirations % Total ILPT Annualized Rental Revenues Total Consolidated Portfolio Expirations and Resets % Total ILPT Annualized Rental Revenues 0.7% 4.6% 3.1% 3.2% 5.6% Q4 2023 2024 2025 2026 2027 0.0% 0.6% 3.1% 2.3% 5.0% Q4 2023 2024 2025 2026 2027 0.2% 2.0% 0.6% 1.3% 1.7% Q4 2023 2024 2025 2026 2027 Hawaii Expirations Hawaii Resets 0.9% 7.2% 6.8% 6.8% 12.3% Q4 2023 2024 2025 2026 2027 Total Mainland Lease Expirations Total Hawaii Expirations and Resets

GRAPHIC

DEBT SUMMARY 14 Secured Floating Rate Debt $1.2B JV Secured Floating Rate Debt $1.4B Secured Fixed Rate Debt $1.7B $4.4 $2,653.1 $18.8 $19.5 $20.2 $1,614.4 2023 2024 2025 2026 2027 2028+ INDUSTRIAL LOGISTICS PROPERTIES TRUST Key Facts Debt Maturity Total Consolidated Debt Current Estimated Quarterly Interest Expense Run-Rate • Total consolidated debt of $4.3 billion. • Weighted average debt maturity term of 5.3 years, including extension options. • Next material debt maturity is March 2027, assuming extension options are exercised. (1) • Weighted average interest rate on debt of 5.5%. • Consolidated net debt to annualized Adjusted EBITDAre of 12.3x. (1) Includes $2.635 billion of loans that mature in 2024 and have three one-year extension options available to be exercised, subject to meeting certain conditions including purchases of interest rate caps for each extension period. (2) Assuming short term interest rates remain at or above the strike rate on ILPT’s interest rate caps. (3) Represents the amortization of the premium ILPT paid to acquire its interest rate caps over their terms in accordance with GAAP, offset by the cash ILPT expects to receive from its interest rate caps, assuming short term interest rates remain at Q3 2023 levels. ($ in Millions) ($ in Millions) (1) Note: Table above includes principal payments of ILPT’s amortizing loans. Interest Payments (2) $ 76.5 Interest Rate Caps, Net (3) (10.0) Non-Cash Deferred Finance Fee Amortization 6.5 Total Estimated Quarterly Interest Expense Run-Rate $ 73.0

GRAPHIC

JOINT VENTURES $30.7 Million $12.4 Million Mountain Industrial REIT LLC 22% / 78% Number of Properties Square Feet Adjusted EBITDAre (1) 61% / 39% 94 18 20,981,000 SF 11,726,000 SF ILPT/JV Ownership The Industrial Fund REIT LLC Raise capital at property net asset value. Grow relationships with new and existing investors. Target opportunistic acquisitions. INDUSTRIAL LOGISTICS PROPERTIES TRUST (1) Amounts represent these joint ventures at 100%, not ILPT’s proportionate share thereof. 15

GRAPHIC

16 INDUSTRIAL LOGISTICS PROPERTIES TRUST RMR’s Operations Include: National Multi-Sector Investment Platform OFFICE INDUSTRIAL GOVERNMENT MEDICAL OFFICE LIFE SCIENCE SENIOR LIVING HOTELS SERVICE RETAIL RMR Managed Companies Over 20,000 Employees Over 2,000 Properties More than $5 billion in Annual Revenues Approximately $36 billion in AUM Over 600 CRE Professionals More than 30 Offices Throughout the U.S. Financial Services: Real Estate Services: Business Services: Accounting Acquisitions/ Dispositions Administration Capital Markets Asset Management Human Resources Compliance/ Audit Construction/ Development Information Technology (IT) Finance/ Planning Engineering Investor Relations Treasury Leasing Marketing Tax Property Management Legal/ Risk Management MANAGED BY THE RMR GROUP LLC, AN ALTERNATIVE ASSET MANAGER The RMR Group LLC

GRAPHIC

17 INDUSTRIAL LOGISTICS PROPERTIES TRUST • Base Business Management Fee: 0.5% multiplied by the lower of (i) gross historical cost or (ii) average market capitalization.(1) • Property Management Fees: 3% of gross collected rents and 5% of construction costs. • Incentive Management Fee: 12% of the outperformance of ILPT’s total return per share compared to the MSCI U.S. REIT/Industrial REIT Index over a three year period multiplied by equity market capitalization.(2) (1) The first $250 million of growth is subject to a fee based on 0.7%. (2) The measurement periods are generally three year periods ending with the year for which the incentive management fee is being calculated. • If ILPT’s stock price goes up and its total market cap exceeds its historical cost of real estate; RMR base management fee is capped at 50 bps of historical cost of real estate. • If ILPT’s stock price goes down and its historical cost of real estate exceeds its total market cap; RMR gets less base management fee (50 bps on equity market cap plus debt). • Incentive fee structure keeps RMR focused on increasing total shareholder return. • Members of RMR senior management are holders of ILPT stock, some subject to long term lock up agreements. • ILPT shareholders have visibility into RMR, a publicly traded company. • ILPT benefits from RMR’s national footprint and economies of scale of a $36 billion platform. Key Terms of Management Agreements MANAGEMENT ALIGNED WITH SHAREHOLDER INTERESTS Alignment of Interests

GRAPHIC

18 INDUSTRIAL LOGISTICS PROPERTIES TRUST A WINNING TRADITION RMR RECOGNITION EPA’S ENERGY STAR Partner of the Year 2019 - 2022. 77 properties with EPA ENERGY STAR certifications. 55 properties with BOMA designations. Ranked #2 for portfolio with most designations. 58 properties with LEED designations. SUSTAINABILITY Boston Globe’s Top Places to Work 2020, 2021 & 2022 Commercial Property Executive Top Commercial Property Managers ranked 9th 2020 Women on Boards Winning Organization 2020 Fortune Magazine’s Fastest Growing Companies ranked 75th 2019 GlobeSt. Real Estate Forum’s Best Places to Work 2022 Boston Business Journal Middle Market Leader 2020, 2022 & 2023 IREM Real Estate Management Excellence Award (REME) for Leadership & Development 2019 18 To find out more about RMR’s highlights, insights and accomplishments please visit The RMR Group’s annual Sustainability Report. 2022 2023

GRAPHIC

19 INDUSTRIAL LOGISTICS PROPERTIES TRUST APPENDIX 725 Darlington Avenue Mahwah, NJ 167,424 Square Feet ILPT Ownership: 100% 19

GRAPHIC

20 INDUSTRIAL LOGISTICS PROPERTIES TRUST As of and for the Three Months Ended 9/30/2023 6/30/2023 3/31/2023 12/31/2022 9/30/2022 Selected Income Statement Data: Rental income $ 110,142 $ 108,043 $ 110,258 $ 106,339 $ 103,215 Net loss $ (36,191) $ (36,580) $ (35,546) $ (41,759) $ (83,974) Net loss attributable to common shareholders $ (26,112) $ (25,828) $ (24,809) $ (31,043) $ (45,627) NOI $ 85,309 $ 84,424 $ 84,473 $ 83,598 $ 81,013 Cash Basis NOI $ 81,643 $ 80,827 $ 80,441 $ 79,931 $ 76,969 Adjusted EBITDAre $ 83,194 $ 81,331 $ 80,712 $ 79,213 $ 76,072 FFO attributable to common shareholders $ 7,945 $ 7,375 $ 7,916 $ 5,440 $ (10,134) Normalized FFO attributable to common shareholders $ 7,945 $ 7,594 $ 7,916 $ 5,440 $ 14,873 CAD attributable to common shareholders $ 10,505 $ 9,803 $ 10,182 $ 4,748 $ 8,290 Rolling four quarter CAD attributable to common shareholders $ 35,238 $ 33,023 $ 42,701 $ 55,675 $ 77,104 Per Common Share Data (basic and diluted): Net loss attributable to common shareholders $ (0.40) $ (0.40) $ (0.38) $ (0.48) $ (0.70) FFO attributable to common shareholders $ 0.12 $ 0.11 $ 0.12 $ 0.08 $ (0.16) Normalized FFO attributable to common shareholders $ 0.12 $ 0.12 $ 0.12 $ 0.08 $ 0.23 CAD attributable to common shareholders $ 0.16 $ 0.15 $ 0.16 $ 0.07 $ 0.13 Rolling four quarter CAD attributable to common shareholders $ 0.54 $ 0.51 $ 0.65 $ 0.85 $ 1.18 Dividends: Annualized dividends paid per share $ 0.04 $ 0.04 $ 0.04 $ 0.04 $ 0.04 Annualized dividend yield (at end of period) 1.4% 1.2% 1.3% 1.2% 0.7% Annualized Normalized FFO attributable to common shareholders payout ratio 8.3% 8.3% 8.3% 12.5% 4.3% CAD attributable to common shareholders payout ratio 6.3% 6.7% 6.3% 14.3% 7.7% Rolling four quarter CAD attributable to common shareholders payout ratio 7.4% 7.8% 6.2% 4.7% 3.4% Selected Balance Sheet Data: Total gross assets $6,000,494 $5,997,715 $5,939,557 $5,949,633 $5,962,116 Total assets $5,634,315 $5,662,080 $5,634,976 $5,676,166 $5,719,635 Total liabilities $4,416,177 $4,400,791 $4,348,801 $4,345,395 $4,358,125 Total equity $1,218,138 $1,261,289 $1,286,175 $1,330,771 $1,361,510 SELECTED FINANCIAL INFORMATION (dollars in thousands, except per share data)

GRAPHIC

21 INDUSTRIAL LOGISTICS PROPERTIES TRUST 
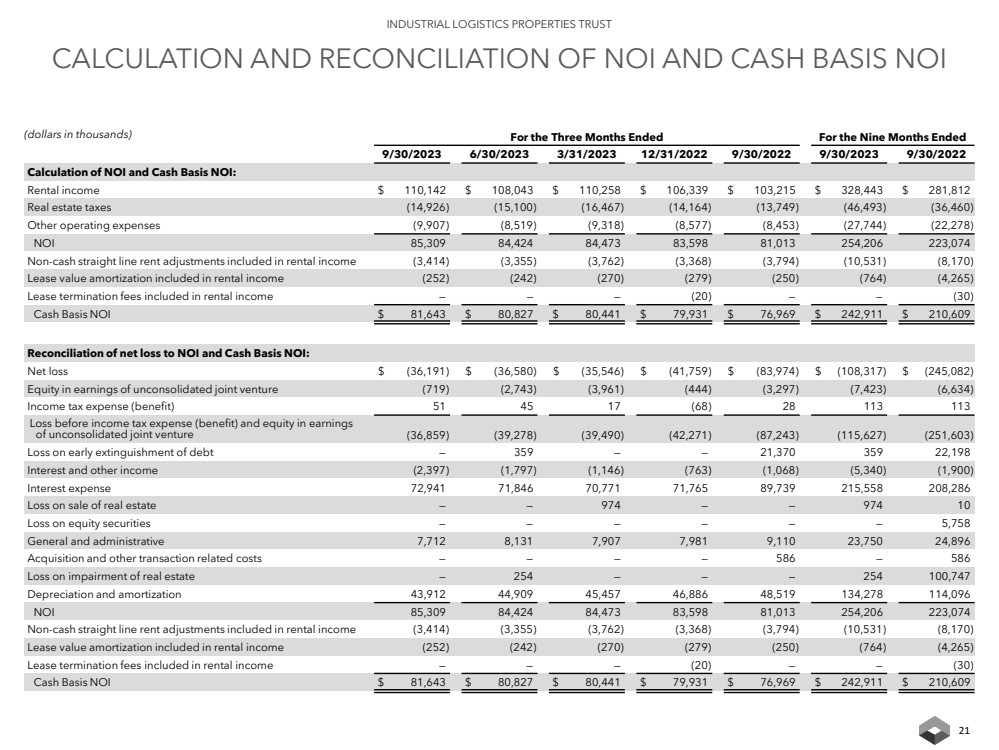
CALCULATION AND RECONCILIATION OF NOI AND CASH BASIS NOI (dollars in thousands) For the Three Months Ended For the Nine Months Ended 9/30/2023 6/30/2023 3/31/2023 12/31/2022 9/30/2022 9/30/2023 9/30/2022 Calculation of NOI and Cash Basis NOI: Rental income $ 110,142 $ 108,043 $ 110,258 $ 106,339 $ 103,215 $ 328,443 $ 281,812 Real estate taxes (14,926) (15,100) (16,467) (14,164) (13,749) (46,493) (36,460) Other operating expenses (9,907) (8,519) (9,318) (8,577) (8,453) (27,744) (22,278) NOI 85,309 84,424 84,473 83,598 81,013 254,206 223,074 Non-cash straight line rent adjustments included in rental income (3,414) (3,355) (3,762) (3,368) (3,794) (10,531) (8,170) Lease value amortization included in rental income (252) (242) (270) (279) (250) (764) (4,265) Lease termination fees included in rental income — — — (20) — — (30) Cash Basis NOI $ 81,643 $ 80,827 $ 80,441 $ 79,931 $ 76,969 $ 242,911 $ 210,609 Reconciliation of net loss to NOI and Cash Basis NOI: Net loss $ (36,191) $ (36,580) $ (35,546) $ (41,759) $ (83,974) $ (108,317) $ (245,082) Equity in earnings of unconsolidated joint venture (719) (2,743) (3,961) (444) (3,297) (7,423) (6,634) Income tax expense (benefit) 51 45 17 (68) 28 113 113 Loss before income tax expense (benefit) and equity in earnings of unconsolidated joint venture (36,859) (39,278) (39,490) (42,271) (87,243) (115,627) (251,603) Loss on early extinguishment of debt — 359 — — 21,370 359 22,198 Interest and other income (2,397) (1,797) (1,146) (763) (1,068) (5,340) (1,900) Interest expense 72,941 71,846 70,771 71,765 89,739 215,558 208,286 Loss on sale of real estate — — 974 — — 974 10 Loss on equity securities — — — — — — 5,758 General and administrative 7,712 8,131 7,907 7,981 9,110 23,750 24,896 Acquisition and other transaction related costs — — — — 586 — 586 Loss on impairment of real estate — 254 — — — 254 100,747 Depreciation and amortization 43,912 44,909 45,457 46,886 48,519 134,278 114,096 NOI 85,309 84,424 84,473 83,598 81,013 254,206 223,074 Non-cash straight line rent adjustments included in rental income (3,414) (3,355) (3,762) (3,368) (3,794) (10,531) (8,170) Lease value amortization included in rental income (252) (242) (270) (279) (250) (764) (4,265) Lease termination fees included in rental income — — — (20) — — (30) Cash Basis NOI $ 81,643 $ 80,827 $ 80,441 $ 79,931 $ 76,969 $ 242,911 $ 210,609

GRAPHIC

22 INDUSTRIAL LOGISTICS PROPERTIES TRUST For the Three Months Ended September 30, For the Nine Months Ended September 30, 2023 2022 2023 2022 Reconciliation of NOI to Same Property NOI: Rental income $ 110,142 $ 103,215 $ 328,443 $ 281,812 Real estate taxes (14,926) (13,749) (46,493) (36,460) Other operating expenses (9,907) (8,453) (27,744) (22,278) NOI 85,309 81,013 254,206 223,074 Less: NOI of properties not included in same property results (1,244) (1,143) (125,325) (98,442) Same property NOI $ 84,065 $ 79,870 $ 128,881 $ 124,632 Calculation of Same Property Cash Basis NOI: Same property NOI $ 84,065 $ 79,870 $ 128,881 $ 124,632 Less: Non-cash straight line rent adjustments included in rental income (3,422) (3,802) (7,140) (4,908) Lease value amortization included in rental income (252) (249) (408) (3,990) Lease termination fees included in rental income — — — (30) Same property Cash Basis NOI $ 80,391 $ 75,819 $ 121,333 $ 115,704 RECONCILIATION OF NOI TO SAME PROPERTY NOI AND CALCULATION OF SAME PROPERTY CASH BASIS NOI (dollars in thousands)

GRAPHIC

23 INDUSTRIAL LOGISTICS PROPERTIES TRUST For the Three Months Ended For the Nine Months Ended 9/30/2023 6/30/2023 3/31/2023 12/31/2022 9/30/2022 9/30/2023 9/30/2022 Net loss $ (36,191) $ (36,580) $ (35,546) $ (41,759) $ (83,974) $ (108,317) $ (245,082) Plus: interest expense 72,941 71,846 70,771 71,765 89,739 215,558 208,286 Plus: income tax expense (benefit) 51 45 17 (68) 28 113 113 Plus: depreciation and amortization 43,912 44,909 45,457 46,886 48,519 134,278 114,096 EBITDA 80,713 80,220 80,699 76,824 54,312 241,632 77,413 Loss on impairment of real estate — 254 — — — 254 100,747 Loss on sale of real estate — — 974 — — 974 10 Equity in earnings of unconsolidated joint venture (719) (2,743) (3,961) (444) (3,297) (7,423) (6,634) Share of EBITDAre from unconsolidated joint venture 2,724 2,674 2,613 2,432 2,483 8,011 7,517 Loss on equity securities — — — — — — 5,758 EBITDAre 82,718 80,405 80,325 78,812 53,498 243,448 184,811 Plus: acquisition and other transaction related costs — — — — 586 — 586 Plus: general and administrative expense paid in common shares (1) 476 567 387 401 618 1,430 1,820 Plus: loss on early extinguishment of debt — 359 — — 21,370 359 22,198 Adjusted EBITDAre $ 83,194 $ 81,331 $ 80,712 $ 79,213 $ 76,072 $ 245,237 $ 209,415 CALCULATION OF EBITDA, EBITDAre AND ADJUSTED EBITDAre (1) Amounts represent equity based compensation to ILPT's trustees and officers and certain other employees of RMR. (dollars in thousands)

GRAPHIC

24 INDUSTRIAL LOGISTICS PROPERTIES TRUST For the Three Months Ended For the Nine Months Ended 9/30/2023 6/30/2023 3/31/2023 12/31/2022 9/30/2022 9/30/2023 9/30/2022 Net loss attributable to common shareholders $ (26,112) $ (25,828) $ (24,809) $ (31,043) $ (45,627) $ (76,749) $ (195,680) Depreciation and amortization 43,912 44,909 45,457 46,886 48,519 134,278 114,096 Equity in earnings of unconsolidated joint venture (719) (2,743) (3,961) (444) (3,297) (7,423) (6,634) Loss on equity securities — — — — — — 5,758 Share of Normalized FFO from unconsolidated joint venture 1,446 1,502 1,468 1,291 1,678 4,416 5,115 Loss on impairment of real estate — 254 — — — 254 100,747 Loss on sale of real estate — — 974 — — 974 10 FFO adjustments attributable to noncontrolling interest (10,582) (10,719) (11,213) (11,250) (11,407) (32,514) (27,445) FFO attributable to common shareholders 7,945 7,375 7,916 5,440 (10,134) 23,236 (4,033) Loss on early extinguishment of debt — 359 — — 21,370 359 22,198 Acquisition, transaction related and certain other financing costs (1) — — — — 32,016 — 80,992 Normalized FFO adjustments attributable to noncontrolling interest — (140) — — (28,379) (140) (28,379) Normalized FFO attributable to common shareholders $ 7,945 $ 7,594 $ 7,916 $ 5,440 $ 14,873 $ 23,455 $ 70,778 CALCULATION OF FFO, NORMALIZED FFO AND CAD ATTRIBUTABLE TO COMMON SHAREHOLDERS (dollars and shares in thousands, except per share data) (1) Amounts for the three and nine months ended September 30, 2022 primarily include certain debt issuance costs recognized as interest expense related to the then existing bridge loan facility and other transaction related costs expensed under GAAP.

GRAPHIC

25 INDUSTRIAL LOGISTICS PROPERTIES TRUST CALCULATION OF FFO, NORMALIZED FFO AND CAD ATTRIBUTABLE TO COMMON SHAREHOLDERS (continued) (dollars and shares in thousands, except per share data) For the Three Months Ended For the Nine Months Ended 9/30/2023 6/30/2023 3/31/2023 12/31/2022 9/30/2022 9/30/2023 9/30/2022 Normalized FFO attributable to common shareholders $ 7,945 $ 7,594 $ 7,916 $ 5,440 $ 14,873 $ 23,455 $ 70,778 Add (less): Non-cash interest expense 12,884 12,861 12,853 13,123 4,658 38,598 11,368 Non-cash revenues (3,666) (3,597) (4,032) (3,647) (4,044) (11,295) (12,435) Non-cash expenses 476 567 387 401 618 1,430 1,820 Recurring capital expenditures (3,961) (3,781) (2,410) (6,590) (3,594) (10,152) (10,068) Principal amortization (4,385) (5,168) (5,530) (5,479) (5,429) (15,083) (12,590) Share of Normalized FFO from unconsolidated joint venture (1,446) (1,502) (1,468) (1,291) (1,678) (4,416) (5,115) Distributions from unconsolidated joint venture 990 990 990 1,320 1,320 2,970 3,962 CAD adjustments attributable to noncontrolling interest 1,668 1,839 1,476 1,471 1,566 4,983 3,207 CAD attributable to common shareholders $ 10,505 $ 9,803 $ 10,182 $ 4,748 $ 8,290 $ 30,490 $ 50,927 Weighted average common shares outstanding (basic and diluted) 65,488 65,369 65,309 65,307 65,250 65,389 65,228 Per Common Share Data (basic and diluted): Net loss per share attributable to common shareholders $ (0.40) $ (0.40) $ (0.38) $ (0.48) $ (0.70) $ (1.17) $ (3.00) FFO per share attributable to common shareholders $ 0.12 $ 0.11 $ 0.12 $ 0.08 $ (0.16) $ 0.36 $ (0.06) Normalized FFO attributable to common shareholders $ 0.12 $ 0.12 $ 0.12 $ 0.08 $ 0.23 $ 0.36 $ 1.09 CAD attributable to common shareholders $ 0.16 $ 0.15 $ 0.16 $ 0.07 $ 0.13 $ 0.47 $ 0.78

26 INDUSTRIAL LOGISTICS PROPERTIES TRUST As of and for the Three Months Ended September 30, 2023 ILPT Wholly Owned Properties Mountain Industrial ILPT Hawaii Mainland Total REIT LLC (1) Other (2) Consolidate Ownership % 100.0% 100.0% 100.0% 61.0% Properties 226 92 318 94 1 4 Sq. ft. 16,729 22,209 38,938 20,981 64 59,98 Occupancy % 97.8% 99.4% 98.7% 99.2% 98.1% 98 Selected Balance Sheet Data: Total gross assets $ 723,314 $ 1,862,657 $ 2,585,971 $ 3,189,957 $ 224,566 $ 6,000,4 Total debt (principal) $ 862,930 $ 1,722,070 $ 2,585,000 $ 1,745,370 $ — $ 4,330,3 Selected Income Statement Data: Rental income $ 30,898 $ 36,799 $ 67,697 $ 42,061 $ 384 $ 110,1 Net income (loss) $ 8,819 $ (20,054) $ (11,235) $ (26,248) $ 1,292 $ (36,1 Net income (loss) attributable to common shareholders $ 8,819 $ (20,054) $ (11,235) $ (16,010) $ 1,133 $ (26,1 NOI $ 22,572 $ 29,278 $ 51,850 $ 33,219 $ 240 $ 85,3 Cash Basis NOI $ 20,530 $ 29,150 $ 49,680 $ 31,729 $ 234 $ 81,6 Adjusted EBITDAre $ 21,642 $ 26,835 $ 48,477 $ 30,749 $ 3,968 $ 83,1 Normalized FFO attributable to common shareholders $ 9,547 $ (4,035) $ 5,512 $ 457 $ 1,976 $ 7,94 CAD attributable to common shareholders $ 8,863 $ 1,800 $ 10,663 $ (2,150) $ 1,992 $ 10,5 Key Ratios: Annualized Cash Basis NOI / total gross assets 11.4% 6.3% 7.7% 4.0% 5 Net debt / annualized Adjusted EBITDAre 10.0 x 16.0 x 13.3 x 13.1 x 12 Select Quarterly Leasing Activity: Leasing activity (sq. ft.): 21 272 293 465 — 75 % change in GAAP rent (weighted average by sq. ft.): 9.9% 8.0% 8.3% 18.7% —% 13 Weighted average lease term by sq. ft. (years): 11.0 4.7 7.3 6.7 — 7 KEY FINANCIAL DATA BY INVESTMENT PORTFOLIO (dollars and sq. ft in thousands, except per sq. ft.) 1. With the exception of measures attributable to common shareholders, amounts shown reflect 100% ownership interest of this joint venture, not ILPT's proportionate share thereof. Amounts presented are derived from GAAP information and may not be comparable to amounts reflected in this joint venture's standalone financial information. 2. Other includes: 100% of the ownership interest of one consolidated mainland property containing approximately 64 rentable square feet located in New Jersey in which ILPT has a 67% ownership interest attributable to common shareholders; any corporate assets and liabilities including ILPT's equity investment in its unconsolidated joint venture; and adjustments to remove the noncontrolling interest of Mountain Industrial REIT LLC from the balance sheet and income statement data.

GRAPHIC

27 INDUSTRIAL LOGISTICS PROPERTIES TRUST DEFINITIONS Non-GAAP Financial Measures: ILPT presents certain “non-GAAP financial measures” within the meaning of the applicable rules of the Securities and Exchange Commission, or the SEC, including FFO attributable to common shareholders, Normalized FFO attributable to common shareholders, EBITDA, EBITDAre, Adjusted EBITDAre, NOI, same property NOI, Cash Basis NOI and same property Cash Basis NOI. These measures do not represent cash generated by operating activities in accordance with GAAP and should not be considered alternatives to net income (loss) or net income (loss) attributable to common shareholders as indicators of ILPT's operating performance or as measures of its liquidity. These measures should be considered in conjunction with net income (loss) and net income (loss) attributable to common shareholders as presented in ILPT's condensed consolidated statements of income (loss). ILPT considers these non-GAAP measures to be appropriate supplemental measures of operating performance for a REIT, along with net income (loss) and net income (loss) attributable to common shareholders. ILPT believes these measures provide useful information to investors because by excluding the effects of certain historical amounts, such as depreciation and amortization expense, they may facilitate a comparison of its operating performance between periods and with other REITs and, in the case of NOI and Cash Basis NOI, reflecting only those income and expense items that are generated and incurred at the property level may help both investors and management to understand the operations of ILPT's properties. NOI and Cash Basis NOI: The calculations of net operating income, or NOI, and Cash Basis NOI exclude certain components of net loss in order to provide results that are more closely related to ILPT's property level results of operations. ILPT calculates NOI and Cash Basis NOI as shown on page 21 and same property NOI and same property Cash Basis NOI as shown on page 22. ILPT defines NOI as income from its rental of real estate less its property operating expenses. NOI excludes amortization of capitalized tenant improvement costs and leasing commissions that it records as depreciation and amortization expense. ILPT defines Cash Basis NOI as NOI excluding non-cash straight line rent adjustments, lease value amortization and lease termination fees, if any. ILPT uses NOI and Cash Basis NOI to evaluate individual and company-wide property level performance. ILPT calculates same property NOI and same property Cash Basis NOI in the same manner that it calculates the corresponding NOI and Cash Basis NOI amounts, except that ILPT only includes same properties in calculating same property NOI and same property Cash Basis NOI. Other real estate companies and REITs may calculate NOI and Cash Basis NOI differently than ILPT does. FFO and Normalized FFO Attributable to Common Shareholders: ILPT calculates funds from operations, or FFO, attributable to common shareholders and Normalized FFO attributable to common shareholders as shown on page 24. FFO attributable to common shareholders is calculated on the basis defined by The National Association of Real Estate Investment Trusts, or Nareit, which is net loss attributable to common shareholders, calculated in accordance with GAAP, excluding loss on impairment of real estate, any gain or loss on sale of real estate, equity in earnings of unconsolidated joint venture and any realized and unrealized gains or losses on equity securities, plus real estate depreciation and amortization of consolidated properties and ILPT's proportionate share of FFO of unconsolidated joint venture properties and minus FFO adjustments attributable to noncontrolling interest, as well as certain other adjustments currently not applicable to ILPT. In calculating Normalized FFO attributable to common shareholders, ILPT adjusts for the items shown on page 24 including similar adjustments for the unconsolidated joint venture, if any. FFO attributable to common shareholders and Normalized FFO attributable to common shareholders are among the factors considered by ILPT's Board of Trustees when determining the amount of distributions to its shareholders. Other factors include, but are not limited to, requirements to maintain ILPT's qualification for taxation as a REIT, limitations in the agreements governing its debt, the availability to ILPT of debt and equity capital, its distribution rate as a percentage of the trading price of ILPT's common shares, or dividend yield, and ILPT's dividend yield compared to the dividend yields of other industrial REITs, ILPT's expectation of its future capital requirements and operating performance and its expected needs for and availability of cash to pay its obligations. Other real estate companies and REITs may calculate FFO attributable to common shareholders and Normalized FFO attributable to common shareholders differently than ILPT does. EBITDA, EBITDAre and Adjusted EBITDAre: ILPT calculates earnings before interest, taxes, depreciation and amortization, or EBITDA, EBITDA for real estate, or EBITDAre, and Adjusted EBITDAre as shown on page 23. EBITDAre is calculated on the basis defined by Nareit, which is EBITDA, including ILPT's proportionate share of EBITDAre from unconsolidated joint venture properties, and excluding gains and losses on the sale of real estate, equity in earnings of unconsolidated joint venture, loss on impairment of real estate, any realized and unrealized gains or losses on equity securities, as well as certain other adjustments currently not applicable to ILPT. In calculating Adjusted EBITDAre, ILPT adjusts for the items shown on page 23. Other real estate companies and REITs may calculate EBITDA, EBITDAre and Adjusted EBITDAre differently than ILPT does. Cash Available for Distribution: ILPT calculates cash available for distribution, or CAD, as shown on page 25. ILPT defines CAD as Normalized FFO minus ILPT's proportionate share of Normalized FFO of unconsolidated joint venture properties, plus operating cash flow distributions received from ILPT's unconsolidated joint venture, recurring real estate related capital expenditures, adjustments for other non-cash and nonrecurring items, certain amounts excluded from Normalized FFO but settled in cash, less CAD adjustments attributable to noncontrolling interest, as well as certain other adjustments currently not applicable to ILPT. CAD is among the factors considered by ILPT's Board of Trustees when determining the amount of distributions to ILPT's shareholders. Other real estate companies and REITs may calculate CAD differently than ILPT does.

GRAPHIC

INDUSTRIAL LOGISTICS PROPERTIES TRUST November 2023 INVESTOR PRESENTATION Two Newton Place 255 Washington Street, Suite 300 Newton, Massachusetts 02458 ILPTREIT.COM 510 John Dodd Road Spartanburg, SC 1,015,740 Square Feet ILPT Ownership: 100%

v3.23.3
Cover
Nov. 13, 2023
Cover [Abstract]  
Document Type 8-K
Amendment Flag false
Document Period End Date Nov. 13, 2023
Entity File Number 001-38342
Entity Registrant Name Industrial Logistics Properties Trust
Entity Central Index Key 0001717307
Entity Tax Identification Number 82-2809631
Entity Incorporation, State or Country Code MD
Entity Address, Address Line One Two Newton Place
Entity Address, Address Line Two 255 Washington Street
Entity Address, Address Line Three Suite 300
Entity Address, City or Town Newton
Entity Address, State or Province MA
Entity Address, Postal Zip Code 02458-1634
City Area Code 617
Local Phone Number 219-1460
Written Communications false
Soliciting Material false
Pre-commencement Tender Offer false
Pre-commencement Issuer Tender Offer false
Title of 12(b) Security Common Shares of Beneficial Interest
Trading Symbol ILPT
Security Exchange Name NASDAQ
Entity Emerging Growth Company false

Industrial Logistics Pro... (NASDAQ:ILPT)
Historical Stock Chart
From Apr 2024 to May 2024 Click Here for more Industrial Logistics Pro... Charts.
Industrial Logistics Pro... (NASDAQ:ILPT)
Historical Stock Chart
From May 2023 to May 2024 Click Here for more Industrial Logistics Pro... Charts.