UNITED STATES
SECURITIES AND EXCHANGE
COMMISSION
Washington, D.C.
20549
FORM 6-K
Report of Foreign Private
Issuer
Pursuant to Rule 13a-16 or 15d-16 of the
Securities Exchange
Act of 1934
For the month of
February, 2025
Commission File Number
1-15106
PETRÓLEO BRASILEIRO
S.A. – PETROBRAS
(Exact name of registrant
as specified in its charter)
Brazilian Petroleum
Corporation – PETROBRAS
(Translation of Registrant's
name into English)
Avenida Henrique Valadares, 28 – 9th floor
20231-030 – Rio de Janeiro, RJ
Federative Republic of Brazil
(Address of principal
executive office)
Indicate by check mark
whether the registrant files or will file annual reports under cover Form 20-F or Form 40-F.
Form 20-F ___X___ Form
40-F _______
Indicate by check mark
whether the registrant by furnishing the information contained in this Form is also thereby furnishing the information to the Commission
pursuant to Rule 12g3-2(b) under the Securities Exchange Act of 1934.
Yes _______ No___X____
Table of Contents
| |
PETROBRAS | Performance Report | 4Q24 | 2 |
| DISCLAIMER |
|
This report may contain forward-looking
statements about future events. Such forecasts reflect only the expectations of the company's management about future economic conditions,
as well as the company's industry, performance and financial results, among others. The terms "anticipates", "believes",
"expects", "predicts", "intends", "plans", "projects", "aims", "should",
as well as other similar terms, are intended to identify such forecasts, which, of course, involve risks and uncertainties foreseen or
not foreseen by the company and, consequently, are not guarantees of the company's future results. Therefore, future results of the company's
operations may differ from current expectations, and the reader should not rely solely on the information contained herein. The Company
undertakes no obligation to update the presentations and forecasts in the light of new information or future developments. The figures
reported for 4Q24 onwards are estimates or targets. Additionally, this presentation contains some financial indicators that are not recognized
under BR GAAP or IFRS. These indicators do not have standardized meanings and may not be comparable to indicators with a similar description
used by other companies. We provide these indicators because we use them as measures of the company's performance; they should not be
considered in isolation or as a substitute for other financial metrics that have been disclosed in accordance with BR GAAP or IFRS. See
definitions of Free Cash Flow, Adjusted EBITDA and Net Debt in the Glossary and respective reconciliations in the Liquidity and Capital
Resources, Reconciliation of Adjusted EBITDA and Net Debt sections. Consolidated financial information prepared in accordance with International
Accounting Standard and audited by the independent auditors.
|
| |
PETROBRAS | Performance Report | 4Q24 | 3 |
CEO’s Message
Dear shareholders and investors,
It is with great satisfaction that
I address you to present some of the many achievements we have obtained in 2024 and to talk a little about the near future of our Petrobras.
The excellent operational and financial
results of 2024 demonstrate, once again, our company's ability to generate value that is returned to society and our investors. I highlight
the operational generation of US$ 38 billion and the financial debt of US$ 23 billion, the lowest level since 2008.
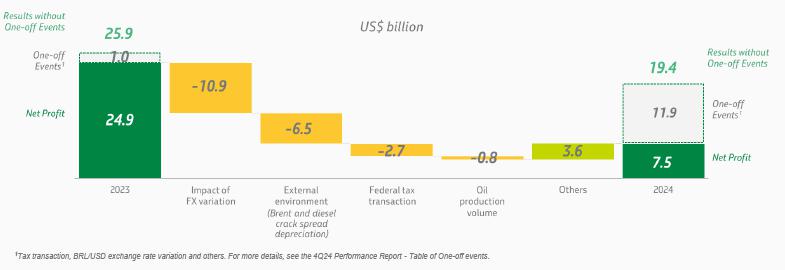
The variation in profit that we report
is fundamentally due to, an accounting issue that does not affect our cash: the exchange rate variation of debts between Petrobras and
its subsidiaries abroad*. The annual result was also impacted by the effects, in 2Q24, of the tax transaction that concluded
legal disputes amounting to R$ 45 billion. This tax transaction has broadly positive repercussions for Petrobras in terms of risk mitigation
and cash outflows. Excluding one-off events, the net profit for the year would be US$ 19.4 billion (R$ 103 billion) and EBITDA would be
US$ 45.9 billion (R$ 245.8 billion).
In 2024, we once again achieved our
oil and gas production targets. As I always emphasize: every drop of oil that generates profit for the company matters. Thus, achieving
production targets is fundamental for Petrobras, as it allows us to maximize value generation through better integration with our downstream
assets. Our commitment to these targets also reflects our focus on operational efficiency and project management.
I would like to mention some achievements
of 2024 related to our production targets: the early start-up of the FPSO Maria Quitéria in the Jubarte field, the achievement
of the maximum production capacity of the FPSO Sepetiba in the Mero field, and the start-up of the FPSO Marechal Duque de Caxias, also
in the Mero field.
In refining, we increased the utilization
rate of our refineries to 93%, the highest in ten years, and set a record for processing pre-salt oils, which accounted for 70% of the
total processed. Historical records were also set for the production of gasoline and S-10 diesel.
Despite the excellence of our results
in 2024, we want to and will do much more.
In refining, by 2025, we will have
an increase of 25 kbpd in processing capacity with the completion of the revamp of Train 1 at RNEST, already considering the start-up
of the SNOx unit in 2024. We will also achieve an additional production of 63 kbpd of diesel S-10 with the new Hydrocracking unit (HDT)
at Replan.
In Exploration & Production (E&P),
we will increase oil production by 100 kbpd, moving towards the milestone of 2.5 million bpd by 2027. We will also increase gas supply
to 50 million m³/day by 2026. To achieve this goal, we will start operating, in 2025, the second module of the gas processing unit
at the Boaventura Complex, with the capacity to process 10.5 million m³/day, totaling 21 million m³/day of total capacity.
Also in 2025, we will add a production capacity of 585 kbpd through the commissioning of three new production units in the pre-salt.
The first of these, the FPSO Almirante Tamandaré, is the largest platform to enter operation in the Búzios field and has
been producing since February. This unit, which is the sixth in the Búzios field, was fundamental for an extremely relevant achievement:
on Monday, February 24, we surpassed the mark of 800 kbpd barrels in Búzios.
Regardless of the magnitude of the
results and the infrastructure to be implemented, we know we cannot rest. Oil and natural gas fields, no matter how productive, are finite
and therefore deplete naturally. For this reason, pursuing the replenishment of oil and gas reserves is fundamental for Petrobras to maintain
its prominent position in the coming decades. Thus, the importance of responsible exploration of the Equatorial Margin stands out, always
in line with the commitments made with environmental agencies. In the same vein, we will prioritize our exploratory efforts in the Pelotas
basin and other assets in our portfolio.
|
* The exchange rate variation in these transactions is reflected
in the net income of the holding company in Brazil. |
| |
PETROBRAS | Performance Report | 4Q24 | 4 |
I reiterate that our diligence in
replenishing oil and gas reserves does not contradict our relentless pursuit of neutrality in our operational emissions. Our current oil
and gas production already stands out with one of the lowest environmental footprints in the industry. Nevertheless, we remain committed
to reducing our operational emissions and seeking profitable investments for scope 3 emissions.
I emphasize the prospect of profitability:
our governance establishes that our investments, in all business segments, must be profitable, even in a scenario with more challenging
assumptions. This is what we have done, for example, in the E&P segment: we have only sanctioned projects that present an expectation
of profitability considering the Brent price at US$ 45/bbl in the long term. Only with the generation of economic value will we continue
to build a long-lasting, responsible Petrobras capable of generating wealth for future generations.
And this is what we proposed with
our new Strategic Plan. We continue to focus on E&P, with production growth and prioritization of reserve replenishment. At the same
time, we maintain our integration strategy with downstream and increase our decarbonization and green energy generation efforts to be
leaders in the just energy transition.
In this sense, we continue to analyze
opportunities for profitable diversification and integrated operations in petrochemicals. We are advancing in partnership studies with
major players for the production of ethanol, in addition to the initiative, also in collaboration with partners, for the production of
e-methanol, aiming to implement the first commercial-scale plant in Brazil, among other decarbonization initiatives.
We are returning to the fertilizers
segment, with the ANSA operation scheduled for 2025 and the resumption of construction of UFN 3.
All these initiatives contribute to
the sustainable growth of Petrobras, generating returns for government and private shareholders and for society.
In 2024, we delivered a total return
to shareholders of around 20%, considering the appreciation of the share price and the payment of dividends. We invested R$ 91 billion
(5% of total investments in Brazil), sustaining 250 thousand jobs. We paid R$ 270 billion in taxes; we distributed R$102.6 billion, of
which R$37.9 billion corresponded to the control group;; and we allocated more than R$ 1 billion in voluntary and mandatory investments,
sponsorships and donations.
Our efforts in the environmental,
social, and governance areas received important recognition: this year, Petrobras returned to the Dow Jones Sustainability Index, one
of the most important in the world. Petrobras is one of nine global energy companies qualified among more than 50 companies in the sector
evaluated.
We will continue to generate high
returns for society and shareholders, and I am confident that the way to achieve this is to continue investing in profitable projects,
with capital discipline, rationality, governance, and efficiency, working with integrity, safety, innovation, and care for people, our
main asset. Petrobras has an even brighter future ahead. Brazil is our energy.
Magda Chambriard, Petrobras’
CEO
| |
PETROBRAS | Performance Report | 4Q24 | 5 |
Highlights – 2024
Highlights - 2024
“2024 was a positive year for Petrobras.
We consistently maintained strong cash generation, reaching US$ 38 billion in Operating Cash Flow in 2024. This result demonstrates the
company's financial health and the quality of its assets, which operate profitably, generating resources to make investments, remunerate
shareholders and meet all its obligations. In 2025, with the entry of three new production systems in the year and an expected increase
of 100,000 barrels per day, we expect to have even more consistent results.”
Fernando Melgarejo, Chief Financial and Investor
Relations Officer
Main financial highlights
| • | Maintenance of a strong cash generation with Operating Cash Flow of US$
38.0 billion and Free Cash Flow of US$ 23.3 billion in 2024 |
| • | Financial debt of US$ 23.2 billion at year end, the lowest level since
2008 |
| • | Consistent performance: Adjusted EBITDA without one-off events of US$
45.9 billion and Net Profit without one-off events of US$ 19.4 billion |
“Petrobras' result in 2024 was mainly
impacted by an item of an accounting nature: the exchange rate variation on debts between Petrobras and its subsidiaries abroad. These
are financial transactions between companies in the same group, which generate opposite effects that in the end balance out economically.
This is because the currency variation in these transactions enters the net result of the Holding in Brazil and negatively impacted the
profit for 2024. At the same time, there was a direct positive impact on equity.”
Fernando Melgarejo, Chief Financial and Investor
Relations Officer
| |
PETROBRAS | Performance Report | 4Q24 | 6 |
Highlights – 2024
Commitment to investments
| • | Capex of US$ 16.6 billion in 2024 |
“The CAPEX of US$ 16.6 billion,
higher than the guidance, does not represent an additional cost but an anticipation, as we were able to reduce the gap between the physical
and financial evolution of the platforms in Búzios. We expected this reduction in the mentioned mismatch to occur throughout 2025,
but we acted strongly in contractual management and the solution was totally anticipated to 2024. Petrobras benefits from reduced risks
and increased potential for anticipations. This is what we are focused on: executing our investment plan and achieving our production
targets.”
Fernando Melgarejo, Chief Financial and Investor
Relations Officer
Contribution to society
| • | We paid R$ 270 billion in taxes to the Federal Government, states and
municipalities, the second highest payment in the last 10 years |
| • | We distributed R$102.6 billion, of which R$37.9 billion corresponded
to the control group |
| • | We allocated more than R$ 1 billion in voluntary and mandatory investments,
sponsorships and donations |
Main operational highlights
| • | We increased our proven reserves, reaching a reserve replacement ratio
(RRR) of 154% and a production reserve ratio (R/P) of 13.2 years |
| • | We had the production start-up on FPSO Maria Quitéria and FPSO
Marechal Duque de Caxias and reached the top of production on FPSO Sepetiba |
| • | We set new annual records for total own and operated production in pre-salt,
with 2.2 million boed and 3.2 million boed, respectively. The production volume in pre-salt represents 81% of the company's total production
in 2024 |
| • | We confirmed, together with partners, a discovery of 6 trillion cubic
feet (Tcf) in place (VGIP), with the drilling of the Sirius-2 well. The largest gas discovery in Colombia's history |
| • | Total utilization factor (FUT) in 2024 was 93%, the highest of the refining
system in the last 10 years considering Petrobras current refineries |
| • | We achieved a record of 70% share of pre-salt oil in refinery throughput
and set production records for gasoline (420 kbpd) and S-10 diesel (452 kbpd) |
| • | We started commercial operation of the natural gas processing unit at
Boaventura Energy Complex and the start-up of SNOx at RNEST. |
| |
PETROBRAS | Performance Report | 4Q24 | 7 |
Highlights – 2024
Main items
Table 1 – Main items
| |
|
|
|
|
|
Variation (%) |
| US$ million |
4Q24 |
3Q24 |
4Q23 |
2024 |
2023 |
4Q24 X 3Q24 |
4Q24 X 4Q23 |
2024 X 2023 |
| Sales revenues |
20,815 |
23,366 |
27,107 |
91,416 |
102,409 |
(10.9) |
(23.2) |
(10.7) |
| Gross profit |
9,983 |
12,005 |
14,654 |
45,972 |
53,974 |
(16.8) |
(31.9) |
(14.8) |
| Operating expenses |
(7,196) |
(3,605) |
(6,632) |
(19,096) |
(15,941) |
99.6 |
8.5 |
19.8 |
| Consolidated net income (loss) attributable to the shareholders of Petrobras |
(2,780) |
5,870 |
6,259 |
7,528 |
24,884 |
− |
− |
(69.7) |
| Consolidated net income (loss) without one-off events attributable to the shareholders of Petrobras (*) |
3,083 |
5,475 |
7,642 |
19,370 |
25,634 |
(43.7) |
(59.7) |
(24.4) |
| Net cash provided by operating activities |
8,204 |
11,307 |
11,669 |
37,984 |
43,212 |
(27.4) |
(29.7) |
(12.1) |
| Free cash flow |
3,766 |
6,857 |
8,073 |
23,318 |
31,074 |
(45.1) |
(53.4) |
(25.0) |
| Adjusted EBITDA |
7,165 |
11,480 |
13,470 |
40,399 |
52,414 |
(37.6) |
(46.8) |
(22.9) |
| Adjusted EBITDA without one-off events (*) |
9,879 |
11,614 |
14,985 |
45,886 |
55,158 |
(14.9) |
(34.1) |
(16.8) |
| Gross debt (US$ million) |
60,311 |
59,132 |
62,600 |
60,311 |
62,600 |
2.0 |
(3.7) |
(3.7) |
| Net debt (US$ million) |
52,240 |
44,251 |
44,698 |
52,240 |
44,698 |
18.1 |
16.9 |
16.9 |
| Net debt/LTM Adjusted EBITDA ratio |
1.29 |
0.95 |
0.85 |
1.29 |
0.85 |
35.8 |
51.8 |
51.8 |
| Average commercial selling rate for U.S. dollar |
5.84 |
5.55 |
4.95 |
5.39 |
4.99 |
5.2 |
18.0 |
8.0 |
| Brent crude (US$/bbl) |
74.69 |
80.18 |
84.05 |
80.76 |
82.62 |
(6.8) |
(11.1) |
(2.3) |
| Price of basic oil products - Domestic Market (US$/bbl) |
83.30 |
88.10 |
104.30 |
89.57 |
101.05 |
(5.4) |
(20.1) |
(11.4) |
| TRI (total recordable injuries per million men-hour frequency rate) |
- |
- |
- |
0.70 |
0.80 |
- |
- |
(12.5) |
| ROCE (Return on Capital Employed) |
7.2% |
9.2% |
11.2% |
7.2% |
11.2% |
-2 p.p. |
-4 p.p. |
-4 p.p. |
| (*) See reconciliation of net income and Adjusted EBITDA in the One-off events section. |
| |
PETROBRAS | Performance Report | 4Q24 | 8 |
Consolidated results
Consolidated results
In 2024, Petrobras posted strong cash
generation, evidencing its financial strength while maintaining its commitment to investments and shareholders remuneration.
Throughout 2024, the external environment
was marked by a 2% decline in Brent prices and a 39% reduction in diesel crackspreads. Despite these factors, Petrobras achieved Adjusted
EBITDA without one-off events of US$ 45.9 billion.
Adjusted EBITDA without one-off events
in 2024 was 17% lower than in 2023, reflecting a deterioration in the external environment with lower oil prices and international margins
in the refining segment, as well as lower oil production volumes.
Net income for 2024 amounted to US$ 7.5
billion, a 70% reduction compared to 2023, mainly due to an accounting effect that does not affect our cash or equity: the exchange rate
variation of debts between Petrobras and its overseas subsidiaries. Without one-off events, net profit would have been US$ 19.4 billion.
Due to the depreciation of the final exchange
rate, the financial result for 2024 was negative by US$ 15.1 billion. In addition, financial expenses associated with the Tax Transaction
were recognized in 2Q24. The tax transaction was positive for the company as it ended billion-dollar disputes that caused great uncertainty
for the company’s cash position. Petrobras shares rose more than 3% following the announcement of the transaction.
In 4Q24, the company recorded a loss of
US$ 2.8 billion, mainly reflecting the impact of foreign exchange rate depreciation, which, as mentioned, is a purely accounting event,
as well as higher provisions, with no cash effect, in operating expenses, partially offset by lower income tax and social contribution
(IR/CSLL). Without one-off events, Petrobras would have recorded a profit of US$ 3.1 billion.
| |
PETROBRAS | Performance Report | 4Q24 | 9 |
One-off events
One-off events
Table 2 – One-off events
| |
|
|
|
|
|
Variation (%) |
| US$ million |
4Q24 |
3Q24 |
4Q23 |
2024 |
2023 |
4Q24 X 3Q24 |
4Q24 X 4Q23 |
2024 X 2023 |
| Net income (loss) |
(2,766) |
5,891 |
6,282 |
7,605 |
24,995 |
− |
− |
(69.6) |
| Items with one-off events |
(8,880) |
601 |
(2,092) |
(17,063) |
(1,139) |
− |
324.5 |
1398.1 |
| Items with one-off events that do not affect Adjusted EBITDA |
(6,166) |
735 |
(577) |
(11,576) |
1,605 |
− |
968.6 |
− |
| Impairment of assets and investments |
(1,579) |
(3) |
(2,208) |
(1,518) |
(2,682) |
52533.3 |
(28.5) |
(43.4) |
| Gains and losses on disposal/write-offs of assets |
39 |
(97) |
145 |
228 |
1,295 |
− |
(73.1) |
(82.4) |
| Results from co-participation agreements in bid areas |
156 |
− |
237 |
259 |
284 |
− |
(34.2) |
(8.8) |
| Effect of the tax transaction on net finance income (expense) |
(13) |
110 |
− |
(2,052) |
− |
− |
− |
− |
| Discount and premium on repurchase of debt securities |
(14) |
24 |
34 |
10 |
76 |
− |
− |
(86.8) |
| Gains/(losses) with foreign exchange variation Real x U.S. dollar (*) |
(4,755) |
701 |
979 |
(8,503) |
2,396 |
− |
− |
− |
| Legal agreement with Eletrobras - compulsory loans |
− |
− |
236 |
− |
236 |
− |
− |
− |
| Other items with one-off events |
(2,714) |
(134) |
(1,515) |
(5,487) |
(2,744) |
1925.4 |
79.1 |
100.0 |
| Voluntary Separation Plan |
− |
11 |
2 |
8 |
8 |
− |
− |
− |
| Collective bargaining agreement |
− |
− |
(211) |
(8) |
(217) |
− |
− |
(96.3) |
| Amounts recovered from Lava Jato investigation |
22 |
31 |
10 |
60 |
109 |
(29.0) |
120.0 |
(45.0) |
| Gains/(losses) on decommissioning of returned/abandoned areas |
(2,575) |
− |
(1,179) |
(2,584) |
(1,195) |
− |
118.4 |
116.2 |
| Gains/(losses) related to legal proceedings |
(188) |
(287) |
(125) |
(996) |
(797) |
(34.5) |
50.4 |
25.0 |
| Effect of the tax transaction on other taxes |
14 |
105 |
− |
(671) |
− |
(86.7) |
− |
− |
| Equalization of expenses - Production Individualization Agreements |
13 |
(5) |
(12) |
(16) |
(50) |
− |
− |
(68.0) |
| Gains/(losses) arising from actuarial review of health care plan |
− |
− |
− |
(1,291) |
− |
− |
− |
− |
| Gains/(losses) with the transfer of rights on concession agreements |
− |
11 |
− |
11 |
− |
− |
− |
− |
| Compensation for the termination of a vessel charter agreement |
− |
− |
− |
− |
(317) |
− |
− |
− |
| Export tax on crude oil |
− |
− |
− |
− |
(285) |
− |
− |
− |
| Net effect of items with one-off events on IR/CSLL |
3,017 |
(206) |
709 |
5,224 |
390 |
− |
325.5 |
1239.5 |
| Net income without one-off events |
3,097 |
5,496 |
7,665 |
19,444 |
25,744 |
(43.6) |
(59.6) |
(24.5) |
| Shareholders of Petrobras |
3,083 |
5,475 |
7,642 |
19,370 |
25,634 |
(43.7) |
(59.7) |
(24.4) |
| Non-controlling interests |
14 |
21 |
23 |
74 |
110 |
(33.3) |
(39.1) |
(32.7) |
| Adjusted EBITDA |
7,165 |
11,480 |
13,470 |
40,399 |
52,414 |
(37.6) |
(46.8) |
(22.9) |
| Items with one-off events |
(2,714) |
(134) |
(1,515) |
(5,487) |
(2,744) |
1925.4 |
79.1 |
100.0 |
| Adjusted EBITDA without one-off events |
9,879 |
11,614 |
14,985 |
45,886 |
55,158 |
(14.9) |
(34.1) |
(16.8) |
| (*) As of 4Q24, the line "gains/(losses) with foreign exchange variation Real x U.S. dollar" was added to the table above to calculate adjusted EBITDA and net income without one-off events. For comparative purposes, the periods previously disclosed were updated. |
In management's view, the one-off events
presented above, although related to the Company's business, were highlighted as complementary information for a better understanding
and evaluation of the result. Such items do not necessarily occur in all periods and shall be disclosed when relevant.
| |
PETROBRAS | Performance Report | 4Q24 | 10 |
Capex
Capex
Table 3 - Capex
| |
|
|
|
|
|
Variation (%) |
| US$ million |
4Q24 |
3Q24 |
4Q23 |
2024 |
2023 |
4Q24 X 3Q24 |
4Q24 X 4Q23 |
2024 X 2023 |
| Exploration & Production |
4,899 |
3,773 |
2,752 |
13,912 |
10,283 |
29.8 |
78.0 |
35.3 |
| Refining, Transportation and Marketing |
538 |
452 |
530 |
1,799 |
1,559 |
18.8 |
1.5 |
15.4 |
| Gas & Low Carbon Energies |
129 |
97 |
134 |
426 |
277 |
33.7 |
(3.7) |
53.9 |
| Others |
163 |
111 |
142 |
461 |
413 |
47.2 |
15.2 |
11.7 |
| Subtotal |
5,729 |
4,433 |
3,558 |
16,598 |
12,532 |
29.2 |
61.0 |
32.4 |
| Signature bonus |
2 |
21 |
− |
23 |
141 |
(91.9) |
− |
(83.9) |
| Total |
5,731 |
4,454 |
3,558 |
16,621 |
12,673 |
28.7 |
61.1 |
31.2 |
n 2024, Capex totaled $16.6 billion,
representing a 31% increase compared to 2023, mainly due to higher spending on major pre-salt projects, especially in the new production
systems of the Búzios field and the revitalization of the Marlim field.
The investment made in 2024 was 15% above
the guidance disclosed in August 2024, largely due to the recovery from the discrepancy observed in the first half of the year between
the physical progress of activities and the financial progress based on the fulfillment of key delivery milestones of the five owned FPSOs
under construction for the Búzios field.
The company expected this mismatch to
be reduced throughout 2025. However, it took strong action to seek alternatives to fully resolve this issue still in 2024, implementing
various contractual diligence measures to ensure the completion of physical delivery packages that enable payment milestones. These efforts
allowed us to accelerate financial progress in the last quarter and recover a significant portion of the shortfall attributable to the
under-execution of CAPEX compared to the disclosed plan.
The reduction of the physical-financial
mismatch and the greater alignment of incentives with suppliers for achieving the milestones are fundamental vectors for bringing the
new systems into production as planned, mitigating risks of delays and increasing the potential for anticipations.
We reaffirm Petrobras' management commitment
to continuously seek initiatives that support the timely commissioning of production systems established in the strategic plan. This is
exemplified by the successful startup of the FPSOs Maria Quitéria, Marechal Duque de Caxias, and Almirante Tamandaré in
the Jubarte, Mero, and Búzios fields, respectively, which were achieved either ahead of schedule or in accordance with the deadlines
set in the 2024-28+ Strategic Plan timeline.
The company reiterates the proposed Capex
guidance for the year 2025 (under the exchange rate assumptions of the Business Plan) of $18.5 billion, with a variation of +/- 10%, considering
the potential for value generation with the advancement of the Capex vector over the coming years, without this resulting in an increase
in the total value projected for executing the projects during the period from 2024 to 2029 (Guidance + PN 2025-29). However, we will
maintain the most likely dates disclosed for the entry of the systems and the CAPEX of the PN 2025-29, considering the intrinsic risks
and uncertainties related to the implementation of the projects, contained in the margin of +/- 10%.
In 4Q24 2024, Capex totaled $5.7 billion,
29% higher than 2Q24, mainly due to higher spending on major pre-salt projects, especially in the new production systems of the Búzios
field.
In the Exploration and Production segment,
4Q24 Capex amounted to $4.9 billion, 30% higher than in 3Q24, and were mainly concentrated on: (i) developing production in the Santos
Basin pre-salt area ($2.8 billion); (ii) developing production in the Campos Basin pre/post-salt areas ($0.9 billion); and (iii) exploratory
investments ($0.3 billion). The increase compared to the previous quarter is due to progress in the construction of new production systems
in the Búzios field, with a focus on investments associated with the arrival of equipment at platforms P-80, P-82, and P-83, and
the construction of modules for units P-78 and P-79.
| |
PETROBRAS | Performance Report | 4Q24 | 11 |
Capex
In the Refining, Transportation, and Marketing
segment, Capex totaled $0.5 billion in 4Q24, a growth of 19% compared to 3Q24. This increase occurred due to higher spending on scheduled
refinery stoppages, particularly at RNEST, REPLAN, and REGAP, in addition to progress on the RNEST Train 1 project and small-scale refinery
projects.
In the Gas and Low-Carbon Energies segment,
Capex totaled $0.1 billion in 4Q24, 34% higher than 3Q24. The increase was mainly due to the maintenance and operational continuity of
thermal plants, as well as spending on infrastructure maintenance of GASBOL in TBG.
Additionally, in 4Q24, US$ 2 million was
recognized related to signing bonuses for 26 blocks (partnership with Shell) in the Pelotas Basin.
It is worth highlighting the start of
operations in 4Q24 of the leased FPSOs Marechal Duque de Caxias (Mero 3) and Maria Quitéria (Integrado Parque das Baleias), with
total lease costs amounting to US$ 3.5 billion (Petrobras' share). Similarly to the owned units, leased FPSOs are recognized as assets
of the Company and represent an investment effort to expand production capacity with new units. However, they are not included in Capex.
The following table presents the main
information about the new oil and gas production systems, already contracted.
| |
PETROBRAS | Performance Report | 4Q24 | 12 |
Capex
Table 4 – Main projects
| Unit |
Start-up |
FPSO capacity (bbl/day) |
Petrobras Actual Investment
(US$ bn) |
Petrobras Total Investment
(US$ bn) (1) |
Petrobras Stake |
Status |
|
Mero 2
FPSO Sepetiba
(Chartered unit) |
2023 |
180,000 |
0.8 |
1.0 |
38.6% |
Project in execution phase with production system in operation.
13 wells drilled and 13 completed. |
|
Integrado Parque das Baleias (IPB)
FPSO Maria Quitéria
(Chartered unit) |
2024 |
100,000 |
1.1 |
1.9 |
100% |
Project in execution phase with production system in operation.
4 wells drilled and 3 completed. (2) |
|
Mero 3
FPSO Marechal Duque de Caxias
(Chartered unit) |
2024 |
180,000 |
0.5 |
0.9 |
38.6% |
Project in execution phase with production system in operation.
12 wells drilled and 11 completed. |
|
Búzios 7
FPSO Almirante Tamandaré
(Chartered unit) |
2025 |
225,000 |
1.2 |
2.0 |
88.99% |
Project in execution phase with production system in operation.
15 wells drilled and 14 completed. |
|
Búzios 6
P-78
(Owned unit) |
2025 |
180,000 |
2.2 |
5.2 |
88.99% |
Project in execution phase with production system under construction.
7 wells drilled and 4 completed. |
|
Mero 4
FPSO Alexandre de Gusmão
(Chartered unit) |
2025 |
180,000 |
0.2 |
1.3 |
38.6% |
Project in execution phase with production system in transit to Brazil.
8 wells drilled and 6 completed. |
|
Búzios 8
P-79
(Owned unit) |
2026 |
180,000 |
2.1 |
5.7 |
88.99% |
Project in execution phase with production system under construction.
9 wells drilled and 6 completed. |
|
Búzios 9
P-80
(Owned unit) |
2027 |
225,000 |
1.6 |
6.5 |
88.99% |
Project in execution phase with production system under construction.
3 wells drilled and 2 completed. |
|
Búzios 10
P-82
(Owned unit) |
2027 |
225,000 |
1.3 |
7.4 |
88.99% |
Project in execution phase with production system under construction.
1 well drilled. |
|
Búzios 11
P-83
(Owned unit) |
2027 |
225,000 |
1.0 |
6.8 |
88.99% |
Project in execution phase with production system under construction.
3 wells drilled and 1 completed. |
|
Raia Manta e Raia Pintada
FPSO Raia
(Non-operated project) |
2028 |
126,000 |
0.8 |
2,7 (3) |
30% |
Project in execution phase with production system under construction. |
|
Atapu 2
P-84 |
2029 |
225,000 |
0.3 |
6.4 |
65.7% |
Project in execution phase with production system under construction. |
|
Sépia 2
P-85 |
2030 |
225,000 |
0.2 |
4.7 |
55.3% |
Project in execution phase. |
|
(1) Total investment with the 2025-29+ Strategic Plan assumptions
and Petrobras work interest (WI). Chartered units leases are not included.
(2) Production Unit for revitalization project. Refers only to new wells.
The scope of the project also includes the relocation of some wells of the units being decommissioned.
(3) Total investment considering Petrobras work interest (WI). It is included
the FPSO, contracted on a lump sum turnkey modality, which includes engineering, procurement, construction and installation for the unit.
The contractor will also provide FPSO operation and maintenance services during the first year from the start of production. |
| |
PETROBRAS | Performance Report | 4Q24 | 13 |
Liquidity and capital resources
Liquidity and capital resources
Table 5 - Liquidity and capital resources
| US$ million |
4Q24 |
3Q24 |
4Q23 |
2024 |
2023 |
| Adjusted cash and cash equivalents at the beginning of period |
14,881 |
13,470 |
17,272 |
17,902 |
12,283 |
| Government bonds, bank deposit certificates and time deposits with maturities of more than 3 months at the beginning of period (*) |
(6,187) |
(5,586) |
(5,162) |
(5,175) |
(4,287) |
| Cash and cash equivalents at the beginning of period |
8,694 |
7,884 |
12,110 |
12,727 |
7,996 |
| Net cash provided by operating activities |
8,204 |
11,307 |
11,669 |
37,984 |
43,212 |
| Net cash (used in) provided by investing activities |
(3,271) |
(4,742) |
(3,228) |
(13,369) |
(7,955) |
| Acquisition of PP&E and intangible assets |
(4,429) |
(4,443) |
(3,594) |
(14,644) |
(12,114) |
| Acquisition of equity interests |
(9) |
(7) |
(2) |
(22) |
(24) |
| Proceeds from disposal of assets - Divestment |
72 |
25 |
42 |
863 |
3,606 |
| Financial compensation from co-participation agreements |
− |
− |
− |
397 |
391 |
| Divestment (investment) in marketable securities |
1,070 |
(374) |
313 |
(109) |
98 |
| Dividends received |
25 |
57 |
13 |
146 |
88 |
| (=) Net cash provided by operating and investing activities |
4,933 |
6,565 |
8,441 |
24,615 |
35,257 |
| Net cash used in financing activities |
(9,654) |
(5,895) |
(7,871) |
(33,088) |
(30,700) |
| Changes in non-controlling interest |
23 |
(232) |
103 |
(84) |
1 |
| Net financings |
(2,122) |
(1,457) |
(1,207) |
(6,325) |
(3,961) |
| Proceeds from finance debt |
576 |
986 |
910 |
2,129 |
2,210 |
| Repayments |
(2,698) |
(2,443) |
(2,117) |
(8,454) |
(6,171) |
| Repayment of lease liability |
(2,099) |
(1,913) |
(1,792) |
(7,895) |
(6,286) |
| Dividends paid to shareholders of Petrobras |
(5,456) |
(2,293) |
(4,436) |
(18,327) |
(19,670) |
| Share repurchase program |
− |
− |
(538) |
(380) |
(735) |
| Dividends paid to non-controlling interests |
− |
− |
(1) |
(77) |
(49) |
| Effect of exchange rate changes on cash and cash equivalents |
(702) |
140 |
47 |
(983) |
174 |
| Cash and cash equivalents at the end of period |
3,271 |
8,694 |
12,727 |
3,271 |
12,727 |
| Government bonds, bank deposit certificates and time deposits with maturities of more than 3 months at the end of period (*) |
4,800 |
6,187 |
5,175 |
4,800 |
5,175 |
| Adjusted cash and cash equivalents at the end of period |
8,071 |
14,881 |
17,902 |
8,071 |
17,902 |
| Reconciliation of Free Cash Flow |
|
|
|
|
|
| Net cash provided by operating activities |
8,204 |
11,307 |
11,669 |
37,984 |
43,212 |
| Acquisition of PP&E and intangible assets |
(4,429) |
(4,443) |
(3,594) |
(14,644) |
(12,114) |
| Acquisition of equity interests |
(9) |
(7) |
(2) |
(22) |
(24) |
| Free cash flow (**) |
3,766 |
6,857 |
8,073 |
23,318 |
31,074 |
|
(*) Includes government bonds, bank deposit certificates and time deposits
of companies classified as held for sale.
(**) Free cash flow (FCF) is in accordance with the new Shareholder Remuneration
Policy (“Policy”) approved on 07/28/2023 and corresponds to operating cash flow minus acquisitions of property, plant and
equipment, intangible assets and equity interests. For comparative purposes, figures prior to 2Q23 have been adjusted in accordance with
the new Policy. |
| |
PETROBRAS | Performance Report | 4Q24 | 14 |
Liquidity and capital resources
As of December 31, 2024, cash and cash equivalents
totaled US$ 3.3 billion and adjusted cash and cash equivalents totaled US$ 8.1 billion.
In 4Q24, funds generated by operating activities
reached US$ 38.0 billion and free cash flow totaled US$ 23.3 billion. This level of cash generation was used to: (a) shareholders remuneration
(US$ 18.7 billion), (b) investments (US$ 14.6 billion), (c) lease liabilities amortization (US$ 7.9 billion), and (d) amortization of
principal and interest due in the period (US$ 8.5 billion).
In 2024, the company paid off various loans
and financings, amounting to US$ 8.5 billion, and the highlight was the repurchase and redemption of US$ 2.5 billion of bonds in the international
capital markets and the prepayment of US$ 250 million in loans in the international banking market.
In 2024, the company raised US$ 2.1 billion,
notably by offering bonds on the international capital markets (Global Notes) amounting to US$ 1.0 billion maturing in 2035 and raising
funds in the national banking market amounting to US$ 1.1 billion.
| |
PETROBRAS | Performance Report | 4Q24 | 15 |
Debt indicators
Debt indicators
As of December 31, 2024, gross debt reached
$60.3 billion, a decrease of 3.8% compared to December 31, 2023.
Average maturity increased from 11.38
years on December 31, 2023, to 12.52 years on December 31, 2024, and the average cost varied from 6.4% p.a. to 6.8% p.a. during the same
period.
The gross debt/adjusted EBITDA ratio was
1.49x on 12/31/2024, compared to 1.19x on 12/31/2023.
On 12/31/2024, the net debt reached $52.2
billion, an increase of 16.9% compared to 12/31/2023.
Table 6 – Debt indicators
| US$ million |
12.31.2024 |
09.30.2024 |
Δ % |
12.31.2023 |
| Financial Debt |
23,162 |
25,756 |
(10.1) |
28,801 |
| Capital Markets |
14,490 |
16,005 |
(9.5) |
17,514 |
| Banking Market |
6,519 |
7,490 |
(13.0) |
8,565 |
| Development banks |
508 |
587 |
(13.5) |
698 |
| Export Credit Agencies |
1,508 |
1,517 |
(0.6) |
1,870 |
| Others |
137 |
157 |
(12.7) |
154 |
| Finance leases |
37,149 |
33,376 |
11.3 |
33,799 |
| Gross debt |
60,311 |
59,132 |
2.0 |
62,600 |
| Adjusted cash and cash equivalents |
8,071 |
14,881 |
(45.8) |
17,902 |
| Net debt |
52,240 |
44,251 |
18.1 |
44,698 |
| Net Debt/(Net Debt + Market Cap) - Leverage |
39% |
33% |
18.2 |
30% |
| Average interest rate (% p.a.) |
6.8 |
6.6 |
3.0 |
6.4 |
| Weighted average maturity of outstanding debt (years) |
12.52 |
11.57 |
8.2 |
11.38 |
| Net debt/LTM Adjusted EBITDA ratio |
1.29 |
0.95 |
35.8 |
0.85 |
| Gross debt/LTM Adjusted EBITDA ratio |
1.49 |
1.27 |
17.9 |
1.19 |
| |
PETROBRAS | Performance Report | 4Q24 | 16 |
Results by business segment
Results by business segment
Exploration and Production
Table 7 – E&P results
| |
|
|
|
|
|
Variation (%) (*) |
| US$ million |
4Q24 |
3Q24 |
4Q23 |
2024 |
2023 |
4Q24 X 3Q24 |
4Q24 X 4Q23 |
2024 X 2023 |
| Sales revenues |
13,388 |
15,383 |
18,506 |
60,516 |
66,880 |
(13.0) |
(27.7) |
(9.5) |
| Gross profit |
7,386 |
9,404 |
10,909 |
35,693 |
39,641 |
(21.5) |
(32.3) |
(10.0) |
| Operating expenses |
(4,236) |
(1,222) |
(3,778) |
(7,639) |
(5,615) |
246.6 |
12.1 |
36.0 |
| Operating income |
3,150 |
8,182 |
7,131 |
28,054 |
34,026 |
(61.5) |
(55.8) |
(17.6) |
| Net income (loss) attributable to the shareholders of Petrobras |
2,094 |
5,416 |
4,734 |
18,593 |
22,453 |
(61.3) |
(55.8) |
(17.2) |
| Adjusted EBITDA of the segment |
6,404 |
10,451 |
11,575 |
38,097 |
44,707 |
(38.7) |
(44.7) |
(14.8) |
| EBITDA margin of the segment (%) |
48 |
68 |
63 |
63 |
67 |
(20.1) |
(14.7) |
(4) |
| ROCE (Return on Capital Employed) (%) |
11.0 |
13.4 |
14.5 |
11.0 |
14.5 |
(2.4) |
(3.5) |
(3.5) |
| Average Brent crude (US$/bbl) |
74.69 |
80.18 |
84.05 |
80.76 |
82.62 |
(6.8) |
(11.1) |
(2.3) |
| Production taxes Brazil |
2,618 |
2,833 |
3,255 |
11,378 |
12,111 |
(7.6) |
(19.6) |
(6.1) |
| Royalties |
1,643 |
1,774 |
1,942 |
7,126 |
7,086 |
(7.4) |
(15.4) |
0.6 |
| Special participation |
966 |
1,050 |
1,304 |
4,216 |
4,981 |
(8.0) |
(25.9) |
(15.4) |
| Retention of areas |
9 |
9 |
9 |
36 |
44 |
− |
− |
(18.2) |
| Lifting cost Brazil (US$/boe) |
6.34 |
5.78 |
5.52 |
6.05 |
5.59 |
9.8 |
14.8 |
8.3 |
| Pre-salt |
4.01 |
3.78 |
3.78 |
3.91 |
3.67 |
6.2 |
6.1 |
6.4 |
| Deep and ultra-deep post-salt |
17.52 |
16.57 |
12.12 |
16.43 |
12.52 |
5.7 |
44.5 |
31.2 |
| Onshore and shallow waters |
19.00 |
16.74 |
16.15 |
17.22 |
15.67 |
13.5 |
17.7 |
9.9 |
| Lifting cost + Leases |
9.11 |
8.23 |
7.79 |
8.56 |
7.66 |
10.6 |
16.9 |
11.8 |
| Pre-salt |
6.65 |
6.10 |
6.13 |
6.32 |
5.77 |
9.1 |
8.5 |
9.5 |
| Deep and ultra-deep post-salt |
21.56 |
20.41 |
14.37 |
20.03 |
14.84 |
5.6 |
50.0 |
35.0 |
| Onshore and shallow waters |
19.00 |
16.74 |
16.15 |
17.22 |
15.67 |
13.5 |
17.7 |
9.9 |
| Lifting cost + Production taxes |
19.21 |
19.49 |
19.78 |
19.73 |
19.69 |
(1.4) |
(2.9) |
0.2 |
| Lifting cost + Production taxes + Leases |
21.97 |
21.94 |
22.05 |
22.24 |
21.76 |
0.1 |
(0.4) |
2.2 |
| (*) EBITDA margin and ROCE variations in percentage points. |
In 2024, the E&P gross profit
was US$ 35.7 billion, a 10% decrease compared to 2023, mainly due to the decrease
in Brent prices and lower production. Nevertheless, we met the oil production targets established in the Strategic Plan 2024-2028+, considering
the range of ± 4%.
The annual operating profit was
US$ 28.1 billion, 18% lower than in 2023, mainly due to higher provisions expenses related to decommissioning of fields that are in the
process of being returned and tax expenses recorded in 2Q24, as well as lower revenue from divestments.
| |
PETROBRAS | Performance Report | 4Q24 | 17 |
Results by business segment
In 4Q24, the E&P gross profit
was US$ 7.4 billion, a 21% decrease compared to 3Q24, mainly due to the decrease in Brent prices and lower production.
The operating profit in 4Q24 was
US$ 3.1 billion, 62% lower than in 3Q24, reflecting the increase in operating expenses, mainly due to higher provisions related to decommissioning
of fields that are in the process of being returned.
The 2024 lifting cost, excluding
government participation and leases, was US$ 6.05/boe, representing a 8% increase compared to 2023 (US$ 5.59/boe), primarily due to higher
integrity expenses (especially on platform maintenance), subsea inspections and well interventions, associated with higher gas flow expenses
due to the startup of the Route 3 gas pipeline. These increases were offset by the devaluation of the Brazilian Real against the Dollar,
active portfolio management (including divestments), the production ramp-up of new systems that came into operation in 2023 (FPSO Almirante
Barroso, FPSO Anna Nery, and FPSO Anita Garibaldi), the startup of production from new systems in 2024 (FPSO Sepetiba, Maria Quitéria,
and Duque de Caxias), and the increase in the P-71 production capacity.
In 4Q24, we recorded a 10% increase
in lifting cost compared to 3Q24, mainly due to higher gas flow expenses associated with the startup of the Rota 3 pipeline, increased
expenses on well interventions in the Campos Basin, particularly in the Barracuda, Caratinga, Marlim Sul, and Roncador fields, and the
impact of lower production due to maintenance shutdowns in the Búzios field. These effects were partially offsets by the devaluation
of the Brazilian Real against the Dollar.
In the pre-salt, the lifting cost
increased by 6%, primarily due to the lower production in the Búzios field caused by production shutdowns, as well as higher gas
flow expenses resulting from the increased volume being transported with the startup of the Rota 3 pipeline. These effects were partially
offsets by the devaluation of the Brazilian Real against the Dollar.
In the post-salt, there was a
6% increase due to the intensification of well interventions in the Campos Basin, particularly in the Barracuda, Caratinga, Marlim Sul,
and Roncador fields, partially offset by the effect of the exchange rate depreciation.
In the onshore and shallow water
assets, there was a 14% increase due to rising costs associated with the intensification of well interventions in the Bahia onshore fields,
partially offset by the effect of the exchange rate depreciation.
| |
PETROBRAS | Performance Report | 4Q24 | 18 |
Results by business segment
Refining, Transportation and Marketing
Table 8 - RTM results
| |
|
|
|
|
|
Variation (%) (1) |
| US$ million |
4Q24 |
3Q24 |
4Q23 |
2024 |
2023 |
4Q24 X 3Q24 |
4Q24 X 4Q23 |
2024 X 2023 |
| Sales revenues |
19,291 |
21,739 |
25,278 |
85,281 |
94,868 |
(11.3) |
(23.7) |
(10.1) |
| Gross profit |
1,498 |
1,236 |
2,175 |
6,445 |
9,169 |
21.2 |
(31.1) |
(29.7) |
| Operating expenses |
(939) |
(781) |
(966) |
(3,257) |
(4,086) |
20.2 |
(2.8) |
(20.3) |
| Operating Income |
559 |
455 |
1,209 |
3,188 |
5,083 |
22.9 |
(53.8) |
(37.3) |
| Net income (loss) attributable to the shareholders of Petrobras |
15 |
255 |
711 |
1,324 |
3,036 |
(94.1) |
(97.9) |
(56.4) |
| Adjusted EBITDA of the segment |
1,500 |
1,078 |
1,963 |
5,932 |
8,052 |
39.1 |
(23.6) |
(26.3) |
| EBITDA margin of the segment (%) |
8 |
5 |
8 |
7 |
8 |
3 |
− |
(2) |
| ROCE (Return on Capital Employed) (%)(2) |
2.5 |
3.2 |
5.6 |
2.5 |
5.6 |
(0.7) |
(3.1) |
(3.1) |
| Refining cost (US$ / barrel) - Brazil |
2.48 |
2.84 |
2.75 |
2.65 |
2.38 |
(12.7) |
(9.8) |
11.3 |
| Price of basic oil products - Domestic Market (US$/bbl) |
83.30 |
88.10 |
104.30 |
89.57 |
101.05 |
(5.4) |
(20.1) |
(11.4) |
|
(1) Changes in EBITDA and ROCE margins in percentage points.
(2) Number for 3Q24 and 4Q23 revised due to the reclassification of fertilizer
assets that left G&EBC and were migrated to RTC in 2023 and, until then, were not fully reflected in the ROCE calculation. |
In 2024, the gross profit was
US$ 2.7 billion lower than in 2023, reflecting a deterioration in the external environment with the reduction of international margins
in the refining segment. Adjusting for the effect of inventory turnover of US$ 1.6 billion in 2024 and US$ 0.5 billion in 2023, the gross
profit would have been US$ 4.9 billion in 2024 and US$ 9.6 billion in 2023.
The sales volume was lower, mainly
for diesel, due to the increase in imports by third parties, primarily from Russia, and the rise in the mandatory blending content of
biodiesel in type B diesel and gasoline, reflecting the recovery of hydrated ethanol's share compared to C gasoline in flex-fuel vehicles.
The operating income in 2024 was
lower than in 2023, reflecting the reduction in gross profit, partially offset by lower operating expenses, mainly due to reduced selling
expenses resulting from the lower volume.
In 2024, the refining cost in
dollars per barrel was 11% higher than in 2023. This was mainly due to higher personnel expenses related to the collective labor agreement
and increased costs with materials and services related to maintenance and conservation. The processed throughput was slightly higher
in the year-over-year comparison (+0.8%), which, combined with the exchange rate effect, partially offset the increase in absolute costs.
Regarding the comparison between
the quarters, the RTM gross profit was 21% higher than that of 3Q24, mainly due to higher margins on oil products in the domestic market.
Adjusting for the effect of inventory turnover of $383 million in Q4 2024 and $186 million in Q3 2024, the RTM gross profit would have
been US$ 1,115 million in Q4 2024 and US$ 1,050 million in Q3 2024.
It is worth noting that in Q4
2024, higher margins were observed in the domestic market, mainly for diesel, following the increase in international margins for this
oil product. The sales volume in the domestic market was lower, primarily for diesel, due to seasonality with the end of the grain harvest
and reduced industrial activity, and for LPG due to higher temperatures and lower industrial activity. On the other hand, there was a
higher sales volume of gasoline and jet fuel, driven by the seasonality of the year-end holiday period.
In 4Q24, the operating income
was 23% higher than in Q3 2024, reflecting the increase in gross profit, partially offset by the rise in operating expenses.
Finally, in 4Q24, the refining
cost in dollars per barrel was 13% lower than in 3Q24. There were notable reductions in expenses with materials and services related to
the maintenance and conservation of operational units, along with the exchange rate effect that contributed to the decrease in the absolute
dollar value during the period. Throughput did not vary significantly between the quarters.
| |
PETROBRAS | Performance Report | 4Q24 | 19 |
Results by business segment
Gas and Low Carbon Energies
Table 9 – G&LCE results
| |
|
|
|
|
|
Variation (%) (1) |
| US$ million |
4Q24 |
3Q24 |
4Q23 |
2024 |
2023 |
4Q24 X 3Q24 |
4Q24 X 4Q23 |
2024 X 2023 |
| Sales revenues |
2,557 |
2,341 |
2,859 |
9,518 |
11,109 |
9.2 |
(10.6) |
(14.3) |
| Gross profit |
1,170 |
970 |
1,433 |
4,487 |
5,424 |
20.6 |
(18.4) |
(17.3) |
| Operating expenses |
(940) |
(801) |
(934) |
(3,497) |
(3,384) |
17.4 |
0.6 |
3.3 |
| Operating income |
230 |
169 |
499 |
990 |
2,040 |
36.1 |
(53.9) |
(51.5) |
| Net income (loss) attributable to the shareholders of Petrobras |
152 |
109 |
308 |
682 |
1,286 |
39.4 |
(50.6) |
(47.0) |
| Adjusted EBITDA of the segment |
368 |
299 |
715 |
1,529 |
2,694 |
23.1 |
(48.5) |
(43.2) |
| EBITDA margin of the segment (%) |
14 |
13 |
25 |
16 |
24 |
2 |
(11) |
(8) |
| ROCE (Return on Capital Employed) (%) (2) |
4.2 |
6.2 |
10.7 |
4.2 |
10.7 |
(2.0) |
(6.5) |
(6.5) |
| Natural gas sales price - Brazil (US$/bbl) |
57.79 |
59.61 |
62.60 |
62.25 |
68.22 |
(3.1) |
(7.7) |
(8.8) |
| Natural gas sales price - Brazil (US$/MMBtu) |
9.74 |
10.05 |
10.56 |
10.50 |
11.50 |
(3.1) |
(7.8) |
(8.7) |
| Fixed revenues from power auctions (3)(4) |
57 |
61 |
89 |
182 |
258 |
(8.0) |
(36.6) |
(29.3) |
| Average electricity sales price (US$/MWh) (4)(5) |
73.55 |
28.11 |
18.63 |
62.83 |
14.23 |
161.7 |
294.8 |
341.7 |
|
(1) EBITDA margin and ROCE variations in percentage points.
(2) 3Q24 and 4Q23 figure revised due to the reclassification of fertilizer
assets that left the G&LCE and were migrated to the RTM in 2023 and, until then, were not fully reflected in the ROCE calculation.
(3) The fixed revenue from auctions takes into account the remuneration
for thermal availability and inflexible electricity committed in auctions.
(4) For the current period, the figures for the Energy segment are subject
to possible changes once the final report from the Chamber of Electric Energy Commercialization - CCEE is issued.
(5) Previous quarter number revised after the issuance of the final report
from the Chamber of Electric Energy Commercialization - CCEE.
|
In 2024, the gross profit was
17% lower than in 2023, reflecting lower volumes and gas selling prices, resulting from the opening of the natural gas market, the reduction
in market share and the measures taken to preserve Petrobras's competitiveness, such as the performance premium that has been implemented
since June. The terminations of energy contracts, both in the regulated and free markets, also contributed to the drop in the annual gross
profit.
On the other hand, in 4Q24, the
segment's gross profit was 21% higher than in 3Q24, due to the accounting of revenues from annual contractual commitments in December
2024. This increase in revenues offset the reduction in the average selling price of natural gas, resulting from exchange rate fluctuations
and lower Brent prices.
| |
PETROBRAS | Performance Report | 4Q24 | 20 |
Reconciliation of Adjusted EBITDA
Reconciliation of Adjusted EBITDA
EBITDA is an indicator calculated as
the net income for the period plus taxes on profit, net financial result, depreciation and amortization. Petrobras announces EBITDA, as
authorized by CVM Resolution No. 156, of June 2022.
In order to reflect the management view
regarding the formation of the company's current business results, EBITDA is also presented adjusted (Adjusted EBITDA) as a result of:
results in equity-accounted investments; impairment, results with co-participation agreement in production fields and gains/losses on
disposal/write-offs of assets.
Adjusted EBITDA, reflecting the sum
of the last twelve months (Last Twelve Months), also represents an alternative to the company's operating cash generation. This measure
is used to calculate the Gross Debt and Net Debt to Adjusted EBITDA metric, helping to evaluate the company's leverage and liquidity.
EBITDA and adjusted EBITDA are not provided
for in International Financial Reporting Standards (IFRS) and should not serve as a basis for comparison with those disclosed by other
companies and should not be considered as a substitute for any other measure calculated in accordance with IFRS. These measures should
be considered in conjunction with other measures and indicators for a better understanding of the company's performance and financial
condition.
Table 10 - Reconciliation of Adjusted EBITDA
| |
|
|
|
|
|
Variation (%) (*) |
| US$ million |
4Q24 |
3Q24 |
4Q23 |
2024 |
2023 |
4Q24 X 3Q24 |
4Q24 X 4Q23 |
2024 X 2023 |
| Net income (loss) |
(2,766) |
5,891 |
6,282 |
7,605 |
24,995 |
− |
− |
(69.6) |
| Net finance income (expense) |
6,018 |
281 |
(295) |
15,107 |
2,333 |
2041.6 |
− |
547.5 |
| Income taxes |
(788) |
2,205 |
1,966 |
3,537 |
10,401 |
− |
− |
(66.0) |
| Depreciation, depletion and amortization |
2,996 |
2,983 |
3,632 |
12,479 |
13,280 |
0.4 |
(17.5) |
(6.0) |
| EBITDA |
5,460 |
11,360 |
11,585 |
38,728 |
51,009 |
(51.9) |
(52.9) |
(24.1) |
| Results of equity-accounted investments |
323 |
23 |
69 |
627 |
304 |
1304.3 |
368.1 |
106.3 |
| Impairment of assets (reversals), net |
1,577 |
− |
2,198 |
1,531 |
2,680 |
− |
(28.3) |
(42.9) |
| Results on disposal/write-offs of assets |
(39) |
97 |
(145) |
(228) |
(1,295) |
− |
(73.1) |
(82.4) |
| Results from co-participation agreements in bid areas |
(156) |
− |
(237) |
(259) |
(284) |
− |
(34.2) |
(8.8) |
| Adjusted EBITDA |
7,165 |
11,480 |
13,470 |
40,399 |
52,414 |
(37.6) |
(46.8) |
(22.9) |
| Adjusted EBITDA margin (%) |
34 |
49 |
50 |
44 |
51 |
(15.0) |
(16.0) |
(7.0) |
| (*) EBITDA Margin variations in percentage points. |
| |
PETROBRAS | Performance Report | 4Q24 | 21 |
Exhibits
Exhibits
Financial statements
Table 11 - Income statement - Consolidated
| US$ million |
4Q24 |
3Q24 |
4Q23 |
2024 |
2023 |
| Sales revenues |
20,815 |
23,366 |
27,107 |
91,416 |
102,409 |
| Cost of sales |
(10,832) |
(11,361) |
(12,453) |
(45,444) |
(48,435) |
| Gross profit |
9,983 |
12,005 |
14,654 |
45,972 |
53,974 |
| Selling expenses |
(1,080) |
(1,193) |
(1,329) |
(4,874) |
(5,038) |
| General and administrative expenses |
(440) |
(409) |
(454) |
(1,845) |
(1,594) |
| Exploration costs |
(198) |
(406) |
(154) |
(913) |
(982) |
| Research and development expenses |
(218) |
(195) |
(214) |
(789) |
(726) |
| Other taxes |
(108) |
(55) |
(247) |
(1,251) |
(890) |
| Impairment (losses) reversals, net |
(1,577) |
− |
(2,198) |
(1,531) |
(2,680) |
| Other income and expenses, net |
(3,575) |
(1,347) |
(2,036) |
(7,893) |
(4,031) |
| |
(7,196) |
(3,605) |
(6,632) |
(19,096) |
(15,941) |
| Operating income |
2,787 |
8,400 |
8,022 |
26,876 |
38,033 |
| Finance income |
434 |
491 |
588 |
1,954 |
2,169 |
| Finance expenses |
(1,072) |
(881) |
(1,047) |
(5,957) |
(3,922) |
| Foreign exchange gains (losses) and inflation indexation charges |
(5,380) |
109 |
754 |
(11,104) |
(580) |
| Net finance income (expense) |
(6,018) |
(281) |
295 |
(15,107) |
(2,333) |
| Results of equity-accounted investments |
(323) |
(23) |
(69) |
(627) |
(304) |
| Income (loss) before income taxes |
(3,554) |
8,096 |
8,248 |
11,142 |
35,396 |
| Income taxes |
788 |
(2,205) |
(1,966) |
(3,537) |
(10,401) |
| Net Income (loss) |
(2,766) |
5,891 |
6,282 |
7,605 |
24,995 |
| Net income (loss) attributable to: |
|
|
|
|
|
| Shareholders of Petrobras |
(2,780) |
5,870 |
6,259 |
7,528 |
24,884 |
| Non-controlling interests |
14 |
21 |
23 |
77 |
111 |
| |
PETROBRAS | Performance Report | 4Q24 | 22 |
Exhibits
Table 12 - Statement of financial position
– Consolidated
| ASSETS - US$ million |
12.31.2024 |
12.31.2023 |
| Current assets |
21,836 |
32,445 |
| Cash and cash equivalents |
3,271 |
12,727 |
| Marketable securities |
4,263 |
2,819 |
| Trade and other receivables, net |
3,566 |
6,135 |
| Inventories |
6,710 |
7,681 |
| Recoverable taxes |
1,966 |
1,178 |
| Assets classified as held for sale |
510 |
335 |
| Other current assets |
1,550 |
1,570 |
| Non-current assets |
159,809 |
184,622 |
| Long-term receivables |
20,610 |
26,798 |
| Trade and other receivables, net |
1,256 |
1,847 |
| Marketable securities |
582 |
2,409 |
| Judicial deposits |
11,748 |
14,746 |
| Deferred income taxes |
922 |
965 |
| Other recoverable taxes |
3,601 |
4,516 |
| Other non-current assets |
2,501 |
2,315 |
| Investments |
659 |
1,358 |
| Property, plant and equipment |
136,285 |
153,424 |
| Intangible assets |
2,255 |
3,042 |
| Total assets |
181,645 |
217,067 |
| |
|
|
| |
|
|
| LIABILITIES - US$ million |
12.31.2024 |
12.31.2023 |
| Current liabilities |
31,460 |
33,860 |
| Trade payables |
6,082 |
4,813 |
| Finance debt |
2,566 |
4,322 |
| Lease liability |
8,542 |
7,200 |
| Taxes payable |
4,684 |
5,466 |
| Dividends payable |
2,657 |
3,539 |
| Provision for decommissioning costs |
1,696 |
2,032 |
| Employee benefits |
2,315 |
2,932 |
| Liabilities related to assets classified as held for sale |
713 |
541 |
| Other current liabilities |
2,205 |
3,015 |
| Non-current liabilities |
90,835 |
104,232 |
| Finance debt |
20,596 |
24,479 |
| Lease liability |
28,607 |
26,599 |
| Income taxes payable |
530 |
299 |
| Deferred income taxes |
1,470 |
10,910 |
| Employee benefits |
10,672 |
15,579 |
| Provision for legal proceedings |
2,833 |
3,305 |
| |
PETROBRAS | Performance Report | 4Q24 | 23 |
| Provision for decommissioning costs |
24,507 |
21,171 |
| Other non-current liabilities |
1,620 |
1,890 |
| Shareholders' equity |
59,350 |
78,975 |
| Attributable to the shareholders of Petrobras |
59,106 |
78,583 |
| Share capital (net of share issuance costs) |
107,101 |
107,101 |
| Capital reserve and capital transactions |
29 |
410 |
| Profit reserves |
61,446 |
72,641 |
| Retained earnings (losses) |
− |
− |
| Accumulated other comprehensive deficit |
(109,470) |
(101,569) |
| Attributable to non-controlling interests |
244 |
392 |
| Total liabilities and shareholders' equity |
181,645 |
217,067 |
| |
PETROBRAS | Performance Report | 4Q24 | 24 |
Table 13 - Statement of cash flow –
Consolidated
| US$ million |
4Q24 |
3Q24 |
4Q23 |
2024 |
2023 |
| Cash flows from operating activities |
|
|
|
|
|
| Net income (loss) for the period |
(2,766) |
5,891 |
6,282 |
7,605 |
24,995 |
| Adjustments for: |
|
|
|
|
|
| Pension and medical benefits |
390 |
409 |
389 |
2,934 |
1,542 |
| Results of equity-accounted investments |
323 |
23 |
69 |
627 |
304 |
| Depreciation, depletion and amortization |
2,996 |
2,983 |
3,632 |
12,479 |
13,280 |
| Impairment of assets (reversals), net |
1,577 |
− |
2,198 |
1,531 |
2,680 |
| Inventory write down (write-back) to net realizable value |
− |
2 |
(3) |
(42) |
(7) |
| Allowance (reversals) for credit loss on trade and other receivables, net |
206 |
6 |
(9) |
260 |
40 |
| Exploratory expenditure write-offs |
68 |
309 |
11 |
482 |
421 |
| Gain on disposal/write-offs of assets |
(39) |
97 |
(145) |
(228) |
(1,295) |
| Foreign exchange, indexation and finance charges |
6,264 |
168 |
(316) |
15,407 |
2,498 |
| Income taxes |
(788) |
2,205 |
1,966 |
3,537 |
10,401 |
| Revision and unwinding of discount on the provision for decommissioning costs |
2,803 |
242 |
1,390 |
3,584 |
2,052 |
| Results from co-participation agreements in bid areas |
(156) |
− |
(237) |
(259) |
(284) |
| Early termination and cash outflows revision of lease agreements |
(115) |
(88) |
(54) |
(349) |
(415) |
| Losses with legal, administrative and arbitration proceedings, net |
188 |
287 |
125 |
996 |
797 |
| Decrease (Increase) in assets |
|
|
|
|
|
| Trade and other receivables |
200 |
163 |
(499) |
1,822 |
88 |
| Inventories |
59 |
1 |
432 |
(295) |
1,564 |
| Judicial deposits |
(185) |
(160) |
(623) |
229 |
(1,723) |
| Other assets |
(56) |
(38) |
155 |
(165) |
324 |
| Increase (Decrease) in liabilities |
|
|
|
|
|
| Trade payables |
352 |
392 |
63 |
986 |
(954) |
| Other taxes payable |
(667) |
(459) |
(10) |
(2,988) |
(431) |
| Pension and medical benefits |
(243) |
(276) |
(244) |
(1,001) |
(927) |
| Provisions for legal proceedings |
(171) |
(96) |
(225) |
(467) |
(591) |
| Other employee benefits |
(209) |
499 |
193 |
(80) |
356 |
| Provision for decommissioning costs |
(232) |
(282) |
(305) |
(977) |
(902) |
| Other liabilities |
(130) |
(250) |
(198) |
(737) |
(569) |
| Income taxes paid |
(1,465) |
(721) |
(2,368) |
(6,907) |
(10,032) |
| Net cash provided by operating activities |
8,204 |
11,307 |
11,669 |
37,984 |
43,212 |
| Cash flows from investing activities |
|
|
|
|
|
| Acquisition of PP&E and intangible assets |
(4,429) |
(4,443) |
(3,594) |
(14,644) |
(12,114) |
| Acquisition of equity interests |
(9) |
(7) |
(2) |
(22) |
(24) |
| Proceeds from disposal of assets - Divestment |
72 |
25 |
42 |
863 |
3,606 |
| Financial compensation from co-participation agreements |
− |
− |
− |
397 |
391 |
| Divestment (investment) in marketable securities |
1,070 |
(374) |
313 |
(109) |
98 |
| |
PETROBRAS | Performance Report | 4Q24 | 25 |
| Dividends received |
25 |
57 |
13 |
146 |
88 |
| Net cash (used in) provided by investing activities |
(3,271) |
(4,742) |
(3,228) |
(13,369) |
(7,955) |
| Cash flows from financing activities |
|
|
|
|
|
| Changes in non-controlling interest |
23 |
(232) |
103 |
(84) |
1 |
| Financing and loans, net: |
|
|
|
|
|
| Proceeds from finance debt |
576 |
986 |
910 |
2,129 |
2,210 |
| Repayment of principal - finance debt |
(2,309) |
(1,909) |
(1,711) |
(6,536) |
(4,193) |
| Repayment of interest - finance debt |
(389) |
(534) |
(406) |
(1,918) |
(1,978) |
| Repayment of lease liability |
(2,099) |
(1,913) |
(1,792) |
(7,895) |
(6,286) |
| Dividends paid to Shareholders of Petrobras |
(5,456) |
(2,293) |
(4,436) |
(18,327) |
(19,670) |
| Share repurchase program |
− |
− |
(538) |
(380) |
(735) |
| Dividends paid to non-controlling interests |
− |
− |
(1) |
(77) |
(49) |
| Net cash used in financing activities |
(9,654) |
(5,895) |
(7,871) |
(33,088) |
(30,700) |
| Effect of exchange rate changes on cash and cash equivalents |
(702) |
140 |
47 |
(983) |
174 |
| Net change in cash and cash equivalents |
(5,423) |
810 |
617 |
(9,456) |
4,731 |
| Cash and cash equivalents at the beginning of the period |
8,694 |
7,884 |
12,110 |
12,727 |
7,996 |
| Cash and cash equivalents at the end of the period |
3,271 |
8,694 |
12,727 |
3,271 |
12,727 |
| |
PETROBRAS | Performance Report | 4Q24 | 26 |
Exhibits
Table 14 – Net revenues by products
| |
|
|
|
|
|
Variation (%) |
| US$ million |
4Q24 |
3Q24 |
4Q23 |
2024 |
2023 |
4Q24 X 3Q24 |
4Q24 X 4Q23 |
2024 X 2023 |
| Diesel |
6,436 |
7,031 |
8,685 |
27,522 |
32,260 |
(8.5) |
(25.9) |
(14.7) |
| Gasoline |
3,274 |
3,140 |
3,428 |
12,692 |
14,309 |
4.3 |
(4.5) |
(11.3) |
| Liquefied petroleum gas (LPG) |
766 |
849 |
784 |
3,166 |
3,506 |
(9.8) |
(2.3) |
(9.7) |
| Jet fuel |
1,041 |
1,146 |
1,338 |
4,518 |
5,015 |
(9.2) |
(22.2) |
(9.9) |
| Naphtha |
479 |
480 |
480 |
1,869 |
1,837 |
(0.2) |
(0.2) |
1.7 |
| Fuel oil (including bunker fuel) |
190 |
209 |
324 |
976 |
1,158 |
(9.1) |
(41.4) |
(15.7) |
| Other oil products |
969 |
1,212 |
1,064 |
4,273 |
4,428 |
(20.0) |
(8.9) |
(3.5) |
| Subtotal oil products |
13,155 |
14,067 |
16,103 |
55,016 |
62,513 |
(6.5) |
(18.3) |
(12.0) |
| Natural gas |
1,097 |
1,152 |
1,325 |
4,707 |
5,632 |
(4.8) |
(17.2) |
(16.4) |
| Crude oil |
913 |
1,143 |
1,478 |
4,334 |
5,475 |
(20.1) |
(38.2) |
(20.8) |
| Renewables and nitrogen products |
76 |
73 |
32 |
223 |
94 |
4.1 |
137.5 |
137.2 |
| Revenues from non-exercised rights |
77 |
101 |
215 |
439 |
860 |
(23.8) |
(64.2) |
(49.0) |
| Electricity |
235 |
277 |
234 |
744 |
657 |
(15.2) |
0.4 |
13.2 |
| Services, agency and others |
171 |
192 |
262 |
812 |
1,059 |
(10.9) |
(34.7) |
(23.3) |
| Total domestic market |
15,724 |
17,005 |
19,649 |
66,275 |
76,290 |
(7.5) |
(20.0) |
(13.1) |
| Exports |
4,893 |
6,214 |
7,260 |
24,251 |
25,012 |
(21.3) |
(32.6) |
(3.0) |
| Crude oil |
3,589 |
4,627 |
5,202 |
18,290 |
18,447 |
(22.4) |
(31.0) |
(0.9) |
| Fuel oil (including bunker fuel) |
1,049 |
1,278 |
1,380 |
4,775 |
5,114 |
(17.9) |
(24.0) |
(6.6) |
| Other oil products and other products |
255 |
309 |
678 |
1,186 |
1,451 |
(17.5) |
(62.4) |
(18.3) |
| Sales abroad (*) |
198 |
147 |
198 |
890 |
1,107 |
34.7 |
− |
(19.6) |
| Total foreign market |
5,091 |
6,361 |
7,458 |
25,141 |
26,119 |
(20.0) |
(31.7) |
(3.7) |
| Total |
20,815 |
23,366 |
27,107 |
91,416 |
102,409 |
(10.9) |
(23.2) |
(10.7) |
| (*) Sales revenues from operations outside of Brazil, including trading and excluding exports. |
| |
PETROBRAS | Performance Report | 4Q24 | 27 |
Table 15 – Cost of goods sold by nature
| |
|
|
|
|
|
Variation (%) |
| US$ million |
4Q24 |
3Q24 |
4Q23 |
2024 |
2023 |
4Q24 X 3Q24 |
4Q24 X 4Q23 |
2024 X 2023 |
| Raw material, products for resale, materials and third-party services (*) |
(5,438) |
(5,632) |
(5,351) |
(22,368) |
(21,912) |
(3.4) |
1.6 |
2.1 |
| Acquisitions |
(3,973) |
(4,134) |
(3,727) |
(16,278) |
(16,198) |
(3.9) |
6.6 |
0.5 |
| Crude oil imports |
(2,323) |
(2,386) |
(2,925) |
(9,458) |
(9,358) |
(2.6) |
(20.6) |
1.1 |
| Oil products imports |
(1,099) |
(1,320) |
(209) |
(5,080) |
(4,649) |
(16.7) |
425.8 |
9.3 |
| Natural gas imports |
(551) |
(428) |
(593) |
(1,740) |
(2,191) |
28.7 |
(7.1) |
(20.6) |
| Third-party services and others |
(1,465) |
(1,498) |
(1,624) |
(6,090) |
(5,714) |
(2.2) |
(9.8) |
6.6 |
| Depreciation, depletion and amortization |
(2,343) |
(2,362) |
(3,039) |
(9,777) |
(10,779) |
(0.8) |
(22.9) |
(9.3) |
| Production taxes |
(2,620) |
(2,836) |
(3,255) |
(11,392) |
(12,108) |
(7.6) |
(19.5) |
(5.9) |
| Employee compensation |
(411) |
(435) |
(465) |
(1,888) |
(1,690) |
(5.5) |
(11.6) |
11.7 |
| Inventory turnover |
(20) |
(96) |
(343) |
(19) |
(1,946) |
(79.2) |
(94.2) |
(99.0) |
| Total |
(10,832) |
(11,361) |
(12,453) |
(45,444) |
(48,435) |
(4.7) |
(13.0) |
(6.2) |
| (*) It Includes short-term leases. |
| |
PETROBRAS | Performance Report | 4Q24 | 28 |
Exhibits
Table 16 – Operating expenses
| |
|
|
|
|
|
Variation (%) |
| US$ million |
4Q24 |
3Q24 |
4Q23 |
2024 |
2023 |
4Q24 X 3Q24 |
4Q24 X 4Q23 |
2024 X 2023 |
| Selling, General and Administrative Expenses |
(1,520) |
(1,602) |
(1,783) |
(6,719) |
(6,632) |
(5.1) |
(14.8) |
1.3 |
| Selling expenses |
(1,080) |
(1,193) |
(1,329) |
(4,874) |
(5,038) |
(9.5) |
(18.7) |
(3.3) |
| Materials, third-party services, freight, rent and other related costs |
(889) |
(1,002) |
(1,146) |
(4,080) |
(4,296) |
(11.3) |
(22.4) |
(5.0) |
| Depreciation, depletion and amortization |
(172) |
(159) |
(143) |
(670) |
(609) |
8.2 |
20.3 |
10.0 |
| Reversal (allowance) for expected credit losses |
10 |
− |
(8) |
2 |
(22) |
− |
− |
− |
| Employee compensation |
(29) |
(32) |
(32) |
(126) |
(111) |
(9.4) |
(9.4) |
13.5 |
| General and administrative expenses |
(440) |
(409) |
(454) |
(1,845) |
(1,594) |
7.6 |
(3.1) |
15.7 |
| Employee compensation |
(269) |
(278) |
(289) |
(1,204) |
(1,036) |
(3.2) |
(6.9) |
16.2 |
| Materials, third-party services, rent and other related costs |
(133) |
(96) |
(129) |
(495) |
(435) |
38.5 |
3.1 |
13.8 |
| Depreciation, depletion and amortization |
(38) |
(35) |
(36) |
(146) |
(123) |
8.6 |
5.6 |
18.7 |
| Exploration costs |
(198) |
(406) |
(154) |
(913) |
(982) |
(51.2) |
28.6 |
(7.0) |
| Research and Development |
(218) |
(195) |
(214) |
(789) |
(726) |
11.8 |
1.9 |
8.7 |
| Other taxes |
(108) |
(55) |
(247) |
(1,251) |
(890) |
96.4 |
(56.3) |
40.6 |
| Impairment (losses) reversals, net |
(1,577) |
− |
(2,198) |
(1,531) |
(2,680) |
− |
(28.3) |
(42.9) |
| Other income and expenses, net |
(3,575) |
(1,347) |
(2,036) |
(7,893) |
(4,031) |
165.4 |
75.6 |
95.8 |
| Total |
(7,196) |
(3,605) |
(6,632) |
(19,096) |
(15,941) |
99.6 |
8.5 |
19.8 |
| |
| |
PETROBRAS | Performance Report | 4Q24 | 29 |
Exhibits
Table 17 – Financial results
| |
|
|
|
|
|
Variation (%) |
| US$ million |
4Q24 |
3Q24 |
4Q23 |
2024 |
2023 |
4Q24 X 3Q24 |
4Q24 X 4Q23 |
2024 X 2023 |
| Finance income |
434 |
491 |
588 |
1,954 |
2,169 |
(11.6) |
(26.2) |
(9.9) |
| Income from investments and marketable securities (Government Bonds) |
332 |
363 |
446 |
1,507 |
1,657 |
(8.5) |
(25.6) |
(9.1) |
| Other finance income |
102 |
128 |
142 |
447 |
512 |
(20.3) |
(28.2) |
(12.7) |
| Finance expenses |
(1,072) |
(881) |
(1,047) |
(5,957) |
(3,922) |
21.7 |
2.4 |
51.9 |
| Interest on finance debt |
(518) |
(555) |
(549) |
(2,146) |
(2,264) |
(6.7) |
(5.6) |
(5.2) |
| Unwinding of discount on lease liability |
(617) |
(544) |
(532) |
(2,265) |
(1,785) |
13.4 |
16.0 |
26.9 |
| Capitalized borrowing costs |
413 |
398 |
363 |
1,570 |
1,290 |
3.8 |
13.8 |
21.7 |
| Unwinding of discount on the provision for decommissioning costs |
(228) |
(242) |
(210) |
(1,000) |
(857) |
(5.8) |
8.6 |
16.7 |
| Tax settlement programs - federal taxes |
19 |
125 |
− |
(1,785) |
− |
(84.8) |
− |
− |
| Other finance expenses |
(141) |
(63) |
(119) |
(331) |
(306) |
123.8 |
18.5 |
8.2 |
| Foreign exchange gains (losses) and indexation charges |
(5,380) |
109 |
754 |
(11,104) |
(580) |
− |
− |
1814.5 |
| Foreign exchange gains (losses) |
(4,625) |
587 |
880 |
(8,459) |
2,268 |
− |
− |
− |
| Real x U.S. dollar |
(4,755) |
701 |
979 |
(8,503) |
2,396 |
− |
− |
− |
| Other currencies |
130 |
(114) |
(99) |
44 |
(128) |
− |
− |
− |
| Reclassification of hedge accounting to the Statement of Income |
(874) |
(821) |
(773) |
(2,992) |
(3,763) |
6.5 |
13.1 |
(20.5) |
| Tax settlement programs - federal taxes |
(32) |
(15) |
− |
(267) |
− |
113.3 |
− |
− |
| Indexation to the Selic interest rate of anticipated dividends and dividends payable |
88 |
18 |
129 |
(282) |
(299) |
388.9 |
(31.8) |
(5.7) |
| Legal agreement with Eletrobras - compulsory loans |
− |
− |
236 |
− |
236 |
− |
− |
− |
| Recoverable taxes inflation indexation income |
15 |
173 |
91 |
92 |
204 |
(91.3) |
(83.5) |
(54.9) |
| Other foreign exchange gains and indexation charges, net |
48 |
167 |
191 |
804 |
774 |
(71.3) |
(74.9) |
3.9 |
| Total |
(6,018) |
(281) |
295 |
(15,107) |
(2,333) |
2041.6 |
− |
547.5 |
| |
| |
PETROBRAS | Performance Report | 4Q24 | 30 |
Exhibits
Financial information by business segment
Table 18 - Consolidated income by business
segment – 2024
| US$ million |
E&P |
RTM |
G&LCE |
CORP. |
ELIMIN. |
TOTAL |
| Sales revenues |
60,516 |
85,281 |
9,518 |
319 |
(64,218) |
91,416 |
| Intersegments |
60,208 |
1,035 |
2,969 |
6 |
(64,218) |
− |
| Third parties |
308 |
84,246 |
6,549 |
313 |
− |
91,416 |
| Cost of sales |
(24,823) |
(78,836) |
(5,031) |
(294) |
63,540 |
(45,444) |
| Gross profit |
35,693 |
6,445 |
4,487 |
25 |
(678) |
45,972 |
| Expenses |
(7,639) |
(3,257) |
(3,497) |
(4,703) |
− |
(19,096) |
| Selling expenses |
(1) |
(1,928) |
(2,936) |
(9) |
− |
(4,874) |
| General and administrative expenses |
(64) |
(356) |
(115) |
(1,310) |
− |
(1,845) |
| Exploration costs |
(913) |
− |
− |
− |
− |
(913) |
| Research and development expenses |
(629) |
(6) |
(4) |
(150) |
− |
(789) |
| Other taxes |
(692) |
(47) |
(18) |
(494) |
− |
(1,251) |
| Impairment (losses) reversals, net |
(1,244) |
(300) |
− |
13 |
− |
(1,531) |
| Other income and expenses, net |
(4,096) |
(620) |
(424) |
(2,753) |
− |
(7,893) |
| Operating income (loss) |
28,054 |
3,188 |
990 |
(4,678) |
(678) |
26,876 |
| Net finance income (expense) |
− |
− |
− |
(15,107) |
− |
(15,107) |
| Results of equity-accounted investments |
76 |
(780) |
80 |
(3) |
− |
(627) |
| Income (loss) before income taxes |
28,130 |
2,408 |
1,070 |
(19,788) |
(678) |
11,142 |
| Income taxes |
(9,540) |
(1,084) |
(335) |
7,190 |
232 |
(3,537) |
| Net income (loss) |
18,590 |
1,324 |
735 |
(12,598) |
(446) |
7,605 |
| Net income (loss) attributable to: |
|
|
|
|
|
|
| Shareholders of Petrobras |
18,593 |
1,324 |
682 |
(12,625) |
(446) |
7,528 |
| Non-controlling interests |
(3) |
− |
53 |
27 |
− |
77 |
| |
PETROBRAS | Performance Report | 4Q24 | 31 |
Exhibits
Table 19 - Consolidated income by business
segment – 2023
| US$ million |
E&P |
RTM |
G&LCE |
CORP. |
ELIMIN. |
TOTAL |
| Sales revenues |
66,880 |
94,868 |
11,109 |
365 |
(70,813) |
102,409 |
| Intersegments |
66,113 |
1,404 |
3,285 |
11 |
(70,813) |
− |
| Third parties |
767 |
93,464 |
7,824 |
354 |
− |
102,409 |
| Cost of sales |
(27,239) |
(85,699) |
(5,685) |
(370) |
70,558 |
(48,435) |
| Gross profit |
39,641 |
9,169 |
5,424 |
(5) |
(255) |
53,974 |
| Expenses |
(5,615) |
(4,086) |
(3,384) |
(2,857) |
1 |
(15,941) |
| Selling expenses |
(12) |
(2,156) |
(2,838) |
(33) |
1 |
(5,038) |
| General and administrative expenses |
(74) |
(327) |
(80) |
(1,113) |
− |
(1,594) |
| Exploration costs |
(982) |
− |
− |
− |
− |
(982) |
| Research and development expenses |
(569) |
(16) |
(3) |
(138) |
− |
(726) |
| Other taxes |
(454) |
(27) |
(49) |
(360) |
− |
(890) |
| Impairment (losses) reversals, net |
(2,105) |
(524) |
(81) |
30 |
− |
(2,680) |
| Other income and expenses, net |
(1,419) |
(1,036) |
(333) |
(1,243) |
− |
(4,031) |
| Operating income (loss) |
34,026 |
5,083 |
2,040 |
(2,862) |
(254) |
38,033 |
| Net finance income (expense) |
− |
− |
− |
(2,333) |
− |
(2,333) |
| Results of equity-accounted investments |
(7) |
(318) |
10 |
11 |
− |
(304) |
| Income (loss) before income taxes |
34,019 |
4,765 |
2,050 |
(5,184) |
(254) |
35,396 |
| Income taxes |
(11,571) |
(1,729) |
(693) |
3,506 |
86 |
(10,401) |
| Net income (loss) |
22,448 |
3,036 |
1,357 |
(1,678) |
(168) |
24,995 |
| Net income (loss) attributable to: |
|
|
|
|
|
|
| Shareholders of Petrobras |
22,453 |
3,036 |
1,286 |
(1,723) |
(168) |
24,884 |
| Non-controlling interests |
(5) |
− |
71 |
45 |
− |
111 |
| |
PETROBRAS | Performance Report | 4Q24 | 32 |
Exhibits
Table 20 - Quarterly consolidated income by
business segment – 4Q24
| US$ million |
E&P |
RTM |
G&LCE |
CORP. |
ELIMIN. |
TOTAL |
| Sales revenues |
13,388 |
19,291 |
2,557 |
79 |
(14,500) |
20,815 |
| Intersegments |
13,333 |
258 |
908 |
1 |
(14,500) |
− |
| Third parties |
55 |
19,033 |
1,649 |
78 |
− |
20,815 |
| Cost of sales |
(6,002) |
(17,793) |
(1,387) |
(70) |
14,420 |
(10,832) |
| Gross profit |
7,386 |
1,498 |
1,170 |
9 |
(80) |
9,983 |
| Expenses |
(4,236) |
(939) |
(940) |
(1,081) |
− |
(7,196) |
| Selling expenses |
− |
(359) |
(728) |
7 |
− |
(1,080) |
| General and administrative expenses |
(21) |
(91) |
(21) |
(307) |
− |
(440) |
| Exploration costs |
(198) |
− |
− |
− |
− |
(198) |
| Research and development expenses |
(178) |
(2) |
(2) |
(36) |
− |
(218) |
| Other taxes |
45 |
(15) |
(4) |
(134) |
− |
(108) |
| Impairment (losses) reversals, net |
(1,240) |
(337) |
− |
− |
− |
(1,577) |
| Other income and expenses, net |
(2,644) |
(135) |
(185) |
(611) |
− |
(3,575) |
| Operating income (loss) |
3,150 |
559 |
230 |
(1,072) |
(80) |
2,787 |
| Net finance income (expense) |
− |
− |
− |
(6,018) |
− |
(6,018) |
| Results of equity-accounted investments |
14 |
(354) |
14 |
3 |
− |
(323) |
| Income (loss) before income taxes |
3,164 |
205 |
244 |
(7,087) |
(80) |
(3,554) |
| Income taxes |
(1,071) |
(190) |
(78) |
2,100 |
27 |
788 |
| Net income (loss) |
2,093 |
15 |
166 |
(4,987) |
(53) |
(2,766) |
| Net income (loss) attributable to: |
|
|
|
|
|
|
| Shareholders of Petrobras |
2,094 |
15 |
152 |
(4,988) |
(53) |
(2,780) |
| Non-controlling interests |
(1) |
− |
14 |
1 |
− |
14 |
| |
PETROBRAS | Performance Report | 4Q24 | 33 |
Exhibits
Table 21 - Quarterly consolidated income by
business segment – 3Q24
| US$ million |
E&P |
RTM |
G&LCE |
CORP. |
ELIMIN. |
TOTAL |
| Sales revenues |
15,383 |
21,739 |
2,341 |
82 |
(16,179) |
23,366 |
| Intersegments |
15,310 |
226 |
642 |
1 |
(16,179) |
− |
| Third parties |
73 |
21,513 |
1,699 |
81 |
− |
23,366 |
| Cost of sales |
(5,979) |
(20,503) |
(1,371) |
(76) |
16,568 |
(11,361) |
| Gross profit |
9,404 |
1,236 |
970 |
6 |
389 |
12,005 |
| Expenses |
(1,222) |
(781) |
(801) |
(801) |
− |
(3,605) |
| Selling expenses |
− |
(480) |
(711) |
(2) |
− |
(1,193) |
| General and administrative expenses |
(1) |
(89) |
(31) |
(288) |
− |
(409) |
| Exploration costs |
(406) |
− |
− |
− |
− |
(406) |
| Research and development expenses |
(163) |
(2) |
(2) |
(28) |
− |
(195) |
| Other taxes |
92 |
(4) |
(5) |
(138) |
− |
(55) |
| Impairment (losses) reversals, net |
− |
− |
− |
− |
− |
− |
| Other income and expenses, net |
(744) |
(206) |
(52) |
(345) |
− |
(1,347) |
| Operating income (loss) |
8,182 |
455 |
169 |
(795) |
389 |
8,400 |
| Net finance income (expense) |
− |
− |
− |
(281) |
− |
(281) |
| Results of equity-accounted investments |
15 |
(45) |
9 |
(2) |
− |
(23) |
| Income (loss) before income taxes |
8,197 |
410 |
178 |
(1,078) |
389 |
8,096 |
| Income taxes |
(2,782) |
(155) |
(57) |
921 |
(132) |
(2,205) |
| Net income (loss) |
5,415 |
255 |
121 |
(157) |
257 |
5,891 |
| Net income (loss) attributable to: |
|
|
|
|
|
|
| Shareholders of Petrobras |
5,416 |
255 |
109 |
(167) |
257 |
5,870 |
| Non-controlling interests |
(1) |
− |
12 |
10 |
− |
21 |
| |
PETROBRAS | Performance Report | 4Q24 | 34 |
Exhibits
Table 22 - Other income and expenses by segment
– 2024
| US$ million |
E&P |
RTM |
G&LCE |
CORP. |
ELIMIN. |
TOTAL |
| Stoppages for asset maintenance and pre-operating expenses |
(2,419) |
(80) |
(98) |
(20) |
− |
(2,617) |
| Losses on decommissioning of returned/abandoned areas |
(2,584) |
− |
− |
− |
− |
(2,584) |
| Pension and medical benefits - retirees |
− |
− |
− |
(2,196) |
− |
(2,196) |
| Losses with legal, administrative and arbitration proceedings |
(386) |
(411) |
(30) |
(169) |
− |
(996) |
| Variable compensation programs |
(407) |
(227) |
(47) |
(251) |
− |
(932) |
| Operating expenses with thermoelectric power plants |
− |
− |
(221) |
− |
− |
(221) |
| Results from co-participation agreements in bid areas |
259 |
− |
− |
− |
− |
259 |
| Ship/take or pay agreements |
5 |
79 |
132 |
3 |
− |
219 |
| Results on disposal/write-offs of assets |
234 |
51 |
18 |
(75) |
− |
228 |
| Others |
1,202 |
(32) |
(178) |
(45) |
− |
947 |
| Total |
(4,096) |
(620) |
(424) |
(2,753) |
− |
(7,893) |
| |
Table 23 - Other income and expenses by segment – 2023
| US$ million |
E&P |
RTM |
G&LCE |
CORP. |
ELIMIN. |
TOTAL |
| Stoppages for asset maintenance and pre-operating expenses |
(2,105) |
(21) |
(52) |
(27) |
− |
(2,205) |
| Losses on decommissioning of returned/abandoned areas |
(1,195) |
− |
− |
− |
− |
(1,195) |
| Pension and medical benefits - retirees |
− |
− |
− |
(1,172) |
− |
(1,172) |
| Losses with legal, administrative and arbitration proceedings |
(300) |
(391) |
(9) |
(97) |
− |
(797) |
| Variable compensation programs |
(416) |
(268) |
(53) |
(274) |
− |
(1,011) |
| Operating expenses with thermoelectric power plants |
− |
− |
(189) |
− |
− |
(189) |
| Results from co-participation agreements in bid areas |
284 |
− |
− |
− |
− |
284 |
| Ship/take or pay agreements |
4 |
40 |
192 |
2 |
− |
238 |
| Results on disposal/write-offs of assets |
1,370 |
(35) |
(48) |
8 |
− |
1,295 |
| Others |
939 |
(361) |
(174) |
317 |
− |
721 |
| Total |
(1,419) |
(1,036) |
(333) |
(1,243) |
− |
(4,031) |
| |
|
|
|
|
|
|
| |
PETROBRAS | Performance Report | 4Q24 | 35 |
Exhibits
Table 24 - Other income and expenses by segment
– 4Q24
| US$ million |
E&P |
RTM |
G&LCE |
CORP. |
ELIMIN. |
TOTAL |
| Stoppages for asset maintenance and pre-operating expenses |
(524) |
(14) |
(47) |
(8) |
− |
(593) |
| Losses on decommissioning of returned/abandoned areas |
(2,575) |
− |
− |
− |
− |
(2,575) |
| Pension and medical benefits - retirees |
− |
− |
− |
(289) |
− |
(289) |
| Losses with legal, administrative and arbitration proceedings |
(94) |
(42) |
(15) |
(37) |
− |
(188) |
| Variable compensation programs |
(31) |
(38) |
(5) |
(28) |
− |
(102) |
| Operating expenses with thermoelectric power plants |
− |
− |
(52) |
− |
− |
(52) |
| Results from co-participation agreements in bid areas |
156 |
− |
− |
− |
− |
156 |
| Ship/take or pay agreements |
2 |
47 |
23 |
1 |
− |
73 |
| Results on disposal/write-offs of assets |
55 |
(4) |
(5) |
(7) |
− |
39 |
| Others |
367 |
(84) |
(84) |
(243) |
− |
(44) |
| Total |
(2,644) |
(135) |
(185) |
(611) |
− |
(3,575) |
| |
PETROBRAS | Performance Report | 4Q24 | 36 |
Exhibits
Table 25 - Other income and expenses by segment
– 3Q24
| US$ million |
E&P |
RTM |
G&LCE |
CORP. |
ELIMIN. |
TOTAL |
| Stoppages for asset maintenance and pre-operating expenses |
(639) |
(13) |
(18) |
(2) |
− |
(672) |
| Losses on decommissioning of returned/abandoned areas |
− |
− |
− |
− |
− |
− |
| Pension and medical benefits - retirees |
− |
− |
− |
(305) |
− |
(305) |
| Gains (losses) with legal, administrative and arbitration proceedings |
(104) |
(196) |
21 |
(8) |
− |
(287) |
| Variable compensation programs |
(173) |
(61) |
(16) |
(90) |
− |
(340) |
| Operating expenses with thermoelectric power plants |
− |
− |
(50) |
− |
− |
(50) |
| Results from co-participation agreements in bid areas |
− |
− |
− |
− |
− |
− |
| Ship/take or pay agreements |
1 |
7 |
49 |
1 |
− |
58 |
| Results on disposal/write-offs of assets |
(58) |
(13) |
− |
(26) |
− |
(97) |
| Others |
229 |
70 |
(38) |
85 |
− |
346 |
| Total |
(744) |
(206) |
(52) |
(345) |
− |
(1,347) |
| |
| |
PETROBRAS | Performance Report | 4Q24 | 37 |
Exhibits
Table 26 - Consolidated assets by business
segment – 12.31.2024
| US$ million |
E&P |
RTM |
G&LCE |
CORP. |
ELIMIN. |
TOTAL |
| Total assets |
125,551 |
27,725 |
5,260 |
27,289 |
(4,180) |
181,645 |
| Current assets |
2,697 |
9,017 |
379 |
13,923 |
(4,180) |
21,836 |
| Non-current assets |
122,854 |
18,708 |
4,881 |
13,366 |
− |
159,809 |
| Long-term receivables |
7,056 |
2,217 |
91 |
11,246 |
− |
20,610 |
| Investments |
299 |
114 |
182 |
64 |
− |
659 |
| Property, plant and equipment |
113,761 |
16,257 |
4,541 |
1,726 |
− |
136,285 |
| Operating assets |
91,895 |
14,828 |
3,936 |
1,242 |
− |
111,901 |
| Assets under construction |
21,866 |
1,429 |
605 |
484 |
− |
24,384 |
| Intangible assets |
1,738 |
120 |
67 |
330 |
− |
2,255 |
Table 27 - Consolidated assets by business
segment – 12.31.2023
| US$ million |
E&P |
RTM |
G&LCE |
CORP. |
ELIMIN. |
TOTAL |
| Total assets |
138,868 |
34,802 |
6,776 |
41,899 |
(5,278) |
217,067 |
| Current assets |
2,804 |
11,002 |
370 |
23,547 |
(5,278) |
32,445 |
| Non-current assets |
136,064 |
23,800 |
6,406 |
18,352 |
− |
184,622 |
| Long-term receivables |
9,028 |
2,068 |
83 |
15,619 |
− |
26,798 |
| Investments |
344 |
811 |
145 |
58 |
− |
1,358 |
| Property, plant and equipment |
124,254 |
20,786 |
6,101 |
2,283 |
− |
153,424 |
| Operating assets |
108,405 |
18,128 |
3,605 |
1,770 |
− |
131,908 |
| Assets under construction |
15,849 |
2,658 |
2,496 |
513 |
− |
21,516 |
| Intangible assets |
2,438 |
135 |
77 |
392 |
− |
3,042 |
| |
PETROBRAS | Performance Report | 4Q24 | 38 |
Exhibits
Table 28 - Reconciliation of Adjusted EBITDA
by business segment – 2024
| US$ million |
E&P |
RTM |
G&LCE |
CORP. |
ELIMIN. |
TOTAL |
| Net income (loss) |
18,590 |
1,324 |
735 |
(12,598) |
(446) |
7,605 |
| Net finance income (expense) |
− |
− |
− |
15,107 |
− |
15,107 |
| Income taxes |
9,540 |
1,084 |
335 |
(7,190) |
(232) |
3,537 |
| Depreciation, depletion and amortization |
9,292 |
2,495 |
557 |
135 |
− |
12,479 |
| EBITDA |
37,422 |
4,903 |
1,627 |
(4,546) |
(678) |
38,728 |
| Results of equity-accounted investments |
(76) |
780 |
(80) |
3 |
− |
627 |
| Impairment of assets (reversals), net |
1,244 |
300 |
− |
(13) |
− |
1,531 |
| Results on disposal/write-offs of assets |
(234) |
(51) |
(18) |
75 |
− |
(228) |
| Results from co-participation agreements in bid areas |
(259) |
− |
− |
− |
− |
(259) |
| Adjusted EBITDA |
38,097 |
5,932 |
1,529 |
(4,481) |
(678) |
40,399 |
Table 29 - Reconciliation of Adjusted EBITDA
by business segment – 2023
| US$ million |
E&P |
RTM |
G&LCE |
CORP. |
ELIMIN. |
TOTAL |
| Net income (loss) |
22,448 |
3,036 |
1,357 |
(1,678) |
(168) |
24,995 |
| Net finance income (expense) |
− |
− |
− |
2,333 |
− |
2,333 |
| Income taxes |
11,571 |
1,729 |
693 |
(3,506) |
(86) |
10,401 |
| Depreciation, depletion and amortization |
10,230 |
2,410 |
525 |
115 |
− |
13,280 |
| EBITDA |
44,249 |
7,175 |
2,575 |
(2,736) |
(254) |
51,009 |
| Results of equity-accounted investments |
7 |
318 |
(10) |
(11) |
− |
304 |
| Impairment of assets (reversals), net |
2,105 |
524 |
81 |
(30) |
− |
2,680 |
| Results on disposal/write-offs of assets |
(1,370) |
35 |
48 |
(8) |
− |
(1,295) |
| Results from co-participation agreements in bid areas |
(284) |
− |
− |
− |
− |
(284) |
| Adjusted EBITDA |
44,707 |
8,052 |
2,694 |
(2,785) |
(254) |
52,414 |
| |
PETROBRAS | Performance Report | 4Q24 | 39 |
Exhibits
Table 30 - Reconciliation of Adjusted EBITDA
by business segment – 4Q24
| US$ million |
E&P |
RTM |
G&LCE |
CORP. |
ELIMIN. |
TOTAL |
| Net income (loss) |
2,093 |
15 |
166 |
(4,987) |
(53) |
(2,766) |
| Net finance income (expense) |
− |
− |
− |
6,018 |
− |
6,018 |
| Income taxes |
1,071 |
190 |
78 |
(2,100) |
(27) |
(788) |
| Depreciation, depletion and amortization |
2,225 |
600 |
133 |
38 |
− |
2,996 |
| EBITDA |
5,389 |
805 |
377 |
(1,031) |
(80) |
5,460 |
| Results of equity-accounted investments |
(14) |
354 |
(14) |
(3) |
− |
323 |
| Impairment of assets (reversals), net |
1,240 |
337 |
− |
− |
− |
1,577 |
| Results on disposal/write-offs of assets |
(55) |
4 |
5 |
7 |
− |
(39) |
| Results from co-participation agreements in bid areas |
(156) |
− |
− |
− |
− |
(156) |
| Adjusted EBITDA |
6,404 |
1,500 |
368 |
(1,027) |
(80) |
7,165 |
Table 31 - Reconciliation of Adjusted EBITDA
by business segment – 3Q24
| US$ million |
E&P |
RTM |
G&LCE |
CORP. |
ELIMIN. |
TOTAL |
| Net income (loss) |
5,415 |
255 |
121 |
(157) |
257 |
5,891 |
| Net finance income (expense) |
− |
− |
− |
281 |
− |
281 |
| Income taxes |
2,782 |
155 |
57 |
(921) |
132 |
2,205 |
| Depreciation, depletion and amortization |
2,211 |
610 |
130 |
32 |
− |
2,983 |
| EBITDA |
10,408 |
1,020 |
308 |
(765) |
389 |
11,360 |
| Results of equity-accounted investments |
(15) |
45 |
(9) |
2 |
− |
23 |
| Impairment of assets (reversals), net |
− |
− |
− |
− |
− |
− |
| Results on disposal/write-offs of assets |
58 |
13 |
− |
26 |
− |
97 |
| Results from co-participation agreements in bid areas |
− |
− |
− |
− |
− |
− |
| Adjusted EBITDA |
10,451 |
1,078 |
299 |
(737) |
389 |
11,480 |
| |
PETROBRAS | Performance Report | 4Q24 | 40 |
Glossary
Glossary
A
Adjusted
cash and cash equivalents: Sum of cash and cash equivalents and investments in securities in domestic and international markets
that have high liquidity, i.e., convertible into cash within 3 months, even if maturity is longer than 12 months, held for the purpose
of complying with cash commitments. This measure is not defined under the International Financial Reporting Standards – IFRS and
should not be considered in isolation or as a substitute for cash and cash equivalents computed in accordance with IFRS. It may not be
comparable to adjusted cash and cash equivalents of other companies, however management believes that it is an appropriate supplemental
measure to assess our liquidity and supports leverage management.
Adjusted
EBITDA: Adjusted EBITDA (a non-GAAP measure defined as net income plus net finance income (expense); income taxes; depreciation,
depletion and amortization; results in equity-accounted investments; impairment of assets (reversals); results on disposal/write-offs
of assets, remeasurement of investment retained with loss of control and reclassification of CTA; and results from co-participation agreements
in bid areas).
Adjusted
EBITDA margin: Adjusted EBITDA divided by sales revenues.
Average
capital employed: quarterly average considering inventories, intangibles and fixed assets at historical exchange rates.
C
CAPEX
– Capital Expenditure: investments that encompasses acquisition of property, plant, and equipment, including costs with
leasing, intangible assets, investments in subsidiaries and affiliates, costs with geology and geophysics and pre-operating costs.
E
Exploration
& Production (E&P): The segment covers the exploration, development and production of crude oil, NGL and natural gas
in Brazil and abroad, with the main aim of supplying our domestic refineries. This segment also operates through partnerships with other
companies, including interests in foreign companies in this segment.
F
Free
cash flow: Corresponds to operating cash flow minus acquisitions of property, plant and equipment, intangible assets and equity
interests. Free cash flow is not defined under the IFRS and should not be considered in isolation or as a substitute for cash and cash
equivalents calculated in accordance with IFRS. It may not be comparable to free cash flow of other companies, however management believes
that it is an appropriate supplemental measure to assess our liquidity and supports leverage management.
| |
PETROBRAS | Performance Report | 4Q24 | 41 |
Glossary
G
Gas
& Low Carbon Energy (G&LCE): The segment covers the logistics and commercialization of natural gas and electricity,
the transportation and commercialization of LNG, the generation of electricity through thermoelectric plants, as well as the processing
of natural gas. It also includes renewable energy businesses, low carbon services (carbon capture, utilization and storage) and the production
of biodiesel and its products.
I
Investments:
Capital expenditures based on the cost assumptions and financial methodology adopted in our Strategic Plan, which include acquisition
of PP&E, including expenses with leasing, intangibles assets, investment in investees and other items that do not necessarily qualify
as cash flows used in investing activities, primarily geological and geophysical expenses, pre-operating charges, purchase of property,
plant and equipment on credit and borrowing costs directly attributable to works in progress.
L
Leverage:
Ratio between the Net Debt and the sum of Net Debt and Shareholders’ Equity. Leverage is not a measure defined in the IFRS and it
is possible that it may not be comparable to similar measures reported by other companies, however management believes that it is an appropriate
supplemental measure to assess our liquidity.
Lifting
Cost: An indicator that represents the lifting cost per barrel of oil equivalent, considering the ratio between production
and costs. It includes expenses for the execution and maintenance of production. Costs related to the leasing of third-party platforms,
production taxes, and depreciation, depletion, and amortization are not considered in this indicator.
Lifting
Cost + Leases: An indicator that includes costs related to the leasing of third-party platforms in the calculation of Lifting
Cost. Costs related to production taxes and depreciation, depletion, and amortization are not considered.
Lifting
Cost + Production Taxes: An indicator that includes costs related to production taxes in the calculation of Lifting Cost. Costs
related to the leasing of third-party platforms and depreciation, depletion, and amortization are not considered.
Lifting
Cost + Production Taxes + Leases: An indicator that includes costs related to the leasing of third-party platforms and production
taxes in the calculation of Lifting Cost. Costs related to depreciation, depletion, and amortization are not considered.
LTM
Adjusted EBITDA: Sum of the last 12 months (Last Twelve Months) of Adjusted EBITDA. This metric is not foreseen in the international
accounting standards - IFRS and it is possible that it is not comparable with similar indexes reported by other companies, however Management
believes that it is supplementary information to assess liquidity and helps manage leverage. Adjusted EBITDA should be considered in conjunction
with other metrics to better understand the Company's liquidity.
N
Net
Debt: Gross debt less adjusted cash and cash equivalents. Net debt is not a measure defined in the IFRS and should not be considered
in isolation or as a substitute for total long-term debt calculated in accordance with IFRS. Our calculation of net debt may not be comparable
to the calculation of net debt by other companies, however our management believes that net debt is an appropriate supplemental measure
that helps investors assess our liquidity and supports leverage management.
Net
Income by Business Segment: The information by the company's business segment is prepared based on available financial information
that is directly attributable to the segment or that can be allocated on a reasonable basis, being presented by business activities used
by the Executive Board to make resource allocation decisions. and performance evaluation. When calculating segmented results, transactions
with third parties, including jointly controlled and associated companies, and transfers between business segments are considered. Transactions
between business segments are valued at internal transfer prices calculated based on methodologies that take into account market parameters,
and these transactions are eliminated, outside the business segments, for the purpose of reconciling the segmented information with the
consolidated financial statements of the company. company.
| |
PETROBRAS | Performance Report | 4Q24 | 42 |
Glossary
O
Operating
profit after taxes: Adjusted EBITDA, minus DD&A of assets booked at historical exchange rates and 34% income tax rate.
R
Refining,
Transportation and Marketing (RTM): The segment covers refining, logistics, transportation, acquisition
and export of crude oil, as well as trading in oil products in Brazil and abroad. This segment also includes petrochemical operations
(involving interests in petrochemical companies in Brazil) and fertilizer production.
ROCE:
operating profit after taxes / average capital employed, both measured in US$ on a LTM basis
| |
PETROBRAS | Performance Report | 4Q24 | 43 |

SIGNATURES
Pursuant to the requirements of the Securities Exchange Act of 1934,
the registrant has duly caused this report to be signed on its behalf by the undersigned, thereunto duly authorized.
Date: February 26, 2025
PETRÓLEO BRASILEIRO S.A–PETROBRAS
By: /s/ Fernando Sabbi Melgarejo
______________________________
Fernando Sabbi Melgarejo
Chief Financial Officer and Investor Relations
Officer
Petroleo Brasileiro ADR (NYSE:PBR.A)
Historical Stock Chart
From Feb 2025 to Mar 2025

Petroleo Brasileiro ADR (NYSE:PBR.A)
Historical Stock Chart
From Mar 2024 to Mar 2025

