Redfin reports there were 3.7 months of
for-sale supply on the market in January, the most in six years
(NASDAQ: RDFN) — The U.S. housing market has tilted in favor of
buyers for the first time this decade, with 3.7 months of for-sale
supply sitting on the market in January. That’s the most since
February 2019 and up from 3.3 months a year ago, according to a new
report from Redfin (redfin.com), the technology-powered real estate
brokerage.
It’s worth noting that the picture looks different across
different areas of the country, with buyers favored across Sun Belt
metros, while sellers generally have more power in the Northeast
and Midwest.
Historically, four to six months of supply has indicated a
buyer’s market, and January was the closest the U.S. housing market
has come to four months of supply since 2019.
There are a range of other data points signaling favorability
for buyers ahead of the spring homebuying season:
- Sales are slow: Pending sales fell 6.3% in January to
the lowest mark since the early days of the pandemic in April
2020.
- Listings are sitting longer: The typical home sold in
January had been on the market for nearly two months (56 days), the
longest period since February 2020.
- Price growth is slowing: The median U.S. home price was
up 4.1% year over year in January, the slowest growth since
September and more in line with the rate experienced in the late
2010s.
- More negotiation is possible: The typical home sold for
1.8% less than its final asking price in January, the biggest
discount in nearly two years.
- Deals are falling through: Home purchases were canceled
at the highest January rate since at least 2017 last month.
“Historically, a buyer’s market has been defined as when months
of supply reaches 4-6 months—but old definitions don’t fit the
reality of today’s market,” said Redfin Economics Research Lead
Chen Zhao. “Many buyers don’t feel like they are in a buyer’s
market, with home prices at near-record highs and mortgage rates
elevated. But we are more than halfway through the decade and this
is the first time we can say that buyers have as much, if not more,
power than sellers.”
Zhao cautioned that even though the pendulum may have swung in
favor of buyers, these conditions may not last long. More buyers
may start to move off the sidelines when they realize there’s more
inventory available.
Sun Belt metros dominate list of buyer’s markets, while
sellers are still favored in the Northeast
There is more inventory for buyers to choose from—and therefore
more room for negotiation—across the Sun Belt states. This is
particularly the case in Florida, which has six of the top 10 major
metros with the most months of supply.
Cape Coral, FL tops the list, with 11.6 months of supply in
January, up from 8.6 months a year ago. Next comes Miami (11.4
months of supply, +3 months year over year), McAllen, TX (10.5
months, +2.5 months YoY), Fort Lauderdale, FL (10.3 months, +2.9
months YoY) and West Palm Beach, FL (9.6 months, +1.8 months
YoY).
Florida tops the list of buyer’s markets because the
pandemic-driven construction boom has increased housing supply as
buyer demand dries up due to the relative lack of affordability.
Demand has also dropped because of the increased risk of natural
disasters and subsequent higher insurance costs.
“It’s 100% a buyer’s market right now,” said Bryan Carnaggio, a
Redfin Premier agent in Jacksonville, FL. “There’s a ton of
inventory. Everywhere you go, there’s a house for sale. Most
sellers here know the market is bad and it’s not advantageous to
sell right now, but either they’re tired of waiting for things to
improve, or they really have to sell because they are moving out of
state. For buyers, this means there are more opportunities to
negotiate on price and terms.”
Top Buyer’s Markets (January
2025)
Review of 100 most populous metro areas,
ranked by months of supply
Rank
Market
Months of Supply
Months of Supply YoY
(in months)
1
Cape Coral, FL
11.6
+3
2
Miami, FL
11.4
+3
3
McAllen, TX
10.5
+2.5
4
Fort Lauderdale, FL
10.3
+2.9
5
West Palm Beach, FL
9.6
+1.8
6
New Orleans, LA
8.1
+0.3
7
North Port, FL
7.3
+0.6
8
Honolulu, HI
6.4
+0.6
9
Jacksonville, FL
6.3
+1.1
10
San Antonio, TX
6
+0.4
At the other end of the spectrum, major markets across the
Northeast still tilt in favor of sellers, with limited supply
available due to higher buyer demand.
Rochester, NY had 1.1 months of supply in January (-0.1 months
year over year), the least amount of the 100 most populous metros
Redfin analyzed. Next came Buffalo, NY (1.2 months of supply, -0.2
months YoY), Hartford, CT (1.4 months of supply, -0.3 months YoY),
Grand Rapids, MI (1.5 months of supply, no change YoY) and
Worcester, MA (1.6 months of supply, no change YoY).
Top Seller’s Markets (January
2025)
Review of 100 most populous metro areas,
ranked by months of supply
Rank
Market
Months of Supply
Months of Supply YoY
(in months)
1
Rochester, NY
1.1
-0.1
2
Buffalo, NY
1.2
-0.2
3
Hartford, CT
1.4
-0.3
4
Grand Rapids, MI
1.5
0
5
Worcester, MA
1.6
0
6
San Jose, CA
1.7
0.1
7
Montgomery County, PA
1.7
0
8
Albany, NY
1.7
-0.5
9
Allentown, PA
1.7
-0.2
10
Boston, MA
1.8
-0.2
"Rochester's seller's market is driven by a severe shortage of
homes for sale, and few homeowners have chosen to list during this
year's cold, snowy winter," said Kimberly Hogue, a Redfin Agent in
Rochester. "Home listings that are in decent shape and in
sought-after neighborhoods are met with a flurry of buyers. These
homes typically go quickly and for well over list price."
To view the full report, including methodology and additional
metro-level insights, please visit:
https://www.redfin.com/news/buyers-market-february-2025
About Redfin
Redfin (www.redfin.com) is a technology-powered real estate
company. We help people find a place to live with brokerage,
rentals, lending, and title insurance services. We run the
country's #1 real estate brokerage site. Our customers can save
thousands in fees while working with a top agent. Our home-buying
customers see homes first with on-demand tours, and our lending and
title services help them close quickly. Our rentals business
empowers millions nationwide to find apartments and houses for
rent. Since launching in 2006, we've saved customers more than $1.6
billion in commissions. We serve approximately 100 markets across
the U.S. and Canada and employ over 4,000 people.
Redfin’s subsidiaries and affiliated brands include: Bay Equity
Home Loans®, Rent.™, Apartment Guide®, Title Forward® and
WalkScore®.
For more information or to contact a local Redfin real estate
agent, visit www.redfin.com. To learn about housing market trends
and download data, visit the Redfin Data Center. To be added to
Redfin's press release distribution list, email press@redfin.com.
To view Redfin's press center, click here.
View source
version on businesswire.com: https://www.businesswire.com/news/home/20250219498020/en/
Contact Redfin Redfin Journalist Services: Kenneth Applewhaite
press@redfin.com
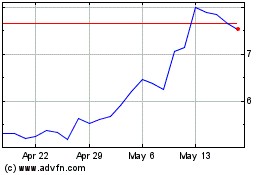
Redfin (NASDAQ:RDFN)
Historical Stock Chart
From Jan 2025 to Feb 2025

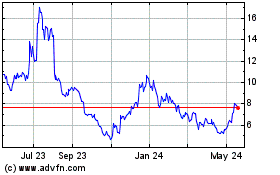
Redfin (NASDAQ:RDFN)
Historical Stock Chart
From Feb 2024 to Feb 2025
